

Adherens junction remodelling during mitotic rounding of pseudostratified epithelial cells
- PMID: 32030856
- PMCID: PMC7132200
- DOI: 10.15252/embr.201949700
Adherens junction remodelling during mitotic rounding of pseudostratified epithelial cells
Abstract
Epithelial cells undergo cortical rounding at the onset of mitosis to enable spindle orientation in the plane of the epithelium. In cuboidal epithelia in culture, the adherens junction protein E-cadherin recruits Pins/LGN/GPSM2 and Mud/NuMA to orient the mitotic spindle. In the pseudostratified columnar epithelial cells of Drosophila, septate junctions recruit Mud/NuMA to orient the spindle, while Pins/LGN/GPSM2 is surprisingly dispensable. We show that these pseudostratified epithelial cells downregulate E-cadherin as they round up for mitosis. Preventing cortical rounding by inhibiting Rho-kinase-mediated actomyosin contractility blocks downregulation of E-cadherin during mitosis. Mitotic activation of Rho-kinase depends on the RhoGEF ECT2/Pebble and its binding partners RacGAP1/MgcRacGAP/CYK4/Tum and MKLP1/KIF23/ZEN4/Pav. Cell cycle control of these Rho activators is mediated by the Aurora A and B kinases, which act redundantly during mitotic rounding. Thus, in Drosophila pseudostratified epithelia, disruption of adherens junctions during mitosis necessitates planar spindle orientation by septate junctions to maintain epithelial integrity.
Keywords: E-cadherin; cortex; mitosis; myosin.
© 2020 The Authors. Published under the terms of the CC BY 4.0 license.
Conflict of interest statement
The authors declare that they have no conflict of interest.
Figures
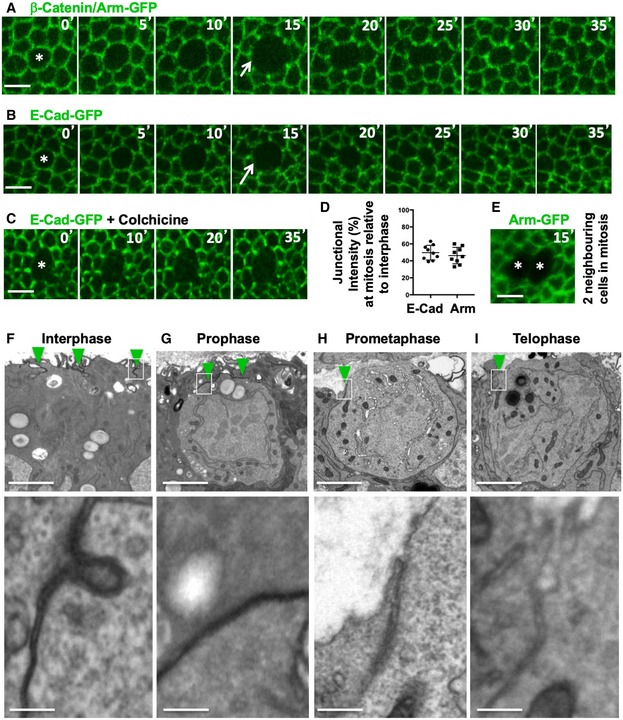
- A
Dynamic regulation of fluorescently tagged beta‐catenin/Armadillo (Arm‐GFP) during mitosis in the growing fly wing epithelium. Notice downregulation of Arm‐GFP as cells round up for mitosis (arrow). Scale bar ˜2 μm. n > 10 independent biological replicates.
- B
Dynamic regulation of fluorescently tagged E‐cadherin (E‐cad‐GFP) during mitosis in the growing fly wing epithelium. Notice downregulation of E‐cad‐GFP as cells round up for mitosis (arrow). Scale bar ˜2 μm. n > 10 independent biological replicates.
- C
E‐cad‐GFP remains downregulated in cells arrested in mitosis with colchicine. Scale bar ˜2 μm. n > 10 independent biological replicates.
- D
Quantification of the degree of downregulation of Arm‐GFP and E‐cad‐GFP at the junction between mitotic cells and their interphase neighbours (n > 10 independent samples per cell cycle stage). Mean ± 1 SD shown.
- E
Two adjacent mitotic cells show no detectable Arm‐GFP at the junction between them. Scale bar ˜2 μm.
- F–I
Electron microscopy cross‐sections of wing epithelial cells at interphase, prophase, prometaphase and telophase. Notice adherens junctions (dark staining, highlighted in insets) are downregulated as cells round up for mitosis. Scale bars ˜1 μm (low mag.) and ˜10 nm (high mag.). n > 10 independent biological replicates. Asterisks indicate a single mitotic cell. Green arrowheads indicate adherens junctions.
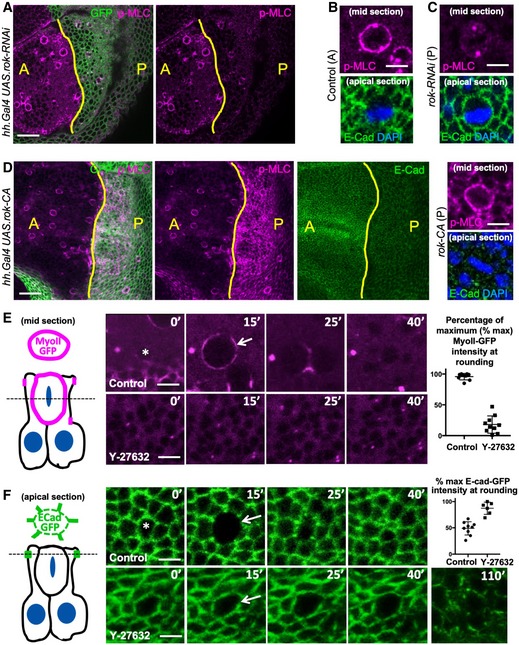
Phosphorylated Myosin‐II regulatory light chain (p‐MLC; purple) detected by antibody staining reveals high levels around the cortex of rounded mitotic cells in wild‐type wing epithelial cells in the anterior (A) compartment, but not in Rho‐kinase (Rok) RNAi expressing cells of the posterior (P) compartment (GFP‐positive; green). Scale bar ˜10 μm. n > 10 independent biological replicates.
High‐magnification view of single mitotic cell stained for p‐MLC (purple) and E‐cadherin (green), with metaphase plate chromosomes stained by DAPI (blue). Scale bar ˜1 μm. n > 10 independent biological replicates.
High‐magnification view of single UAS.Rok‐RNAi expressing mitotic cell stained for p‐MLC (purple) and E‐cadherin (green), with metaphase plate chromosomes stained by DAPI (blue). Note loss of cortical p‐MLC staining (purple). Scale bar ˜1 μm. n > 10 independent biological replicates.
Expression of constitutively active Rho‐kinase (UAS.Rok‐CA) in the posterior compartment of the wing epithelium is sufficient to elevate p‐MLC and reduce E‐cadherin immunostaining. Zoom (right) shows high p‐MLC and low E‐cad in both a mitotic cell and its neighbours. Scale bar ˜10 μm. n > 10 independent biological replicates.
MyoII RLC‐GFP (MyoII‐GFP) accumulates at the cortex as cells round up for mitosis and later appears at the cleavage furrow during cytokinesis (basal section, diagrammed left). Treatment with the Rho‐kinase inhibitor Y‐27632 inhibits mitotic accumulation of MyoII‐GFP. Quantification shown right (n = 8 independent samples per genotype). Scale bar ˜1 μm. Mean ± 1 SD shown.
E‐cad‐GFP is downregulated as cells round up for mitosis (apical section, diagrammed left). Treatment with the Rho‐kinase inhibitor Y‐27632 inhibits mitotic downregulation of E‐cad‐GFP. Extended treatment with Y‐27632 leads to a general defect in all interphase and mitotic cells in which apical surface areas enlarge and E‐cad‐GFP is generally lost. Arrow indicates mitotic cell cortex at maximal rounding. Quantification shown right (n = 6 independent samples per genotype; mean ± 1 SD shown). Scale bar ˜1 μm.
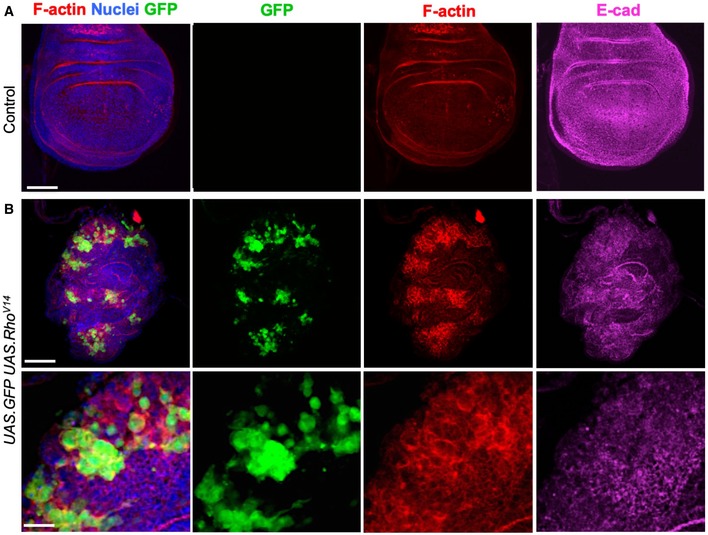
Control third instar wing imaginal disc stained for F‐actin (phalloidin, red) and E‐cadherin (magenta). Note absence of clones (GFP), there is no background signal for GFP. Scale bar ˜20 μm. n > 4 independent biological replicates.
Induction of clones expressing UAS.GFP and UAS.RhoV14 causes dramatic increases in F‐actin and co‐incident decreases in E‐cadherin, along with abnormal tissue morphology. High‐magnification view (bottom) shows reduced E‐cadherin and rounded shape of cells expressing RhoV14. Scale bars ˜20 μm (low mag) ˜10 μm (high mag). n > 4 independent biological replicates.
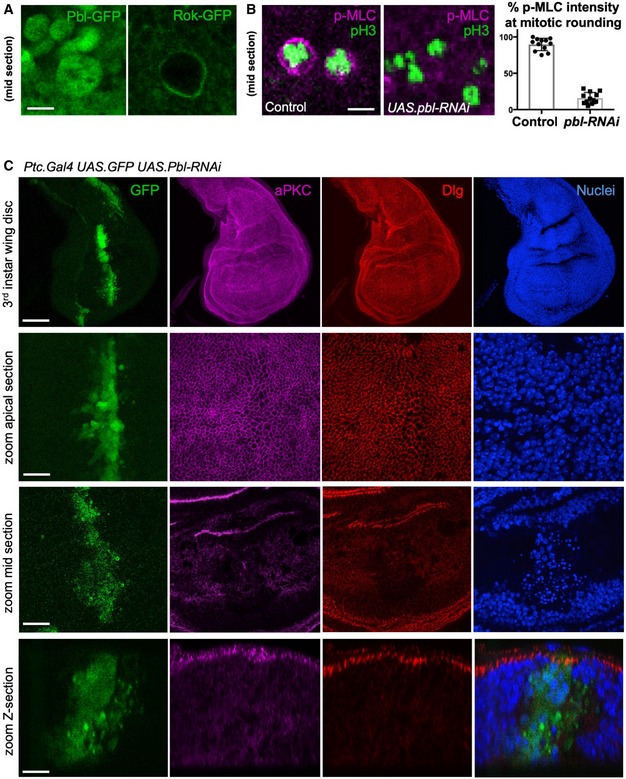
Nuclear localised Pbl‐GFP becomes cytoplasmic in mitotic cells, co‐incident with Rok‐GFP re‐localisation to the plasma membrane. Scale bar ˜1 μm. n > 5 independent biological replicates.
Phosphorylated Myosin‐II regulatory light chain (p‐MLC; purple) detected by antibody staining reveals high levels around the cortex of rounded mitotic cells in wild‐type wing epithelial cells, but not those expressing UAS.pbl‐RNAi. Phospho‐Histone H3 (pH3) staining (green) marks mitotic cell chromosomes. Quantification shown right (n > 10 independent samples per genotype; mean ± 1 SD shown). Scale bar ˜1 μm.
A stripe of expression of ptc.Gal4 UAS.pbl‐RNAi in the wing disc leads to both enlarged cells and many basally extruded cells that undergo apoptosis, marked by pyknotic nuclei and loss of aPKC/Dlg staining. Scale bars ˜20 μm. n > 6 independent biological replicates.
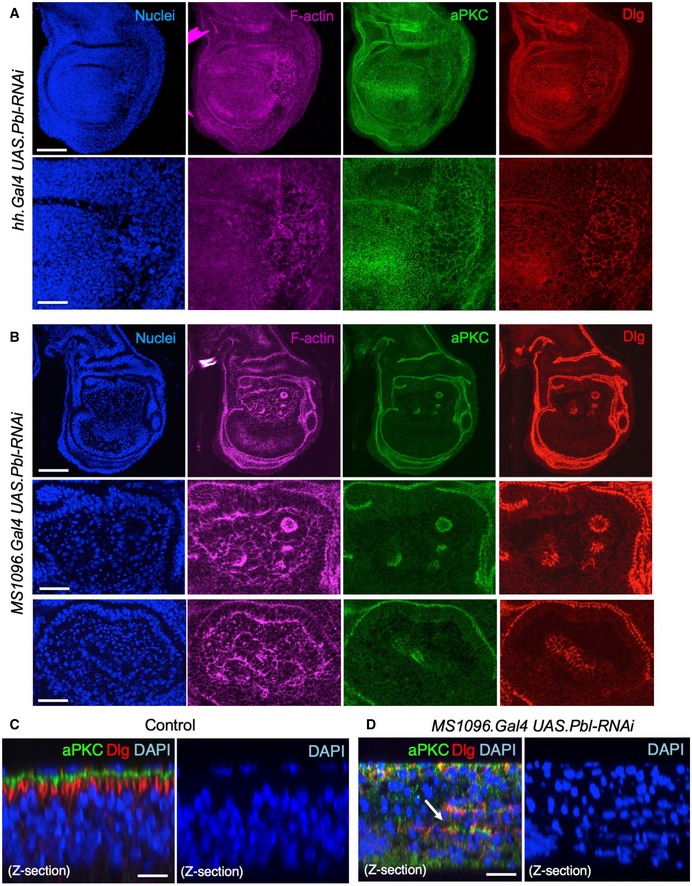
Third instar wing imaginal disc expressing UAS.Pbl‐RNAi in the posterior compartment driven by the hh.Gal4 line. Note enlarged cells (marked by F‐actin, aPKC or Dlg staining). DAPI marks nuclei. Scale bars ˜20 μm (low mag) ˜5 μm (high mag). n > 6 independent biological replicates.
Third instar wing imaginal disc expressing UAS.Pbl‐RNAi in the entire wing pouch driven by the MS1096.Gal4 line. Note many extruded cells (marked by F‐actin, aPKC or Dlg staining). DAPI marks nuclei, including many pyknotic nuclei due to apoptosis. Scale bars ˜20 μm (low mag) ˜5 μm (high mag). n > 7 independent biological replicates.
Control cross‐section of wild‐type third instar wing disc stained for aPKC, Dlg and nuclei (DAPI). Scale bar ˜2 μm. n > 4 independent biological replicates.
Cross‐section of third instar wing imaginal disc expressing UAS.Pbl‐RNAi in the entire wing pouch driven by the MS1096.Gal4 line. Note extrusion of cells (revealed by staining for aPKC, Dlg) and many pyknotic nuclei (DAPI staining). Arrow shows residual polarised apical domains in cells that have been extruded. Scale bar ˜2 μm. n > 9 independent biological replicates.
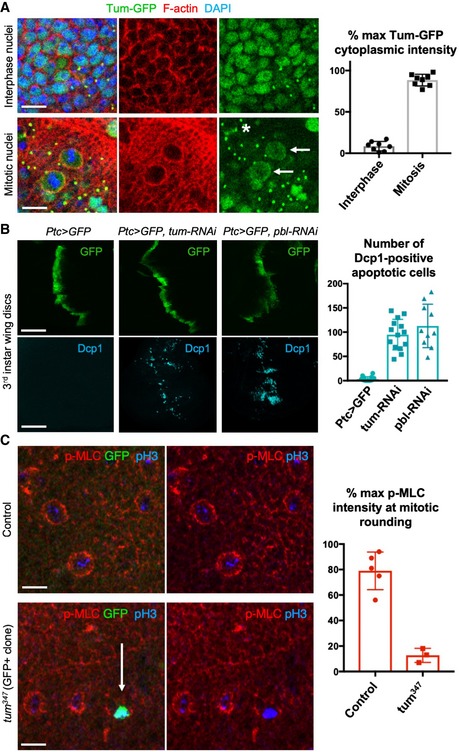
Nuclear localised Tum‐GFP becomes cytoplasmic in mitotic cells, including a distinct plasma membrane localisation (arrows). Note also localisation to the cytokinetic ring (asterisk) and remnant mid‐bodies/ring canals in interphase cells. Quantification shown on the right (n > 7 independent samples per genotype; mean ± 1 SD shown). Scale bars ˜2 μm.
A stripe of expression of ptc.Gal4 UAS.tum‐RNAi in the wing disc leads to basally extruded cells that undergo apoptosis, marked by Dcp1 immunostaining, similar to UAS.pbl‐RNAi. Quantification shown on the right (n > 10 independent samples per genotype; mean ± 1 SD shown). Scale bars ˜20 μm.
Phosphorylated Myosin‐II regulatory light chain (p‐MLC; red) detected by antibody staining reveals high levels around the cortex of rounded mitotic cells in wild‐type wing epithelial cells, but not those cells homozygous mutant for tum 347, marked by expression of GFP in single‐celled clones (MARCM system). pH3 staining (blue) marks mitotic cell chromosomes. Arrow indicates a GFP‐positive single‐cell tum 347 mutant clone. Quantification shown on the right (n > 3 independent samples per genotype; mean ± 1 SD shown). Scale bars ˜20 μm.
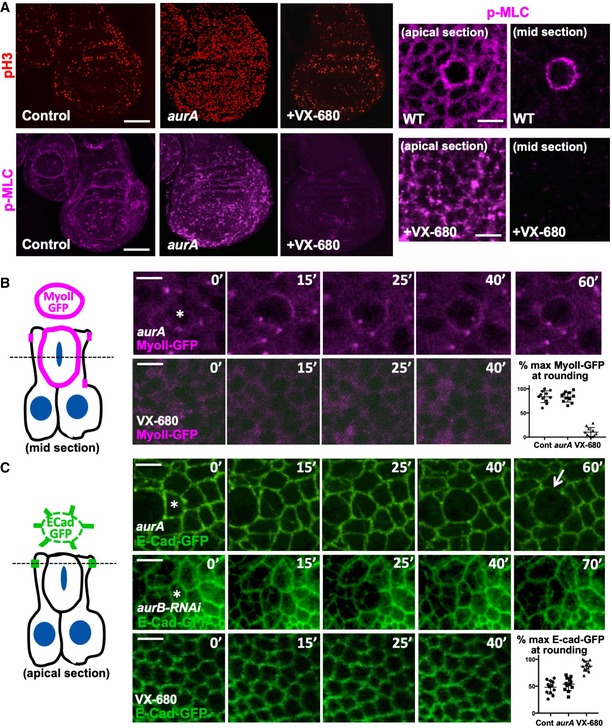
Phosphorylated Myosin‐II regulatory light chain (p‐MLC; purple) detected by antibody staining reveals high levels around the cortex of rounded mitotic cells (pH3, red) in wild‐type wing discs, and aurA homozygous mutant wing discs, but not upon inhibition of both AurA and AurB by treatment with VX‐680. Note increased numbers of mitotic cells in aurA homozygous mutant wing discs, due to delayed mitotic progression. Scale bars ˜20 μm (low mag.) and ˜1 μm (high mag.). n > 15 independent biological replicates.
Live imaging of MyoII‐GFP reveals delayed mitosis in aurA homozygous mutant wing discs, while inhibition of both AurA and AurB by treatment with VX‐680 leads to complete loss of mitotic rounding and MyoII‐GFP membrane localisation. Asterisks indicate a single mitotic cell. Scale bars ˜1 μm. Quantification shown on the bottom right (n = 5 independent samples per genotype).
Live imaging of E‐cad‐GFP reveals delayed mitosis in aurA homozygous mutant wing discs, cytokinesis failure in UAS.aurB‐RNAi expressing wing discs, and complete failure of mitotic rounding and E‐cad‐GFP downregulation upon inhibition of both AurA and AurB by treatment with VX‐680. Asterisks indicate a single mitotic cell. Scale bars ˜1 μm. Quantification shown on the bottom right (n = 9 independent samples per genotype).
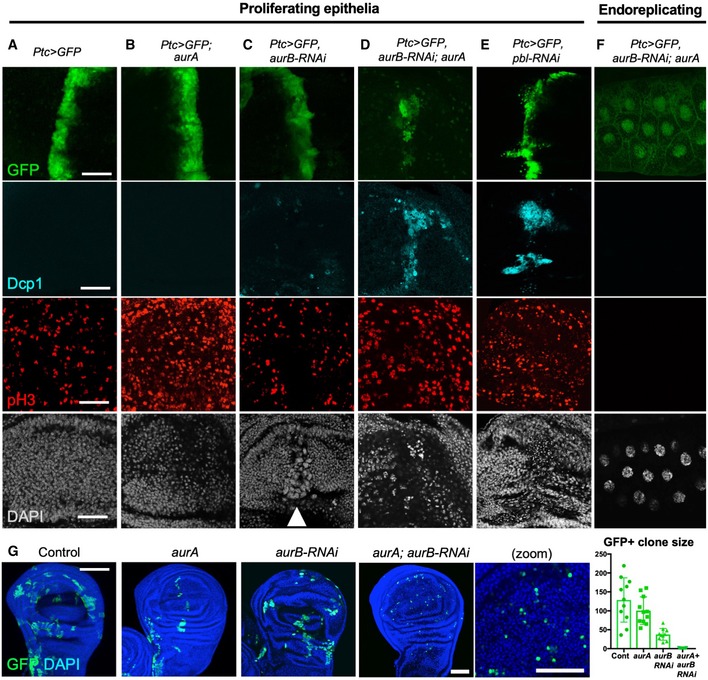
Striped ptc.Gal4‐driven expression of UAS.GFP in a control wing imaginal disc. Scale bars ˜20 μm. n > 6 independent biological replicates.
Striped ptc.Gal4‐driven expression of UAS.GFP in an aurA homozygous mutant wing imaginal disc leads to increased numbers of pH3‐positive mitotic cells. n > 7 independent biological replicates.
Striped ptc.Gal4‐driven expression of UAS.GFP and UAS.aurB‐RNAi in a control wing imaginal disc leads to enlarged cells with large nuclei (marked by DAPI; white arrowhead). n > 6 independent biological replicates.
Striped ptc.Gal4‐driven expression of UAS.GFP and UAS.aurB‐RNAi in an aurA homozygous mutant wing imaginal disc leads to extrusion and apoptosis of cells (marked by Dcp1 and pyknotic nuclei). n > 8 independent biological replicates.
Striped ptc.Gal4‐driven expression of UAS.GFP and UAS.pbl‐RNAi in the wing imaginal disc leads to extrusion and apoptosis of cells (marked by Dcp1 and pyknotic nuclei). n > 8 independent biological replicates.
ptc.Gal4‐driven expression of UAS.aurB‐RNAi in an aurA homozygous mutant endoreplicating salivary gland has no phenotypic consequence. n > 6 independent biological replicates.
MARCM clones (GFP‐positive) expressing UAS.aurB‐RNAi in an aurA homozygous mutant cells result in single‐cell clones (i.e. no cell division), while individual loss of AurA or AurB allows some cell proliferation. Quantification shown on the right (n > 7 independent samples per genotype; mean ± 1 SD shown). Scale bar ˜20 μm.
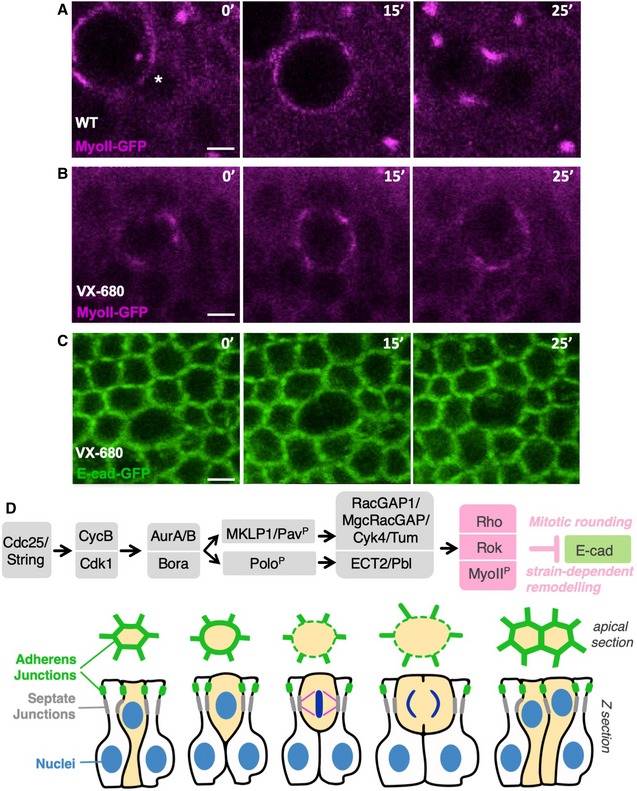
Live imaging of MyoII‐GFP in a control wing disc epithelium. Asterisk indicates the location of a single mitotic cell about to initiate rounding. Scale bar ˜1 μm. n > 5 independent biological replicates.
Live imaging of MyoII‐GFP upon treatment with the dual AurA/B inhibitor VX‐680 after initiation of mitotic rounding, which rapidly arrests progression of rounding and prevents cytokinesis. Scale bar ˜1 μm. n > 9 independent biological replicates.
Live imaging of E‐cad‐GFP upon treatment with the dual AurA/B inhibitor VX‐680 after initiation of mitotic rounding, which rapidly arrests progression of rounding and prevents cytokinesis. Scale bar ˜1 μm. n > 6 independent biological replicates.
Working model for mitotic rounding and junctional downregulation in pseudostratified Drosophila epithelial cells.
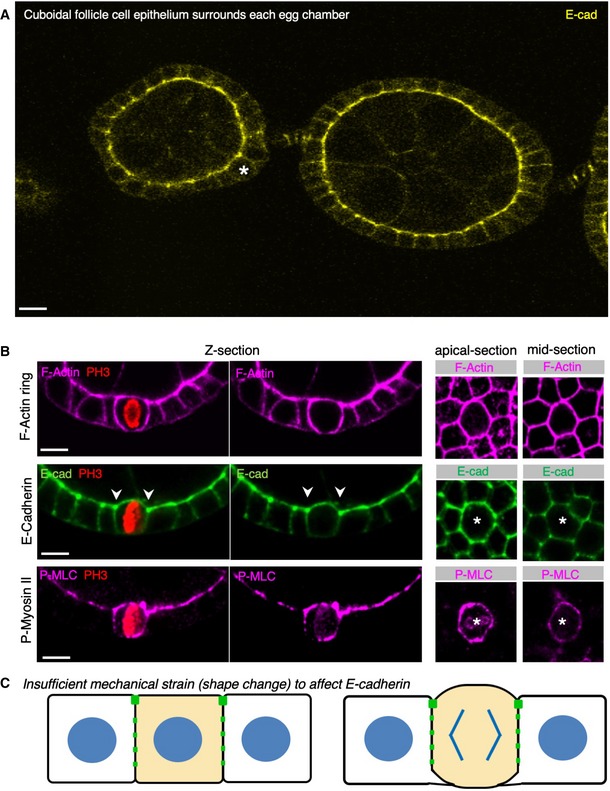
Early stage Drosophila egg chambers showing giant germ‐line nurse cells surrounded by E‐cadherin‐positive follicle cell epithelium. A follicle cell undergoing mitotic rounding is highlighted with an asterisk (*). Scale bar ˜3 μm. n > 3 independent biological replicates.
High‐resolution imaging of the F‐actin cortex, E‐cadherin and phospho‐MyoII in a mitotically rounded follicle cell. Note maintenance of adherens junctions including both E‐cad and the contractile actomyosin ring during mitotic rounding. Asterisks or pH3 staining indicates a single mitotic cell. Scale bar ˜3 μm. n > 4 independent biological replicates.
Schematic diagram of follicle cell rounding, showing the relatively mild shape change that is insufficient to affect E‐cadherin levels during mitotic rounding.
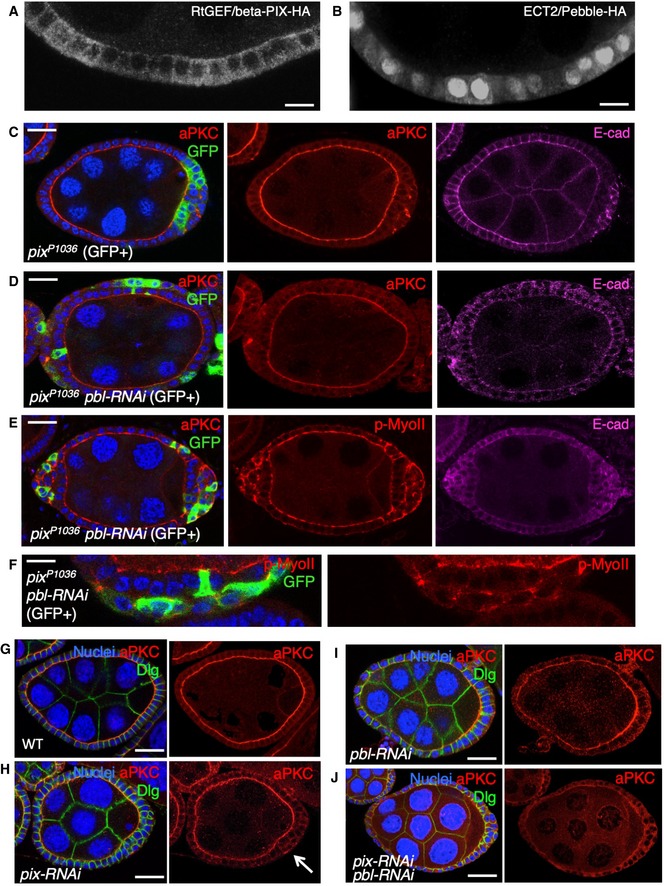
Cross‐section of cuboidal follicular epithelium showing cytoplasmic localisation of overexpressed Cdc42 GEF beta‐PIX tagged with HA. Scale bar ˜3 μm. n > 4 independent biological replicates.
Cross‐section of cuboidal follicular epithelium showing nuclear and cytoplasmic localisation of overexpressed ECT2/Pbl tagged with HA. Scale bar ˜3 μm. n > 10 independent biological replicates.
Stage 7 egg chamber in which follicle cells have mutant clones for pix P1036, marked by expression of GFP, shows extrusion of cells which retain abnormal aPKC and E‐cad localisation. Scale bar ˜6 μm. n > 4 independent biological replicates.
Stage 7 egg chamber in which follicle cells have mutant clones for pix P1036 also expressing UAS.Pbl‐RNAi, marked by expression of GFP, shows extrusion of cells featuring loss of aPKC plasma membrane localisation, along with abnormal E‐cad localisation. Scale bar ˜6 μm. n > 3 independent biological replicates.
Stage 7 egg chamber in which follicle cells have mutant clones for pix P1036 also expressing UAS.Pbl‐RNAi, marked by expression of GFP, shows extrusion of cells featuring mislocalisation of p‐MyoII (p‐MLC), along with abnormal E‐cad localisation. Scale bar ˜6 μm. n > 3 independent biological replicates.
High‐magnification view of mutant clones for pix P1036 also expressing UAS.Pbl‐RNAi, marked by expression of GFP, shows extrusion of cells featuring mislocalisation of p‐MyoII (p‐MLC). Scale bar ˜3 μm. n > 3 independent biological replicates.
Wild‐type stage 7 egg chamber in which follicle cells have normal aPKC and Dlg localisation. Scale bar ˜6 μm. n > 4 independent biological replicates.
tj.Gal4‐driven UAS.pix‐RNAi causes mild extrusion of cells with abnormal aPKC localisation (arrow). Scale bar ˜6 μm. n > 5 independent biological replicates.
tj.Gal4‐driven UAS.pbl‐RNAi causes enlarged cells with normal morphology and aPKC localisation. Scale bar ˜6 μm. n > 3 independent biological replicates.
tj.Gal4‐driven UAS.pix‐RNAi and UAS.pbl‐RNAi causes loss of aPKC throughout the follicular epithelium, while Dlg spreads ectopically. Scale bar ˜6 μm. n > 9 independent biological replicates.
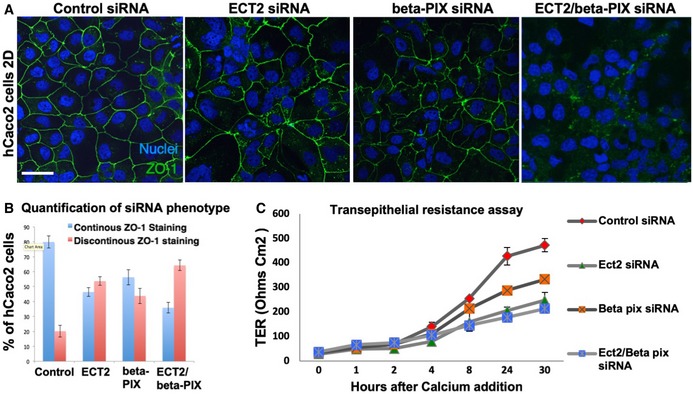
siRNA knockdown of ECT2 and beta‐PIX individually does not affect the localisation of ZO‐1, while double siRNA causes discontinuous ZO‐1 localisation in most cells. Scale bar ˜10 μm. n > 3 independent biological replicates.
Quantification of (A). n > 3 independent biological replicates. Mean ± SEM shown.
Transepithelial resistance assay for measuring tight junction function in each of the siRNA conditions in (A). n > 3 independent biological replicates. Mean ± SEM shown.
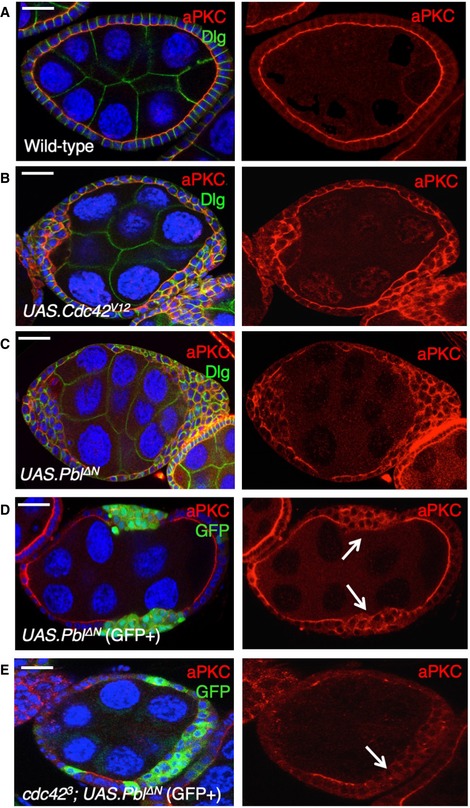
Wild‐type stage 7 egg chamber showing normal localisation of aPKC and Dlg in the follicle cell epithelium. Scale bar ˜6 μm. n > 4 independent biological replicates.
tj.Gal4‐driven UAS.Cdc42 V12 causes ectopic spreading of aPKC in most cells. Scale bar ˜6 μm. n > 3 independent biological replicates.
tj.Gal4‐driven UAS.Pbl‐deltaN causes ectopic spreading of aPKC in most cells. Scale bar ˜6 μm. n > 6 independent biological replicates.
MARCM clonal induction of UAS.Pbl‐deltaN and UAS.GFP causes ectopic spreading of aPKC in most GFP‐positive cells. Scale bar ˜6 μm. n > 5 independent biological replicates. Arrows point to GFP+ clones.
MARCM induction of UAS.Pbl‐deltaN and UAS.GFP in cdc42 3 mutant clones causes loss of aPKC in most GFP‐positive cells. This result indicates that overexpressed Pbl acts upstream of Cdc42 to control aPKC localisation. Scale bar ˜6 μm. n > 3 independent biological replicates. Arrows point to GFP+ clones.
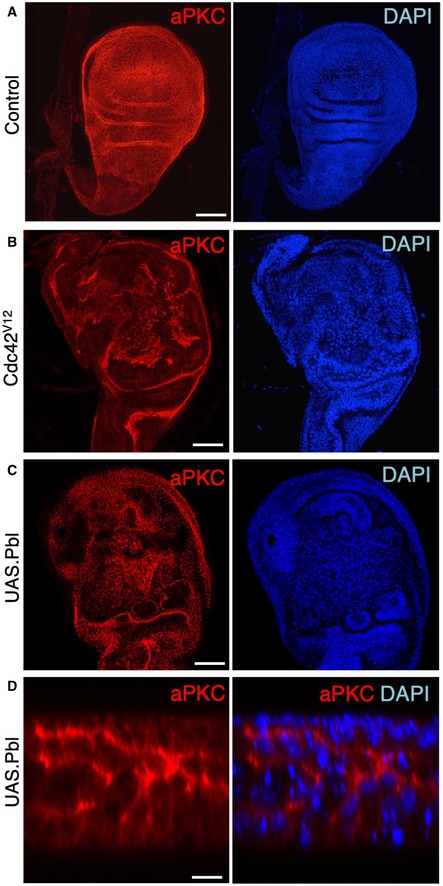
Control third instar wing disc stained for aPKC and nuclei (DAPI). Scale bar ˜20 μm. n > 3 independent biological replicates.
MS1096.Gal4‐driven UAS.Cdc42 V12 causes ectopic spreading of aPKC and abnormal tissue morphology. Scale bar ˜20 μm. n > 6 independent biological replicates.
MS1096.Gal4‐driven UAS.Pbl causes ectopic spreading of aPKC and abnormal tissue morphology. Scale bar ˜20 μm. n > 8 independent biological replicates.
High‐magnification cross‐section of MS1096.Gal4‐driven UAS.Pbl causing ectopic spreading of aPKC and abnormal tissue morphology. The phenotypes of Cdc42 and Pbl gain of function are similar in the wing disc. Scale bar ˜2 μm. n > 4 independent biological replicates.
References
-
- Gibson MC, Perrimon N (2003) Apicobasal polarization: epithelial form and function. Curr Opin Cell Biol 15: 747–752 - PubMed
-
- Tepass U (2012) The apical polarity protein network in Drosophila epithelial cells: regulation of polarity, junctions, morphogenesis, cell growth, and survival. Annu Rev Cell Dev Biol 28: 655–685 - PubMed
-
- Thompson BJ (2013) Cell polarity: models and mechanisms from yeast, worms and flies. Development 140: 13–21 - PubMed
-
- Gates J, Peifer M (2005) Can 1000 reviews be wrong? Actin, alpha‐Catenin, and adherens junctions. Cell 123: 769–772 - PubMed
Publication types
MeSH terms
Grants and funding
LinkOut - more resources
Full Text Sources
Molecular Biology Databases
Research Materials
Miscellaneous
