

Genomic signatures and candidate genes of lint yield and fibre quality improvement in Upland cotton in Xinjiang
- PMID: 32030869
- PMCID: PMC7540456
- DOI: 10.1111/pbi.13356
Genomic signatures and candidate genes of lint yield and fibre quality improvement in Upland cotton in Xinjiang
Abstract
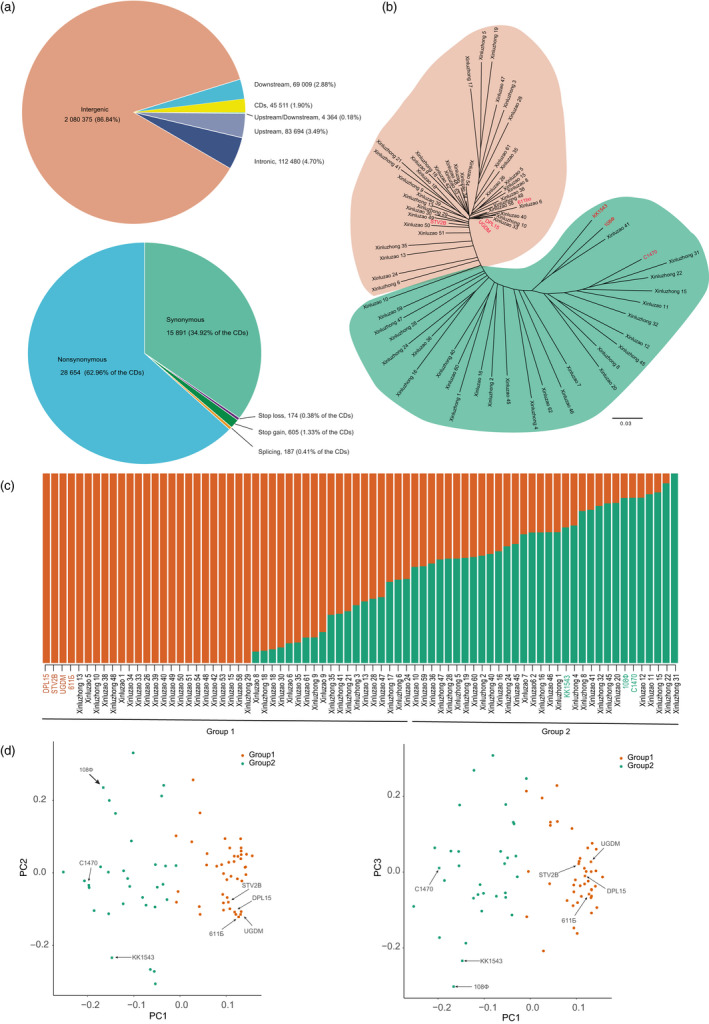
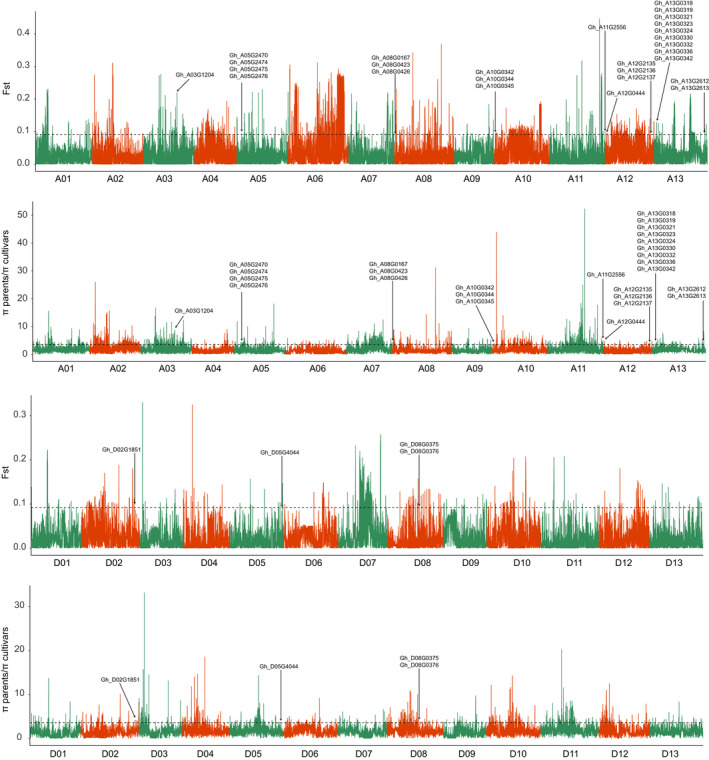
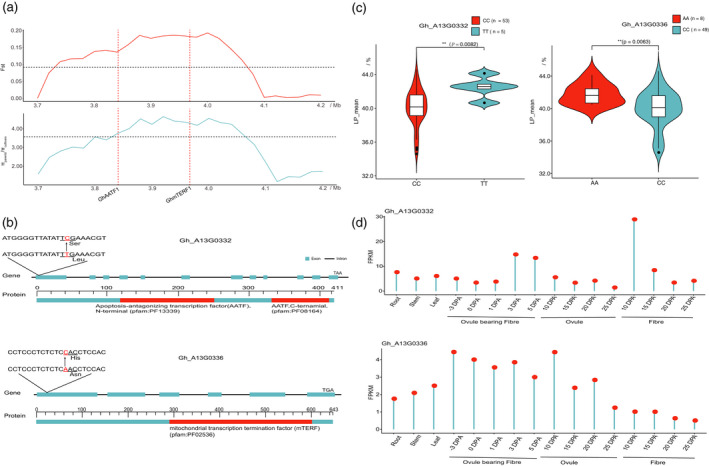
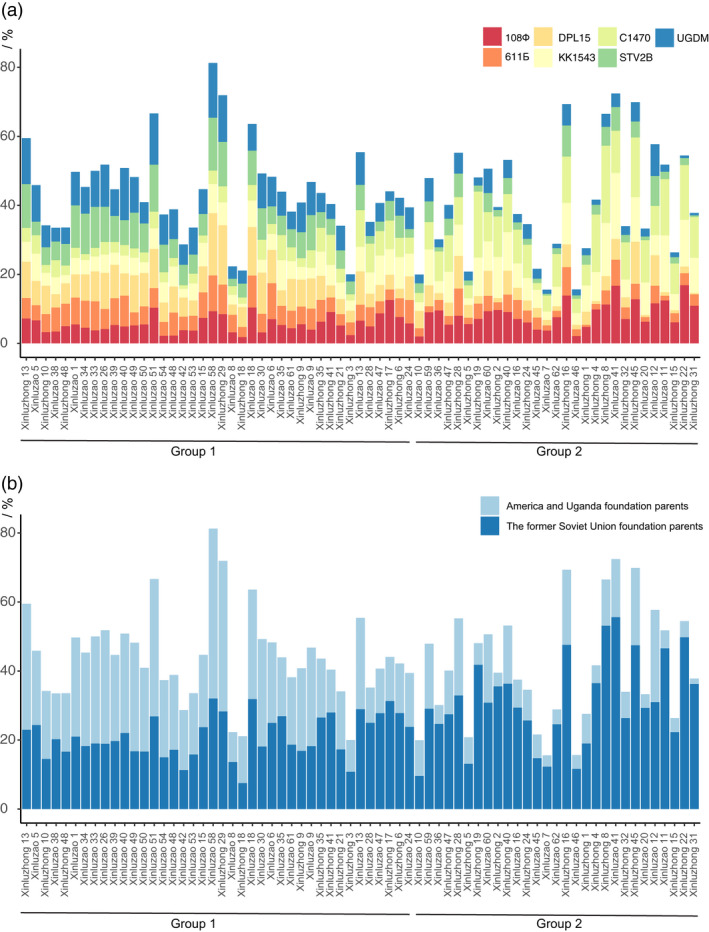
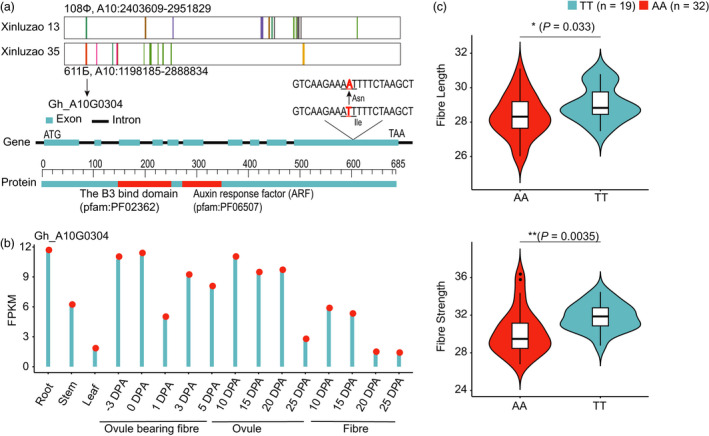
Xinjiang has been the largest and highest yield cotton production region not only in China, but also in the world. Improvements in Upland cotton cultivars in Xinjiang have occurred via pedigree selection and/or crossing of elite alleles from the former Soviet Union and other cotton producing regions of China. But it is unclear how genomic constitutions from foundation parents have been selected and inherited. Here, we deep-sequenced seven historic foundation parents, comprising four cultivars introduced from the former Soviet Union (108Ф, C1470, 611Б and KK1543) and three from United States and Africa (DPL15, STV2B and UGDM), and re-sequenced sixty-nine Xinjiang modern cultivars. Phylogenetic analysis of more than 2 million high-quality single nucleotide polymorphisms allowed their classification two groups, suggesting that Xinjiang Upland cotton cultivars were not only spawned from 108Ф, C1470, 611Б and KK1543, but also had a close kinship with DPL15, STV2B and UGDM. Notably, identity-by-descent (IBD) tracking demonstrated that the former Soviet Union cultivars have made a huge contribution to modern cultivar improvement in Xinjiang. A total of 156 selective sweeps were identified. Among them, apoptosis-antagonizing transcription factor gene (GhAATF1) and mitochondrial transcription termination factor family protein gene (GhmTERF1) were highly involved in the determination of lint percentage. Additionally, the auxin response factor gene (GhARF3) located in inherited IBD segments from 108Ф and 611Б was highly correlated with fibre quality. These results provide an insight into the genomics of artificial selection for improving cotton production and facilitate next-generation precision breeding of cotton and other crops.
Keywords: Gossypium hirsutum; Xinjiang cotton improvement; identity by descent; resequencing.
© 2020 The Authors. Plant Biotechnology Journal published by Society for Experimental Biology and The Association of Applied Biologists and John Wiley & Sons Ltd.
Conflict of interest statement
The authors declare no competing financial interests.
Figures
References
-
- Abdullaev, A. , Abdullaev, A.A. , Salakhutdinov, I. , Rizaeva, S. , Kuryazov, Z. , Ernazarova, D. and Abdurakhmonov, I. (2013) Cotton germplasm collection of Uzbekistan. Asian Australas. J. Plant Sci. Biotechnol. Glob. Sci. Books, 7, 1–15.
-
- Altschul, S.F. , Gish, W. , Miller, W. , Myers, E.W. and Lipman, D.J. (1990) Basic local alignment search tool. J. Mol. Biol. 215, 403–410. - PubMed
-
- Babiychuk, E. , Vandepoele, K. , Wissing, J. , Garcia‐Diaz, M. , De Rycke, R. , Akbari, H. , Joubes, J. et al. (2011) Plastid gene expression and plant development require a plastidic protein of the mitochondrial transcription termination factor family. Proc. Natl. Acad. Sci. USA, 108, 6674–6679. - PMC - PubMed
-
- Bevan, M.W. , Uauy, C. , Wulff, B.B. , Zhou, J. , Krasileva, K. and Clark, M.D. (2017) Genomic innovation for crop improvement. Nature, 543, 346–354. - PubMed
-
- Bowman, D.T. , Gutierrez, O.A. , Percy, R.G. , Calhoun, D.S. and May, O.L. (2006) Pedigrees of upland and pima cotton cultivars released between 1970 and 2005. Bulletin, 11, 55–57.
Grants and funding
LinkOut - more resources
Full Text Sources
