. 2020 Feb 7;61(2):4.
doi: 10.1167/iovs.61.2.4.

Vitamin-D3 (α-1, 25(OH) 2D3) Protects Retinal Pigment Epithelium From Hyperoxic Insults

Affiliations

Vitamin-D3 (α-1, 25(OH) 2D3) Protects Retinal Pigment Epithelium From Hyperoxic Insults

Ponnalagu Murugeswari et al. Invest Ophthalmol Vis Sci. .

Abstract

Purpose: Oxidative stress affects the retinal pigment epithelium (RPE) leading to development of vascular eye diseases. Cholecalciferol (VIT-D) is a known modulator of oxidative stress and angiogenesis. This in vitro study was carried out to evaluate the protective role of VIT-D on RPE cells incubated under hyperoxic conditions.

Methods: Cadaver primary RPE (PRPE) cells were cultured in hyperoxia (40% O2) with or without VIT-D (α-1, 25(OH) 2D3). The functional and physiological effects of PRPE cells with VIT-D treatment were analyzed using molecular and biochemical tools.

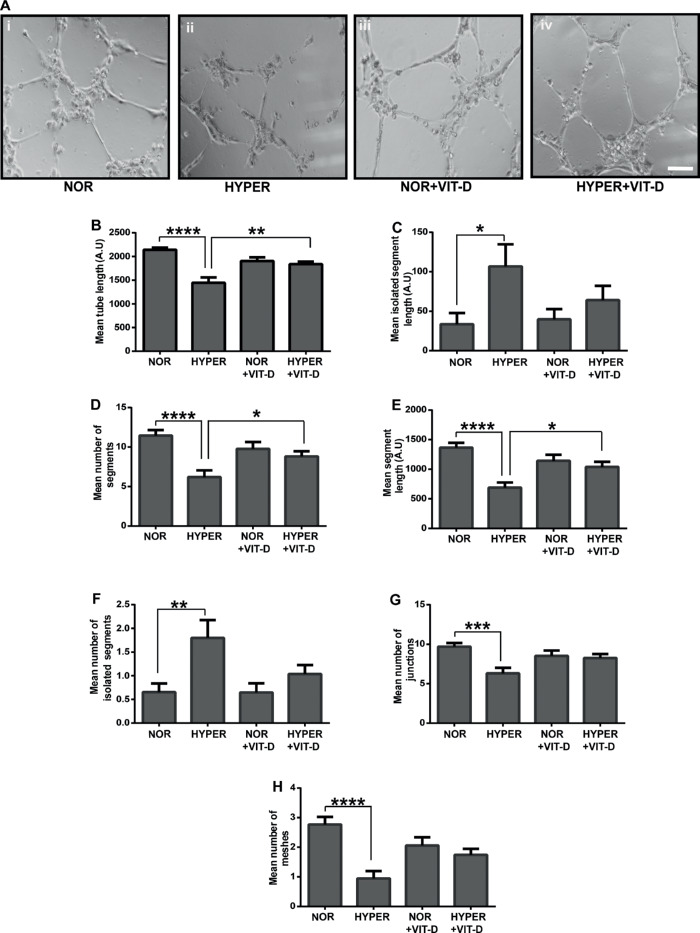
Results: Vascular signaling modulators, such as vascular endothelial growth factor (VEGF) and Notch, were reduced in hyperoxic conditions but significantly upregulated in the presence of VIT-D. Additionally, PRPE conditioned medium with VIT-D induced the tubulogenesis in primary human umbilical vein endothelial cells (HUVEC) cells. VIT-D supplementation restored phagocytosis and transmembrane potential in PRPE cells cultured under hyperoxia.

Conclusions: VIT-D protects RPE cells and promotes angiogenesis under hyperoxic insult. These findings may give impetus to the potential of VIT-D as a therapeutic agent in hyperoxia induced retinal vascular diseases.


Conflict of interest statement

Disclosure: P. Murugeswari, None; A. Firoz, None; S. Murali, None; A. Vinekar, None; L. Krishna, None; V.R. Anandula, None; N. Jeyabalan, None; P. Chevour, None; C. Jayadev, None; R. Shetty, None; G. Carpentier, None; G. Kumaramanickavel, None; A. Ghosh, None; D. Das, None

Figures

Figure 1.
Figure 1.
VEGF proteins are upregulated by VIT-D in hyperoxic conditions. PRPE cells are cultured in hyperoxic condition (40% O2) with and without VIT-D (10 nM) for 5 days. VEGF and VEGF-R2 mRNA expressions analyzed using RT-qPCR with and without VIT-D in comparison to cells incubated under hyperoxia (A). Line graph shows the secreted levels of VEGF measured from 5 days conditioned medium using sandwich-enzyme-linked immunosorbent assay (ELISA) (B). Representative immunofluorescence images for VEGF (green) (C (i−iv)) and VEGF-R2 (green) (D (i-iv)). The nucleus is counterstained with DAPI (blue). Bar graphs showing the corresponding mean fluorescence intensity for VEGF (E) and VEGFR2 (F) in different experimental conditions. *P ≤ 0.05, ***P ≤ 0.001, ****P ≤ 0.0001. Scale bar = 5 µm. NOR = Normoxia, HYPER = Hyperoxia, VIT-D = Vitamin D.
Figure 2.
Figure 2.
Tube formation assay on hyperoxia and VIT-D supplementation. Cell supernatants of PRPE cells cultured for 5 days in hyperoxia +/− VIT-D3 supplement were incubated on HUVEC cells for tube formation. Representative images of tube formation assay (A) in normoxia (i), hyperoxia (ii), normoxia + VIT-D (iii) and hyperoxia + VIT-D (iv). Bar graphs depicting various parameters for mean total tube length (B), mean isolated segment length (C), mean number of segments (D), mean segment length (E), mean number of isolated segments (F), mean number of junctions (G), mean number of meshes (H), measured using Image-J, Angiogenesis Analyzer plugin software. *P ≤ 0.05, **P ≤ 0.01, ***P ≤ 0.001, ****P ≤ 0.0001. Scale bar = 5 µm. NOR = Normoxia, HYPER = Hyperoxia, VIT-D = Vitamin D.
Figure 3.
Figure 3.
Notch signaling modulated in hyperoxia +/− VIT-D supplementation. Gene expression and proteins were analyzed for Notch receptors, ligands, and downstream targets in 5 day cultured PRPE cells in hyperoxia condition +/− VIT-D supplement. mRNA levels of Notch-1 receptor, Dll-4, and Jag-2 ligand (A) and down-stream targets (Hes-1, Hes-5, and Hey-1) (B). Immunofluorescence images depicting NOTCH-1 (red) (C (i-iv)), DLL-4 (green) (D (i-iv)), and JAG-2 (red) (E (i-iv)) staining in normoxic and hyperoxic conditions +/- VIT-D. The nucleus is counterstained with DAPI (blue). Graphical representation showing the mean fluorescence intensity for NOTCH-1 (F), DLL-4 (G), and JAG-2 (H). *P ≤ 0.05, **P ≤ 0.01, ****P ≤ 0.0001. Scale bar = 5 µm. NOR = Normoxia, HYPER = Hyperoxia, VIT-D = Vitamin D.
Figure 4.
Figure 4.
Effects of hyperoxia and VIT-D on proliferation of PRPE cells. PRPE cells were cultured in hyperoxia +/− VIT-D supplementation for 5 days. Graphical representation of the relative gene expressions of Cyclin-D1, Cyclin-B, and Cyclin-E (A) and Cdks (Cdk-2, Cdk-4, and Cdk-6) and Cdc-25 (B). Representative immunofluorescence images for cells cultured under various conditions for Ki-67 (red) and counterstained nucleus with DAPI (blue) (C (i-iv)). Bar graphs representing the percentage of Ki-67 positive population in cells cultured under different experimental conditions (D). *P ≤ 0.05, **P ≤ 0.01, ***P ≤ 0.001, ****P ≤ 0.0001. Scale bar = 5 µm. NOR = Normoxia, HYPER = Hyperoxia, VIT-D = Vitamin D.
Figure 5.
Figure 5.
Effects of hyperoxia and VIT-D on junctional and cytoskeletal proteins. Gene expression analysis for E-cadherin and N-cadherin relative gene expression in cells cultured under hyperoxia cultured (A). Representative immunofluorescence images for ZO-1 (B (i-iv)) and F-ACTIN (C (i-iv)) in cells cultured under different experimental conditions. The nucleus is counterstained with DAPI (blue). Graphical representation of the mean fluorescence intensity for ZO-1 (D) and cell volume using F-ACTIN stained cells (E). *P ≤ 0.05, **P ≤ 0.01, ****P ≤ 0.0001. Scale bar = 5 µm. NOR = Normoxia, HYPER = Hyperoxia, VIT-D = Vitamin D.
Figure 6.
Figure 6.
Transmembrane potential is modulated in the presence of VIT-D. PRPE cells cultured in hyperoxic conditions and supplemented with VIT-D were analyzed for membrane potential using DiBAC4(3) by flow cytometry. Representative histogram showing the fluorescent intensity of depolarized cells in hyperoxia (red peak) compared to normoxia (blue peak) (A). Representative histogram showing the fluorescent intensity for normoxia (blue) and normoxia + VIT-D supplement (green) cells (B). Representative histogram showing the fluorescent intensity for VIT-D supplemented cells under hyperoxia conditions (green) in comparison to hyperoxia alone (red) (C). Graphical representation of the mean fluorescence intensity of the internalized DiBAC4 (3) dye (D). *P ≤ 0.05, **P ≤ 0.01. NOR = Normoxia, HYPER = Hyperoxia, VIT-D = Vitamin D.
Figure 7.
Figure 7.
Modulation of phagocytosis in hyperoxia with and without VIT-D. PRPE cells cultured for 5 days in hyperoxia +/− VIT-D. Representative images showing percentage of internalized FITC labeled POS after exposure (hyperoxia +/− VIT-D) (A (i−iv)). Graphical representation of the number of cells with opsonized POS (B). *P ≤ 0.05, ****P ≤ 0.0001. Scale bar = 5 µm. NOR = Normoxia, HYPER = Hyperoxia, VIT-D = Vitamin D.

References

    1. Reins RY, McDermott AM. Vitamin D: implications for ocular disease and therapeutic potential. Exp Eye Res. 2015; 134: 101–110. - PMC - PubMed
    1. Roberts PA, Gaffney EA, Whiteley JP, et al. .. Predictive mathematical models for the spread and treatment of hyperoxia-induced photoreceptor degeneration in retinitis pigmentosa. Invest Ophthalmol Vis Sci. 2018; 59: 1238–1249. - PubMed
    1. Poljsak B. Strategies for reducing or preventing the generation of oxidative stress. Oxid Med Cell Longev. 2011; 2011: 194586. - PMC - PubMed
    1. Shen CL, Samathanam C, Graham S, et al. .. Green tea polyphenols and 1-alpha-OH-vitamin D(3) attenuate chronic inflammation-induced myocardial fibrosis in female rats. J Med Food. 2012; 15: 269–277. - PubMed
    1. Iseki K, Tatsuta M, Uehara H, et al. .. Inhibition of angiogenesis as a mechanism for inhibition by 1alpha-hydroxyvitamin D3 and 1,25-dihydroxyvitamin D3 of colon carcinogenesis induced by azoxymethane in Wistar rats. Int J Cancer. 1999; 81: 730–733. - PubMed

Publication types

MeSH terms