. 2020 Mar;8(1):106-123.
doi: 10.1002/iid3.289. Epub 2020 Feb 7.

Role of the interferons in CD64 and CD169 expressions in whole blood: Relevance in the balance between viral- or bacterial-oriented immune responses

Affiliations

Role of the interferons in CD64 and CD169 expressions in whole blood: Relevance in the balance between viral- or bacterial-oriented immune responses

Pénélope Bourgoin et al. Immun Inflamm Dis. 2020 Mar.

Abstract

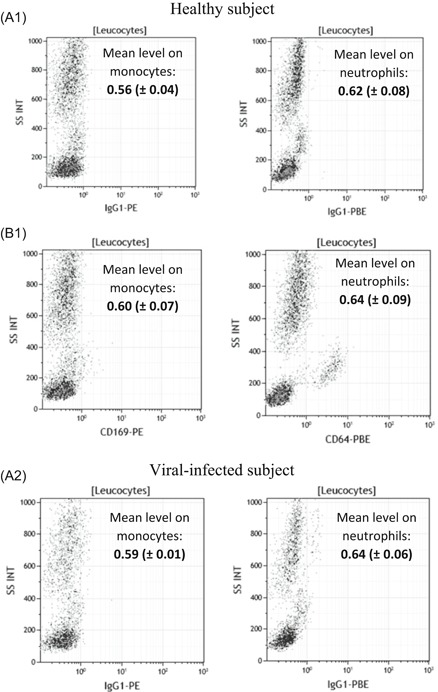
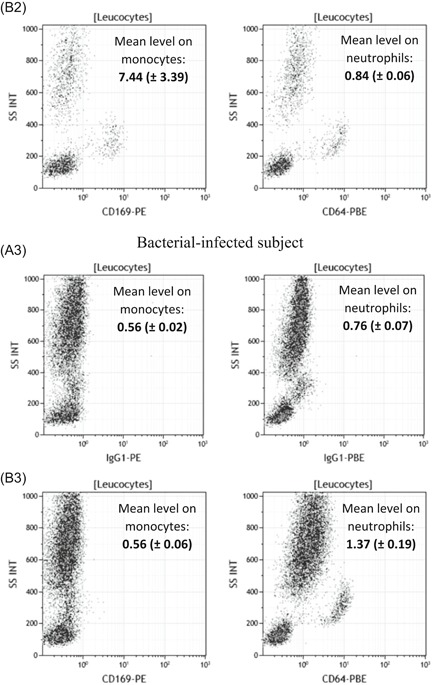
Introduction: CD64 expression increases on neutrophils during bacterial infections. Recently an increase in CD169 expression has been discovered on monocytes during viral infections. Generally, interferons α (IFNsα) and IFNsγ are key drivers of the infectious host immune response. The purpose of this study was to explore if a link exists between these IFNs and both biomarkers.

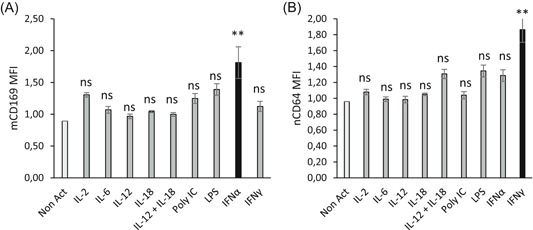
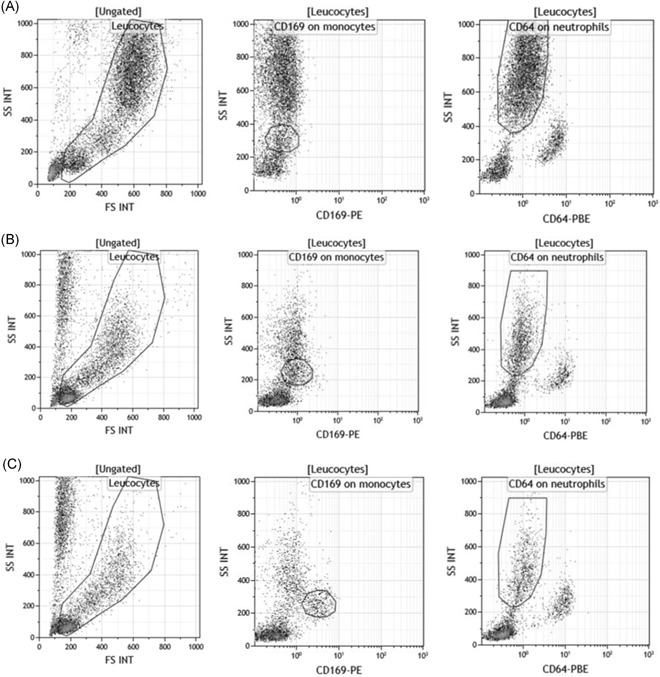
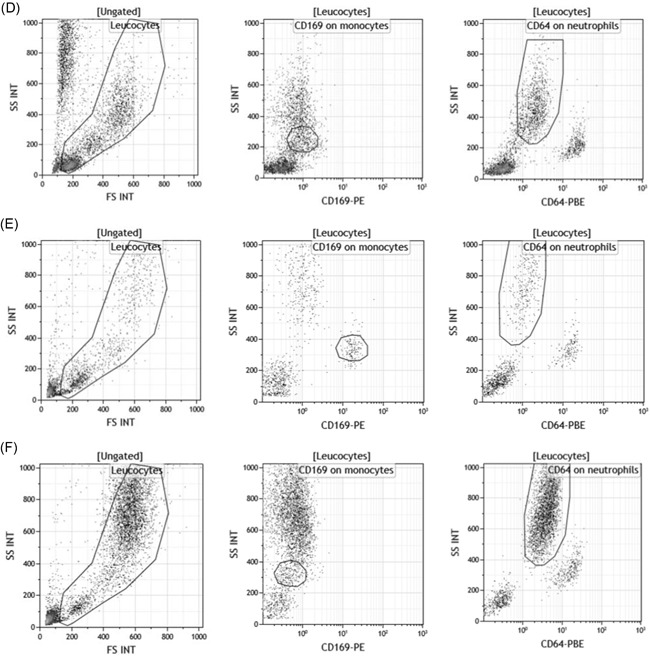
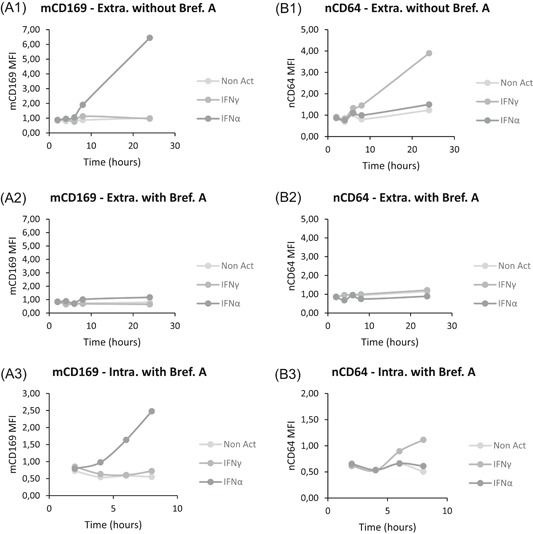
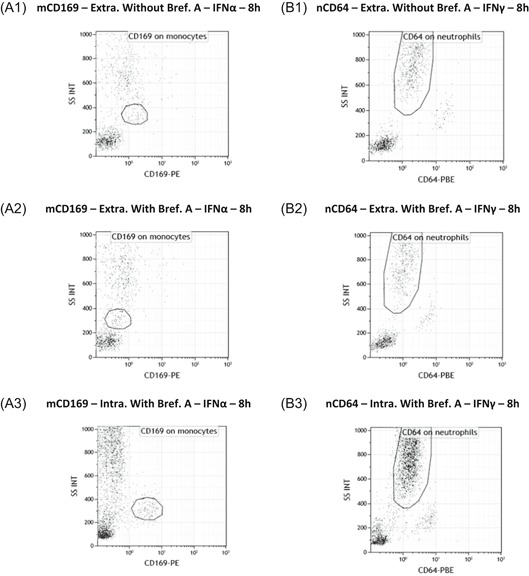
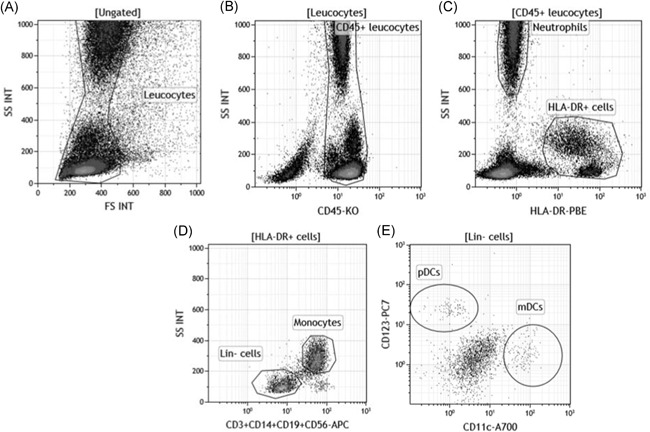
Methods: Whole blood samples from healthy volunteers were stimulated with either IFNs, interleukins, or infectious extracts, to mimic an infectious state. Expressions of CD64 and CD169 were assessed in these samples by multiple flow cytometry methods, over precise kinetics.

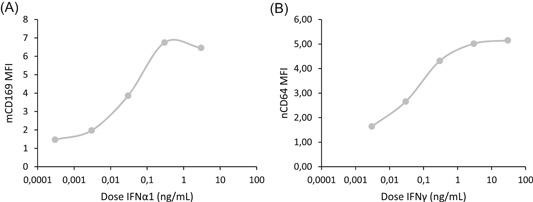
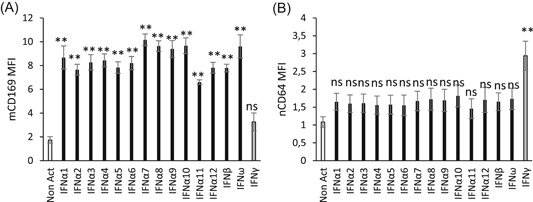
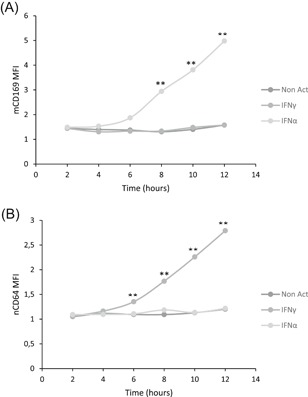
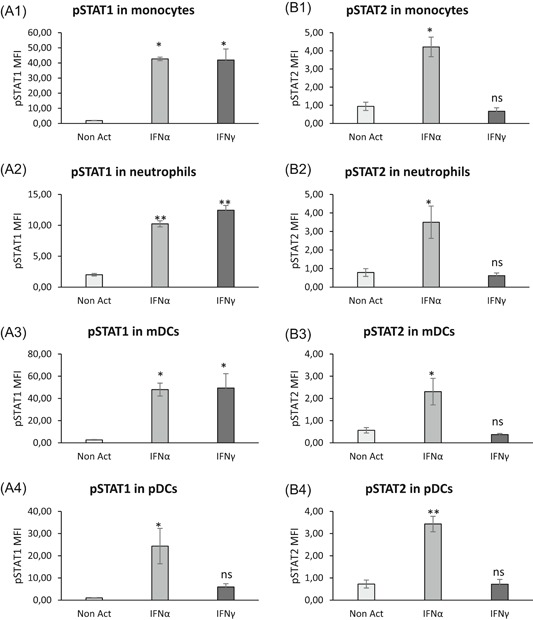
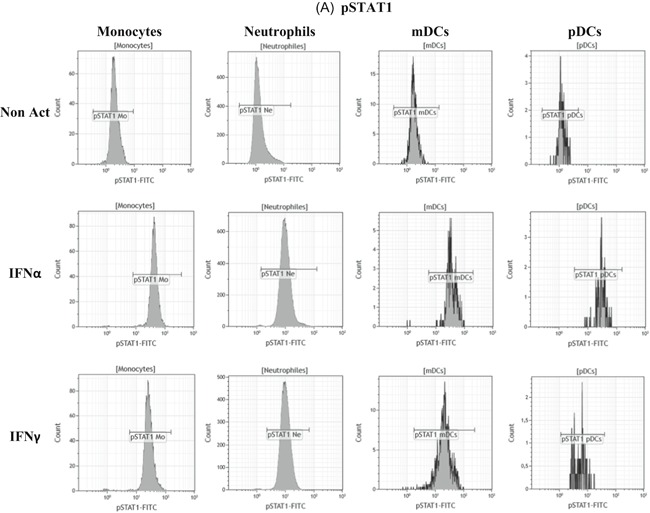
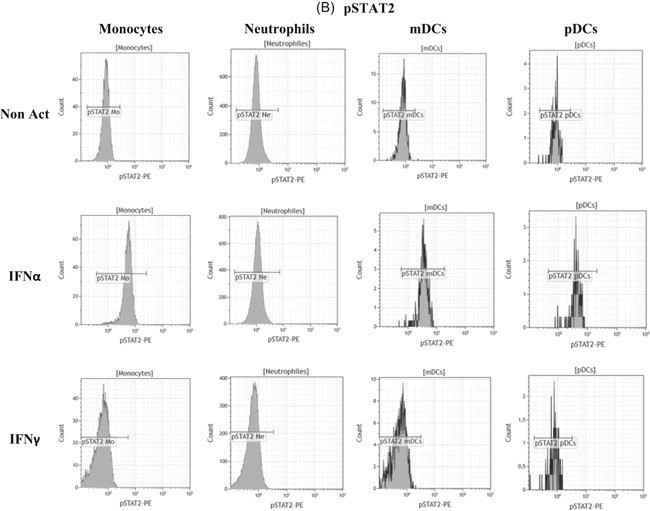
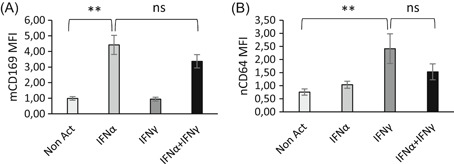
Results: The expression of CD64 was statistically higher in samples stimulated with IFNγ, and CD169 in those stimulated with IFNα (and all other type I IFNs). Surface expressions are directly induced by their respective IFNs via Janus kinase/signal transducer and activator of transduction pathways within 6 to 8 hours of incubation. Mixing both types of IFNs seemed to indicate that they partially inhibit each other.

Conclusions: The induction of CD169 on monocytes and CD164 on neutrophils by type I and type II IFNs confirms the relevance of these markers for assessing between a viral- vs bacterial-oriented immune response.

Keywords: CD169; CD64; flow cytometry; interferons; pathways.


Conflict of interest statement

Pénélope Bourgoin, Géraldine Biéchelé, Inès Ait Belkacem, and Fabrice Malergue are Beckman Coulter employees. Beckman Coulter and the Beckman Coulter product and service marks mentioned herein are trademarks or registered trademarks of Beckman Coulter, Inc, in the United States and other countries. All other trademarks are the property of their respective owners.

Figures

Figure 1
Figure 1
CD169 and CD64 in vivo expressions in whole blood. Either IgG1‐PE and IgG1‐PBE (isotype; A1,A2), or CD169‐PE and CD64‐PBE (staining; B1) expressions were respectively measured on the surface of the monocytes and of the neutrophils in the whole blood of five healthy subjects, five viral‐infected subjects, and five bacterial‐infected subjects. Results are expressed as averages ± standard deviations of their median of fluorescence intensities (MFI). Examples were given for one first healthy volunteer whole blood, one‐second viral‐infected whole blood, and one‐third bacterial‐infected whole blood
Figure 1
Figure 1
CD169 and CD64 in vivo expressions in whole blood. Either IgG1‐PE and IgG1‐PBE (isotype; A1,A2), or CD169‐PE and CD64‐PBE (staining; B1) expressions were respectively measured on the surface of the monocytes and of the neutrophils in the whole blood of five healthy subjects, five viral‐infected subjects, and five bacterial‐infected subjects. Results are expressed as averages ± standard deviations of their median of fluorescence intensities (MFI). Examples were given for one first healthy volunteer whole blood, one‐second viral‐infected whole blood, and one‐third bacterial‐infected whole blood
Figure 2
Figure 2
CD169 and CD64 expressions after blood stimulation. Whole blood of three donors was coincubated for 7 hours at 37°C with either no activator (Non Act), or interleukins (IL‐2, IL‐6, IL‐12, IL‐18, IL‐12 + IL‐18) or infectious extracts (Poly IC, lipopolysaccharide [LPS]) or interferons (IFNα1 and IFNγ). Extracellular staining of the activated blood was performed with the CD64‐CD169/infections antibody mixture. Results are expressed as averages ± standard deviations of the median of fluorescence intensities (MFI) of CD169 on monocytes (mCD169) (A) and of CD64 on neutrophils (nCD64) (B). The comparison was made using a Dunnett's control test, with the Non‐Act condition used as control (in white) and P value was considered either not statistically significant above .05 (in gray; NS) or statistically significant under .05 (in black; *) or under .01 (in black; **). NS, not significant
Figure 3
Figure 3
Dose‐response curves of interferon α1 (IFNα1) and IFNγ. The whole blood of two donors was coincubated for 15 hours at 37°C with five doses (between 0.0003, 0.003, 0.03, 0.3, 3, or 30 ng/mL) of either one type I IFN (IFNα1) or one type II IFN (IFNγ). Extracellular staining of the activated blood was performed with the CD64‐CD169/infections antibody mixture. Results were expressed as averages of the median of fluorescence intensities (MFI) of CD169 on monocytes (mCD169) (Figure 2A) and of CD64 on neutrophils (nCD64) (Figure 2B)
Figure 4
Figure 4
CD169 and CD64 flow cytometry expressions on natural or incubated blood. First, leukocytes were isolated from red blood cells or debris or apoptotic cells based on their typical side (SS INT) and forward scatter (FS INT). Then, CD169 and CD64 were respectively measured on the surface of the monocytes (CD169 on monocytes) and of the neutrophils (CD64 on neutrophils). Examples of their expressions were given for three subjects: A, One first healthy volunteer whole blood. B, The same healthy volunteer whole blood that was not activated by interferons (IFNs), but that staid 15 hours at 37°C. C, The same healthy volunteer whole blood that was activated by IFNα1 for 15 hours at 37°C. D, The same healthy volunteer whole blood that was activated by IFNγ for 15 hours at 37°C. E, One‐second viral‐infected whole blood, and (F) one‐third bacterial‐infected whole blood
Figure 4
Figure 4
CD169 and CD64 flow cytometry expressions on natural or incubated blood. First, leukocytes were isolated from red blood cells or debris or apoptotic cells based on their typical side (SS INT) and forward scatter (FS INT). Then, CD169 and CD64 were respectively measured on the surface of the monocytes (CD169 on monocytes) and of the neutrophils (CD64 on neutrophils). Examples of their expressions were given for three subjects: A, One first healthy volunteer whole blood. B, The same healthy volunteer whole blood that was not activated by interferons (IFNs), but that staid 15 hours at 37°C. C, The same healthy volunteer whole blood that was activated by IFNα1 for 15 hours at 37°C. D, The same healthy volunteer whole blood that was activated by IFNγ for 15 hours at 37°C. E, One‐second viral‐infected whole blood, and (F) one‐third bacterial‐infected whole blood
Figure 5
Figure 5
CD169 and CD64 expression after interferon (IFN) stimulation. Whole blood of four donors was coincubated for 15 hours at 37°C with either no IFN (Non Act), or type I IFNs (IFNα1, IFNα2, IFNα3, IFNα4, IFNα5, IFNα6, IFNα7, IFNα8, IFNα9, IFNα10, IFNα11, IFNα12, IFNβ, and IFNω) or type II IFN (IFNγ). Extracellular staining of the activated blood was performed with the CD64‐CD169/infections antibody mixture. Results are expressed as averages ± standard deviations of the median of fluorescence intensities (MFI) of CD169 on monocytes (mCD169) (Figure 4A) and of CD64 on neutrophils (nCD64) (Figure 4B). Comparison was made using a Dunnett's control test, with the Non Act condition used as control (in white), and P value was considered either not statistically significant above .05 (in gray; NS) or statistically significant under .05 (in black; *) or under .01 (in black; **). NS, not significant
Figure 6
Figure 6
CD169 and CD64 kinetics after interferon (IFN) stimulation. Whole blood of four donors was coincubated for 2 to 12 hours at 37°C with either no IFN (Non Act; in the dark gray), or one type II IFN (IFNγ; in medium gray) or one type I IFN (IFNα1; in light gray). Extracellular staining of the activated blood was performed with the CD64‐CD169/infections antibody mixture. Results were expressed as averages of the median of fluorescence intensities (MFI) of CD169 on monocytes (mCD169) (Figure 5A) and of CD64 on neutrophils (nCD64) (Figure 5B). The comparison was made using an analysis of variance test, for which P value was considered statistically significant under .05. When P value was under .05, a comparison was made using a paired Tukey test, for which P value was also considered statistically significant under .05 (*) or under .01 (**)
Figure 7
Figure 7
Direct or indirect CD169 and CD64 kinetics after interferon (IFN) stimulation. Whole blood of eight donors was coincubated for 2 to 24 hours at 37°C with either no IFN (Non Act; in light gray), or one type II IFN (IFNγ; in medium gray) or one type I IFN (IFNα1; in the dark gray). On the one hand, biomarker extracellular expressions (Extra.) were assessed in activated whole blood without Brefeldin A (Bref. A), a Golgi apparatus blocker, (A1 and B1) or with Brefeldin A (A2 and B2). On the other hand, intracellular expressions (Intra.) were evaluated with Brefeldin A only (A3 and B3). All stainings were performed with the CD64‐CD169/infections antibody mixture. Results were expressed as averages of the median of fluorescence intensities (MFI) of CD169 on monocytes (mCD169) (Figure 6A) and of CD64 on neutrophils (nCD64) (Figure 6B). The comparison was made using an analysis of variance test, for which P value is considered statistically significant under .05
Figure 8
Figure 8
Flow cytometry extracellular or intracellular expressions of CD169 and CD64. Flow cytometry example of whole blood of one donor that was coincubated for 8 hours at 37°C with either one type I interferon (IFNα1) (Figure 7A) or one type II IFN (IFNγ) (Figure 7B). CD169 and CD64 were respectively presented on monocytes (mCD169) (Figure 7A) and neutrophils (nCD64) (Figure 7B). On the one hand, biomarker extracellular expressions (Extra.) were showed in activated whole blood without Brefeldin A (Bref. A) (A1 and B1) or with Brefeldin A (A2 and B2). On the other hand, intracellular expressions (Intra.) were showed with Brefeldin A only (A3 and B3)
Figure 9
Figure 9
Monocytes, neutrophils, myeloid dendritic cells (mDCs) and plasmacytoid (pDCs) isolation by flow cytometry. A, First, leukocytes were isolated from red blood cells or debris or apoptotic cells based on their typical side (SS INT) and forward scatter (FS INT). B, Leukocytes CD45+ were gated out of them on their positive CD45 expression. C, Using the HLA‐DR expression on this population, negative neutrophils were separated from positive HLA‐DR cells, including B lymphocytes, monocytes, and DCs. D, Gated out from this last population, the lineage composed of CD3, CD14, CD19, and CD56 made the distinction between the positive monocytes and the lineage negative (lin‐) cells, including DCs. E, DCs were finally divided in both cellular subtypes: CD11c+CD123− mDCs or CD11c−CD123+ plasmacytoid DCs (pDCs)
Figure 10
Figure 10
Cellular actors and activation pathways after interferon (IFN) stimulation. Whole blood of three donors was coincubated for 15 minutes at 37°C with either no IFN (Non Act; in white), or one type I IFN (IFNα1; in light gray) or one type II IFN (IFNγ; in the dark gray). Phosphoepitope staining of the activated blood was performed with the dendritic cells (DCs) antibody mixture. Results were expressed as averages of median of fluorescence intensities (MFI) of phosphorylated STAT1 (pSTAT1) (A1‐A4) and of pSTAT2 (B1‐B4) on monocytes (Figure 9A1,B1), neutrophils (Figure 9A2,B2), myeloid DCs (mDCs) (Figure 9A3,B3) and plasmacytoid DCs (pDCs) (Figure 9A4,B4). The comparison was made using a paired Tukey test, for which P value was considered either not statistically significant above .05 (NS) or statistically significant under .05 (*) or under .01 (**). NS, not significant
Figure 11
Figure 11
Flow cytometry expressions of phospho‐epitopes. The whole blood of one donor was coincubated for 15 minutes at 37°C with either no interferon (IFN) (Non Act), or one type I IFN (IFNα1) or one type II IFN (IFNγ). Phosphoepitope staining of the activated blood was performed with the dendritic cells (DCs) antibody mixture. Results were presented as histograms of phosphorylated STAT1 (pSTAT1) (Figure 10A) and of pSTAT2 (Figure 10B) on monocytes (Mo), neutrophils (Ne), myeloid DCs (mDCs), and plasmacytoid DCs (pDCs)
Figure 11
Figure 11
Flow cytometry expressions of phospho‐epitopes. The whole blood of one donor was coincubated for 15 minutes at 37°C with either no interferon (IFN) (Non Act), or one type I IFN (IFNα1) or one type II IFN (IFNγ). Phosphoepitope staining of the activated blood was performed with the dendritic cells (DCs) antibody mixture. Results were presented as histograms of phosphorylated STAT1 (pSTAT1) (Figure 10A) and of pSTAT2 (Figure 10B) on monocytes (Mo), neutrophils (Ne), myeloid DCs (mDCs), and plasmacytoid DCs (pDCs)
Figure 12
Figure 12
Combined effects of interferons (IFNs) on CD169 and CD64 expressions. Whole blood of six donors was coincubated for 18 hours at 37°C with either no IFN (Non Act; in white), or one type I IFN (IFNα1; in light gray) or one type II IFN (IFNγ; in the dark gray) or a combination of both IFNs (IFNα1 + IFNγ; in black). Extracellular staining of the activated blood was performed with the CD64‐CD169/infections antibody mixture. Results were expressed as averages ± standard deviations of the median of fluorescence intensities (MFI) of CD169 on monocytes (mCD169) (Figure 11A) and of CD64 on neutrophils (nCD64) (Figure 11B). The comparison was made using a paired Tukey test, for which P value was considered either not statistically significant above .05 (NS) or statistically significant under .05 (*) or under .01 (**). NS, not significant

References

    1. Murphy K, Weaver C. Janeway's Immunobiology. 9th ed. New York NY: Garland Science/Taylor & Francis Group, LLC; 2017.
    1. Thompson MR, Kaminski JJ, Kurt‐Jones EA, Fitzgerald KA. Pattern recognition receptors and the innate immune response to viral infection. Viruses. 2011;3(6):920‐940. - PMC - PubMed
    1. Luis Muñoz‐Carrillo J, Francisco Contreras‐Cordero J, Gutiérrez‐Coronado O, Trinidad Villalobos‐Gutiérrez P, Guillermo Ramos‐Gracia L, Elizabeth Hernández‐Reyes V. Cytokine profiling plays a crucial role in activating immune system to clear infectious pathogens In: Tyagi R K, Bisen P S, eds. Immune Response Activation and Immunomodulation. Mexico: IntechOpen; 2019:1‐30.
    1. Engelmann I, Dubos F, Lobert P‐E, et al. Diagnosis of viral infections using myxovirus resistance protein A (MxA). Pediatrics. 2015;135(4):e985‐e993. - PubMed
    1. Kipfmueller F, Schneider J, Prusseit J, et al. Role of neutrophil CD64 index as a screening marker for late‐onset sepsis in very low birth weight infants. PLOS One. 2015;10(4):1‐15. - PMC - PubMed

Publication types