

Antioxidant Activity of Compounds Isolated from Elaeagnus umbellata Promotes Human Gingival Fibroblast Well-Being
- PMID: 32031808
- PMCID: PMC7997630
- DOI: 10.1021/acs.jnatprod.9b01030
Antioxidant Activity of Compounds Isolated from Elaeagnus umbellata Promotes Human Gingival Fibroblast Well-Being
Abstract
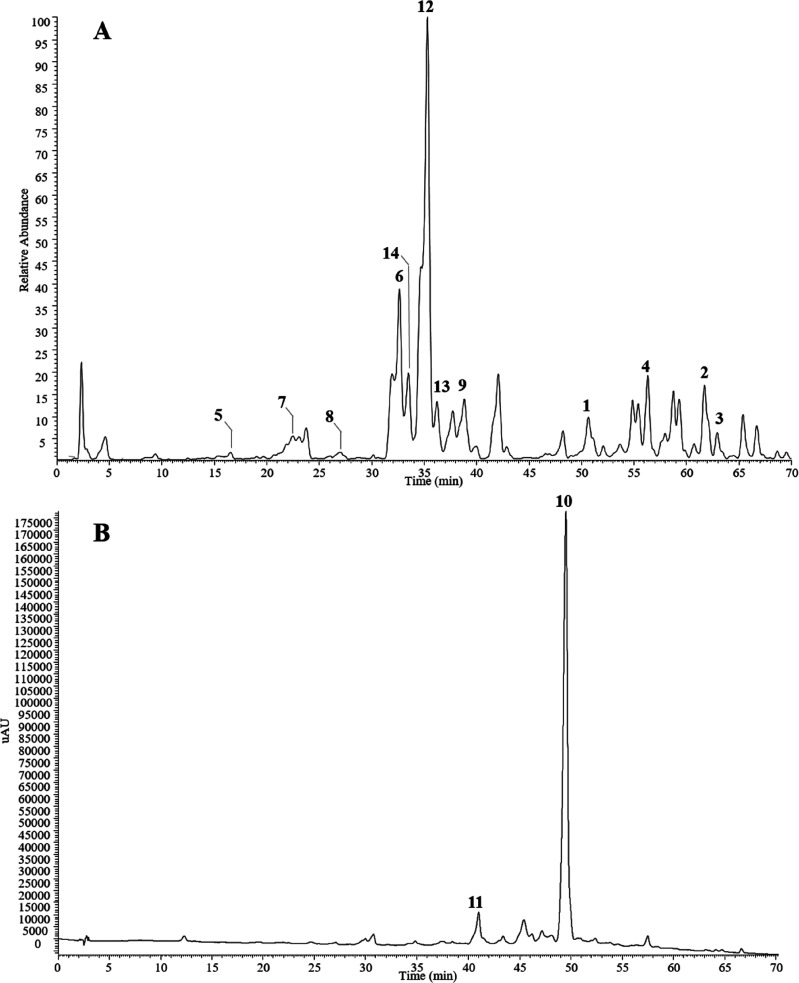
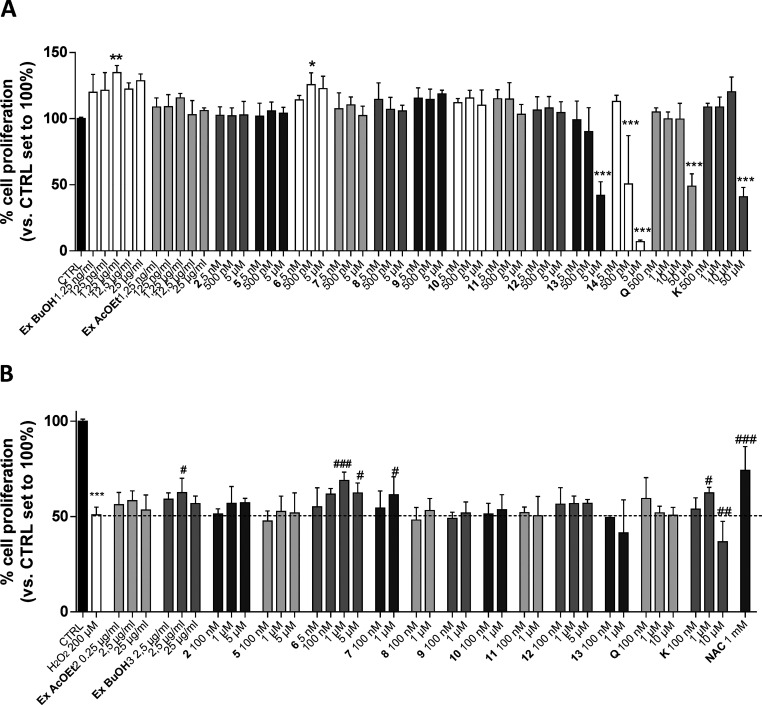
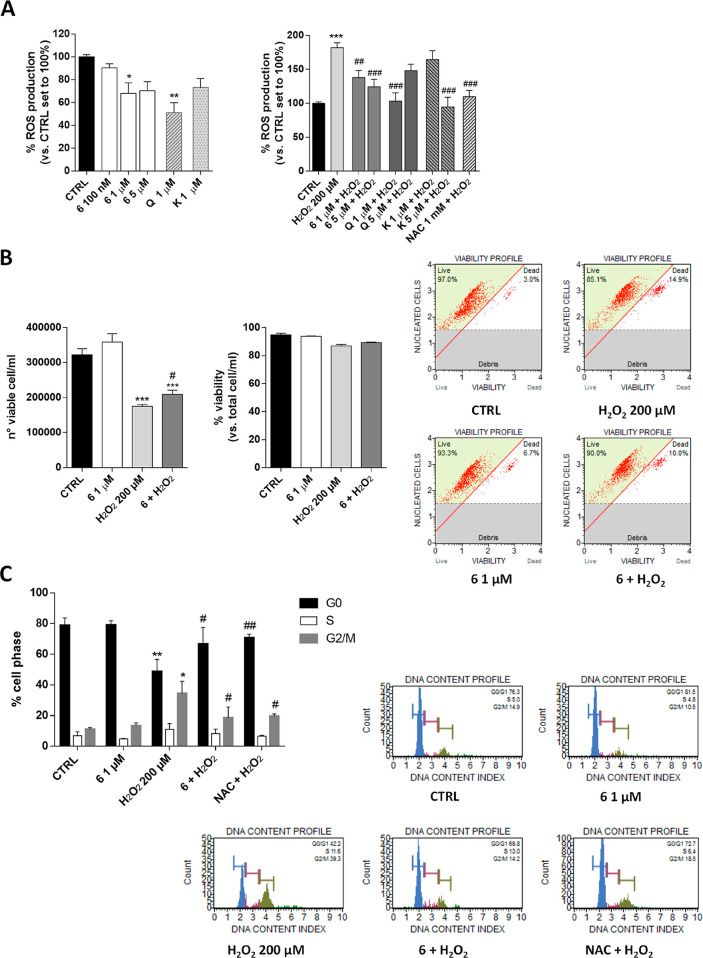
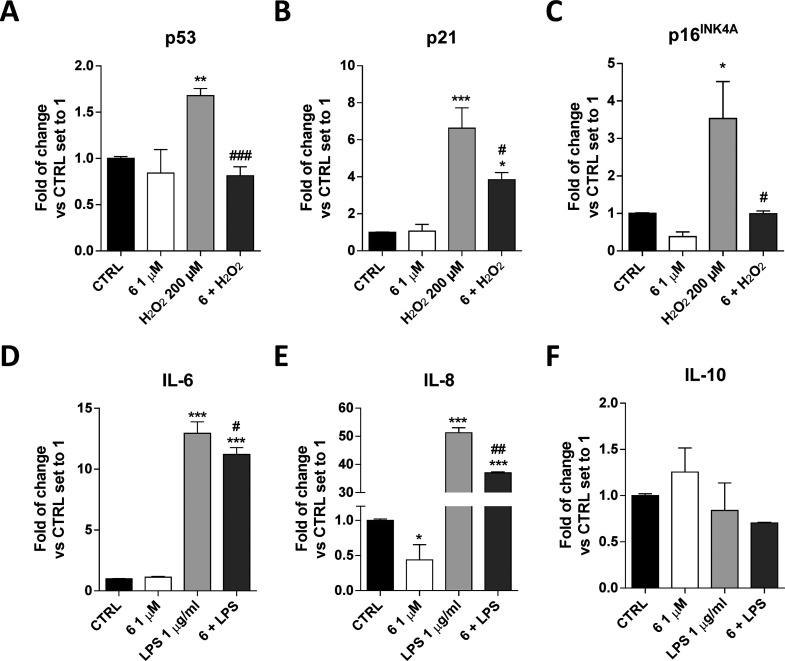
Four new triterpenoid bidesmosidic saponins (1-4) and a sesquiterpenoid glucoside (5), together with nine known phenolic compounds (6-14), were isolated from the fruits of Elaeagnus umbellata. Their structures were elucidated using 1D and 2D NMR spectroscopy and mass spectrometry data. The antioxidant capability of the isolated compounds was evaluated in human gingival fibroblasts. Compound 6 decreased ROS production and promoted cell proliferation. It also counteracted the cell cycle blockade induced by a low concentration of H2O2 decreasing the expression of p21 and CDKN2A (p16INK4A). Compound 6 decreased the expression of inflammatory cytokines (IL-6 and IL-8) in response to inflammatory stimuli, supporting its possible use in periodontitis lesions.
Conflict of interest statement
The authors declare no competing financial interest.
Figures
Similar articles
-
Eight new triterpenoid saponins with antioxidant activity from the roots of Glycyrrhiza uralensis Fisch.Fitoterapia. 2019 Mar;133:186-192. doi: 10.1016/j.fitote.2019.01.014. Epub 2019 Jan 25. Fitoterapia. 2019. PMID: 30690123
-
Phytochemical Constituents, ChEs and Urease Inhibitions, Antiproliferative and Antioxidant Properties of Elaeagnus umbellata Thunb.Comb Chem High Throughput Screen. 2017;20(6):559-578. doi: 10.2174/1386207320666170127161837. Comb Chem High Throughput Screen. 2017. PMID: 28137214
-
Cornus sanguinea Fruits: a Source of Antioxidant and Antisenescence Compounds Acting on Aged Human Dermal and Gingival Fibroblasts.Planta Med. 2021 Aug;87(10-11):879-891. doi: 10.1055/a-1471-6666. Epub 2021 Apr 15. Planta Med. 2021. PMID: 33860477
-
Termiglaucescin, a new polyhydroxy triterpene glucoside from Terminalia glaucescens with antioxidant and anti-inflammatory potential.Z Naturforsch C J Biosci. 2017 May 1;72(5-6):203-208. doi: 10.1515/znc-2016-0178. Z Naturforsch C J Biosci. 2017. PMID: 27997356
-
Constituents of the leaves and twigs of Elaeagnus umbellata and their proliferative effects on human keratinocyte HaCaT cells.Fitoterapia. 2019 Nov;139:104374. doi: 10.1016/j.fitote.2019.104374. Epub 2019 Oct 17. Fitoterapia. 2019. PMID: 31629867
Cited by
-
Inhibitory Effect of Elaeagnus umbellata Fractions on Melanogenesis in α-MSH-Stimulated B16-F10 Melanoma Cells.Molecules. 2021 Mar 1;26(5):1308. doi: 10.3390/molecules26051308. Molecules. 2021. PMID: 33804361 Free PMC article.
-
A literature review of bioactive substances for the treatment of periodontitis: In vitro, in vivo and clinical studies.Heliyon. 2024 Jan 11;10(2):e24216. doi: 10.1016/j.heliyon.2024.e24216. eCollection 2024 Jan 30. Heliyon. 2024. PMID: 38293511 Free PMC article. Review.
-
Elaeagnus umbellata Fruit Extract Protects Skin from Ultraviolet-Mediated Photoaging in Hairless Mice.Antioxidants (Basel). 2024 Feb 3;13(2):195. doi: 10.3390/antiox13020195. Antioxidants (Basel). 2024. PMID: 38397793 Free PMC article.
-
Antioxidant Phenylpropanoid Glycosides from Ginkgo biloba Fruit and Identification of a New Phenylpropanoid Glycoside, Ginkgopanoside.Plants (Basel). 2021 Dec 8;10(12):2702. doi: 10.3390/plants10122702. Plants (Basel). 2021. PMID: 34961174 Free PMC article.
-
Elaeagnus umbellata: A miraculous shrub with potent health-promoting benefits from Northwest Himalaya.Saudi J Biol Sci. 2023 Jun;30(6):103662. doi: 10.1016/j.sjbs.2023.103662. Epub 2023 May 2. Saudi J Biol Sci. 2023. PMID: 37213692 Free PMC article. Review.
References
Publication types
MeSH terms
Substances
LinkOut - more resources
Full Text Sources
Medical
Miscellaneous
