. 2020 Feb 7;16(2):e1008269.
doi: 10.1371/journal.ppat.1008269. eCollection 2020 Feb.

RNA decay during gammaherpesvirus infection reduces RNA polymerase II occupancy of host promoters but spares viral promoters

Affiliations

RNA decay during gammaherpesvirus infection reduces RNA polymerase II occupancy of host promoters but spares viral promoters

Ella Hartenian et al. PLoS Pathog. .

Abstract

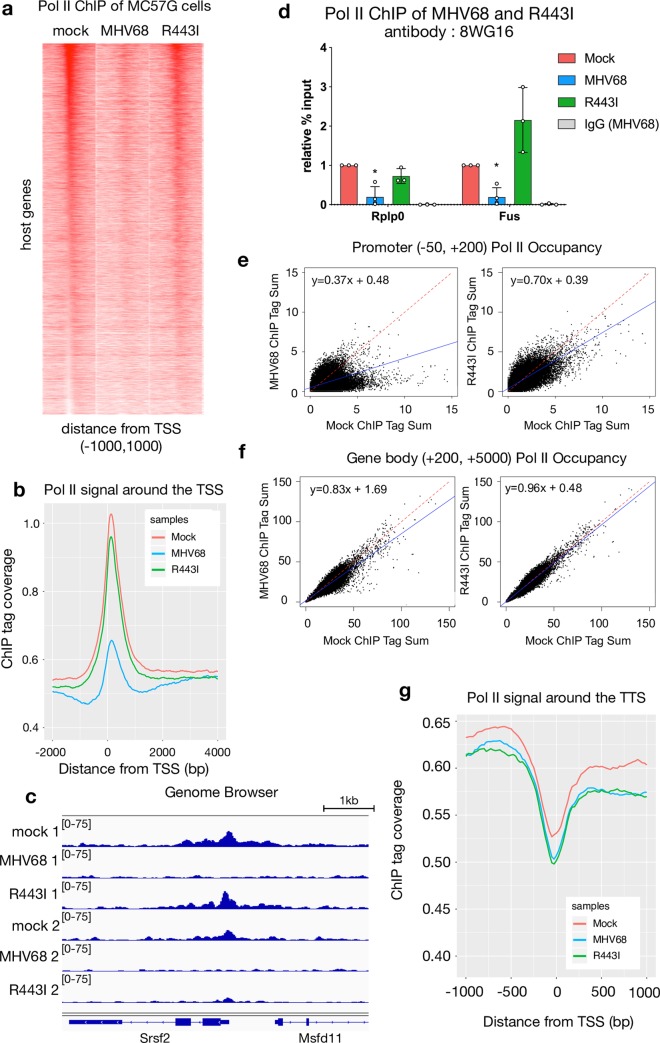
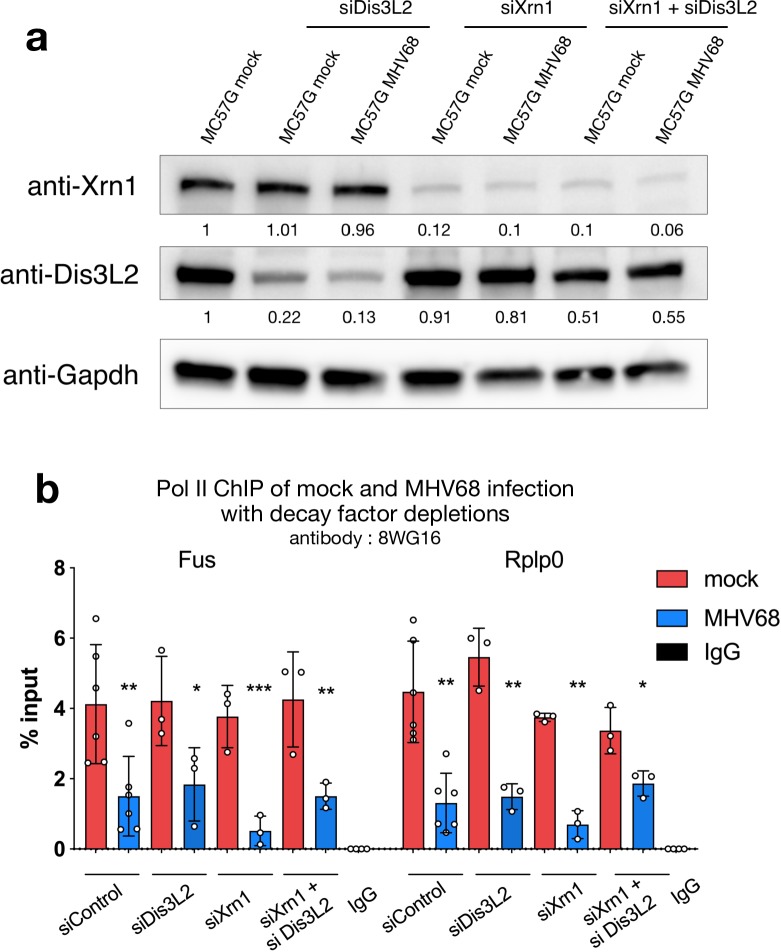
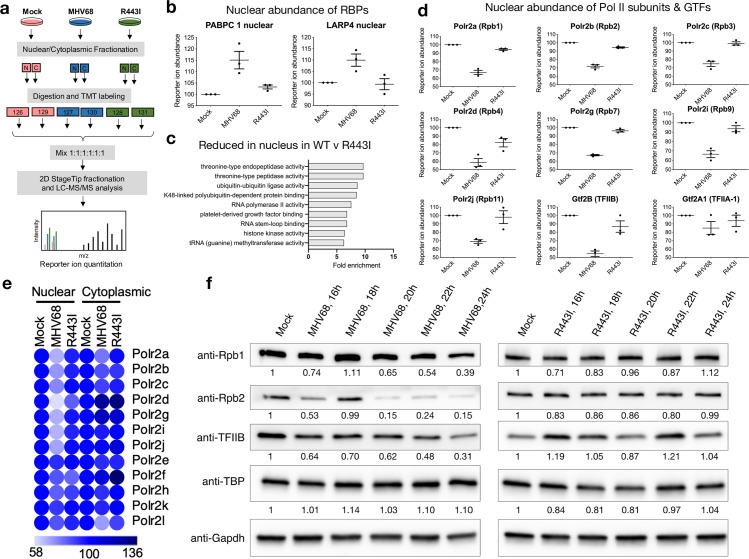
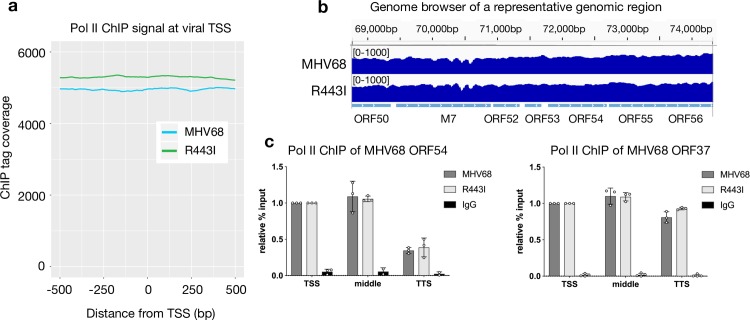
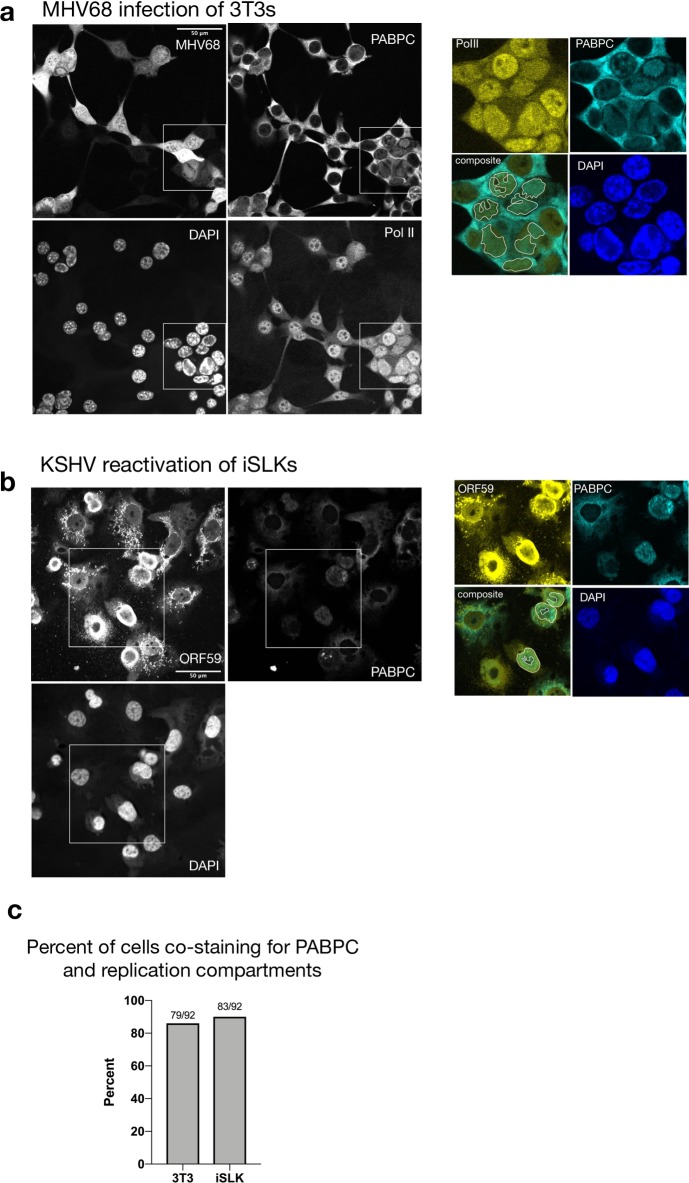
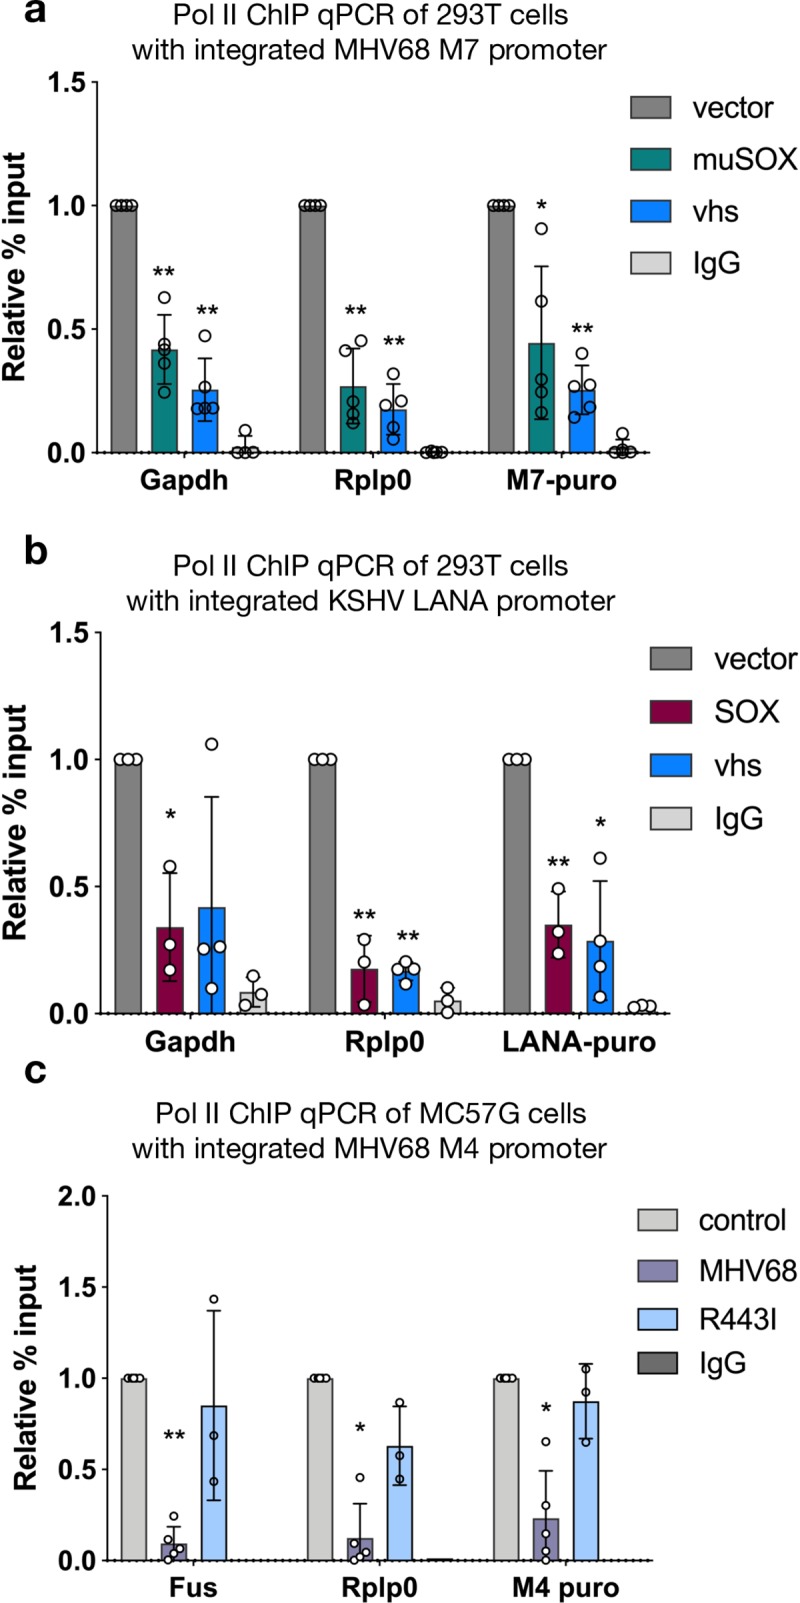
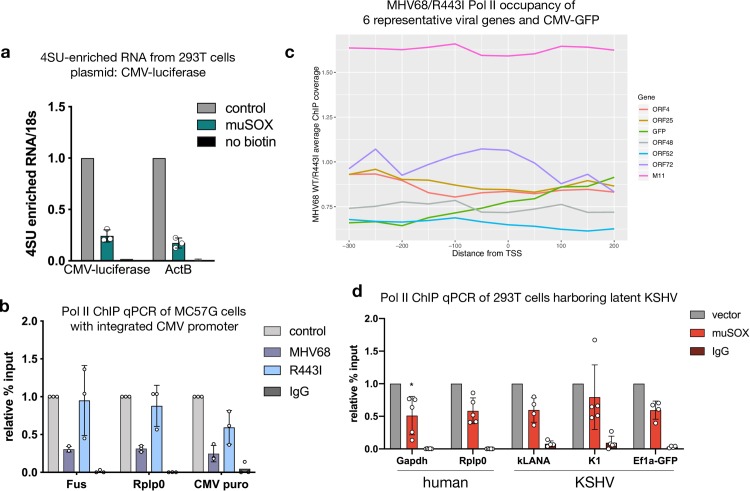
In mammalian cells, widespread acceleration of cytoplasmic mRNA degradation is linked to impaired RNA polymerase II (Pol II) transcription. This mRNA decay-induced transcriptional repression occurs during infection with gammaherpesviruses including Kaposi's sarcoma-associated herpesvirus (KSHV) and murine gammaherpesvirus 68 (MHV68), which encode an mRNA endonuclease that initiates widespread RNA decay. Here, we show that MHV68-induced mRNA decay leads to a genome-wide reduction of Pol II occupancy at mammalian promoters. This reduced Pol II occupancy is accompanied by down-regulation of multiple Pol II subunits and TFIIB in the nucleus of infected cells, as revealed by mass spectrometry-based global measurements of protein abundance. Viral genes, despite the fact that they require Pol II for transcription, escape transcriptional repression. Protection is not governed by viral promoter sequences; instead, location on the viral genome is both necessary and sufficient to escape the transcriptional repression effects of mRNA decay. We propose a model in which the ability to escape from transcriptional repression is linked to the localization of viral DNA within replication compartments, providing a means for these viruses to counteract decay-induced transcript loss.


Conflict of interest statement

The authors have declared that no competing interests exist.

Figures

Fig 1
Fig 1. Promoter-proximal Pol II recruitment to mammalian genes is RNA-decay dependent.
(A) Pol II ChIP-seq signal profiles of host genes in mock-infected, MHV68 WT-infected and R443I-infected MC57G cells. Each row of the heat map displays Pol II occupancy of one gene from -1000 to +1000 in 25 bp bins. Genes are ranked by the Pol II-transcription start site (TSS) proximal signal in mock infected cells. (B) Sequence tags were plotted as a histogram with 25 bp bins for -2000 to +4000 around the TSS. Mock (red), MHV68 (blue) and MHV68 R443I (green) traces are shown. (C) Pol II ChIP-seq coverage across the Srsf2 gene for ChIP-seq replicate 1 and 2 with mock, WT MHV68 and R443I shown. Alignment files were converted to the tiled data file (tdf) format and visualized in the Integrative Genome Viewer. (D) ChIP-qPCR validation of Pol II occupancy at the Rplp0 and Fus promoters plotted with standard deviation. Pol II ChIP was performed on mock, MHV68 WT or MHV68 R443I infected MC57G cells and Pol II levels were assayed near the TSS of two repressed host genes during MHV68 infection from the ChIP-seq data. IgG is from the MHV68 infection condition. (* p < 0.05, students paired t-test on raw % input values) (E) Scatterplot of Pol II occupancy of promoters, averaging the sum of ChIP-seq tags from -50 to +200 across two replicate experiments with inputs subtracted out. Mock is compared to WT MHV68 infection on the left and to MHV68 R443I infection on the right. Linear regression lines are plotted in blue and equations are provided. A y = x line is plotted for reference in red. (F) Scatterplot of Pol II occupancy of gene bodies, averaging the sum of ChIP-seq tags from -50 to +200 across two replicate experiments with inputs subtracted out. Data as described for (E). (G) Pol II transcription termination is not dependent on RNA decay. Sequence tags were plotted as a histogram in 25 bp bins for transcription termination sequence (TTS) proximal Pol II for -1000 to +1000 around the TTS with the same color scheme as (B).
Fig 2
Fig 2. Knockdown of host RNA decay factors does not rescue Pol II occupancy.
(A) Representative western blot showing the efficiency of Dis3L2 and Xrn1 knockdown (kd) in MC57G cells, with Gapdh serving as a loading control. Densitometry of band intensity normalized to Gapdh and MC57G mock infection are indicated below blots. (B) ChIP-qPCR of Pol II occupancy at the Rplp0 and Fus promoters with standard deviation. Pol II ChIP was performed on mock and MHV68 WT infected MC57G cells treated with the indicated siRNAs. IgG is from the siControl MHV68 infection condition. (* p < 0.05, ** p < 0.001, *** p < 0.0001 students paired t-test on raw % input values).
Fig 3
Fig 3. Pol II subunits are depleted in the nucleus of MHV68 infected cells in an RNA decay dependent manner.
(A) Diagram showing the experimental setup for the TMT-MS. (B) Graphs showing the nuclear distribution of poly(A) binding proteins from the TMT-MS data. Graphs display the mean with SEM of 3 biological replicates. (C) Molecular functions classification by Pantherdb of nuclear proteins differentially expressed by 1.15 fold or more in R443I compared to WT MHV68 infection of 3T3 cells in the TMT-MS data. Categories with fold enrichment greater than 5 are shown. (D) Graphs showing the relative nuclear abundance of 7 Pol II subunits and 2 general transcription factors from the TMT-MS data that are reduced in MHV68 infection compared to R443I. Graphs display the mean with SEM of 3 biological replicates. (E) A heatmap displaying normalized reporter ion abundance of all 12 Pol II subunits in the nucleus and cytoplasm, where light blue represents lower abundance and dark blue represents higher abundance. (F) Representative western blot showing the levels of Rpb1, Rpb2, TFIIB and TBP upon mock infection versus infection with WT MHV68 or R443I MHV68 in MC57G cells at the indicated times post infection in whole cell lysate. Gapdh serves as a loading control. Densitometry of band intensity was normalized first to Gapdh and then mock infection are indicated below blots.
Fig 4
Fig 4. Viral genes are not susceptible to RNA decay-dependent Pol II repression.
(A) Sequence tags were plotted as a histogram in 25 bp bins for -500 to +500 around the TSS. MHV68 WT (blue) and R443I (green) traces are shown from infected MC57G cells. (B) Pol II ChIP-seq coverage across 5.5 kb of the MHV68 genome for MHV68 WT and R443I. Alignment files were converted to tdf format and visualized in the IGV. (C) Pol II ChIP qPCR signal is similar across gene bodies. Three regions of the ORF54 and ORF37 gene were assayed by Pol II ChIP-qPCR during MHV68 WT or R443I infection to assess the relative levels of Pol II across the gene.
Fig 5
Fig 5. PABPC is not excluded from replication compartments.
(A) MHV68 infected 3T3 cells were subjected to imunofluoresence (IF) analysis at 27 hpi using antibodies against PABPC and Pol II, and stained with DAPI. The MHV68 genome contains GFP, which served as a marker of infection. Cells with RCs are outlined in white. RCs were identified in cell nuclei as regions that contained Pol II but stained poorly for DAPI. The inset shows a merge of Pol II and PABPC staining for several cells that co-stain for both proteins in RCs. (B) IF was performed on KSHV-positive iSLK cells reactivated for 48 h and stained with antibodies against PABPC, ORF59 and DAPI. Cells with RCs are outlined in white and were identified as nuclei with ORF59 staining that overlaps with regions that stain poorly with DAPI. The inset shows a merge of ORF59 and PABPC for several cells that co-stain for both proteins in RCs. (C) Percent of RC containing cells that overlap with PABPC signal. Fractions of cells with PABPC signal in RCs over total number of cells counted with RCs are displayed.
Fig 6
Fig 6. Viral promoter sequences are insufficient to escape transcriptional regulation.
(A) The MHV68 M7 viral promoter driving puromycin resistance was lentivirally integrated into 293T cells. 24 h post transfection of muSOX or vhs, Pol II-ChIP qPCR was used to measure Pol II levels at two host promoters (Gapdh, Rplp0) and the integrated M7 promoter. (* p < 0.05, ** p < 0.001, students paired t-test on raw % input values plotted with standard deviation) (B) The KSHV LANA promoter driving puromycin resistance was integrated into 293T cells by random incorporation. Pol II-ChIP qPCR was used to measure Pol II levels 24 h post SOX or vhs transfection as described in (A) and significance as assigned in (A). (C) The MHV68 M4 viral promoter driving puromycin resistance was lentivirally integrated into MC57G cells. The cells were then infected with WT MHV68 or R443I at a MOI of 5 and Pol II levels at the indicated promoters were assayed by Pol II ChIP-qPCR. Significance as assigned in (A).
Fig 7
Fig 7. A non-MHV68 promoter escapes repression on the viral genome.
(A) 293T cells were transfected with muSOX or a GFP control fused to the cell surface glycoprotein Thy1.1 with an intervening P2A ribosome skipping sequence. Pure populations of transfected cells were obtained by running cells over columns that enrich for Thy1.1 [23], whereupon 500 μM of 4SU was added for 10 min and labeled RNA was isolated by biotin-streptavidin pull down. Levels of newly transcribed RNA from the indicated genes were measured by RT-qPCR. All samples were normalized to 18S and levels of RNA from control GFP expressing cells were set to 1. (B) The CMV promoter driving puromycin resistance was lentivirally integrated into MC57G cells. The cells were then infected with WT MHV68 or R443I at an MOI of 5 and Pol II levels at the indicated promoters were assayed by Pol II ChIP-qPCR. (C) ChIP-seq traces comparing WT MHV68 to R443I coverage from -300 to +200 around the TSS in 25 bp bins, averaged from two biological replicates of infected MC57G cells. Six representative viral genes and CMV-GFP are shown. (D) 293T cells were infected with KSHV and then transfected with muSOX twice over a 24 h period to induce accelerated RNA turnover. Pol II levels at the indicated KSHV and human promoters were measured by ChIP-qPCR and plotted with standard deviation. (* p < 0.05, students t-test on raw % input values).

References

    1. Hartenian E, Glaunsinger BA. Feedback to the central dogma: cytoplasmic mRNA decay and transcription are interdependent processes. Critical Reviews in Biochemistry and Molecular Biology. 2019. October 16;0(0):1–14. - PMC - PubMed
    1. Sun M, Schwalb B, Schulz D, Pirkl N, Etzold S, Lariviere L, et al. Comparative dynamic transcriptome analysis (cDTA) reveals mutual feedback between mRNA synthesis and degradation. Genome Research. 2012. July 2;22(7):1350–9. 10.1101/gr.130161.111 - DOI - PMC - PubMed
    1. Haimovich G, Medina DA, Causse SZ, Garber M, Millán-Zambrano G, Barkai O, et al. Gene Expression Is Circular: Factors for mRNA Degradation Also Foster mRNA Synthesis. Cell. 2013. May 23;153(5):1000–11. 10.1016/j.cell.2013.05.012 - DOI - PubMed
    1. Shalem O, Dahan O, Levo M, Martinez MR, Furman I, Segal E, et al. Transient transcriptional responses to stress are generated by opposing effects of mRNA production and degradation. Mol Syst Biol. 2008;4(1):223–10. - PMC - PubMed
    1. Shalem O, Groisman B, Choder M, Dahan O, Pilpel Y. Transcriptome Kinetics Is Governed by a Genome-Wide Coupling of mRNA Production and Degradation: A Role for RNA Pol II. Barsh GS, editor. 2011. September 8;7(9):e1002273–10. 10.1371/journal.pgen.1002273 - DOI - PMC - PubMed

Publication types

MeSH terms