. 2020 Mar;24(5):3117-3127.
doi: 10.1111/jcmm.14980. Epub 2020 Feb 7.

Pharmacological screening and transcriptomic functional analyses identify a synergistic interaction between dasatinib and olaparib in triple-negative breast cancer

Affiliations

Pharmacological screening and transcriptomic functional analyses identify a synergistic interaction between dasatinib and olaparib in triple-negative breast cancer

Verónica Corrales-Sánchez et al. J Cell Mol Med. 2020 Mar.

Abstract

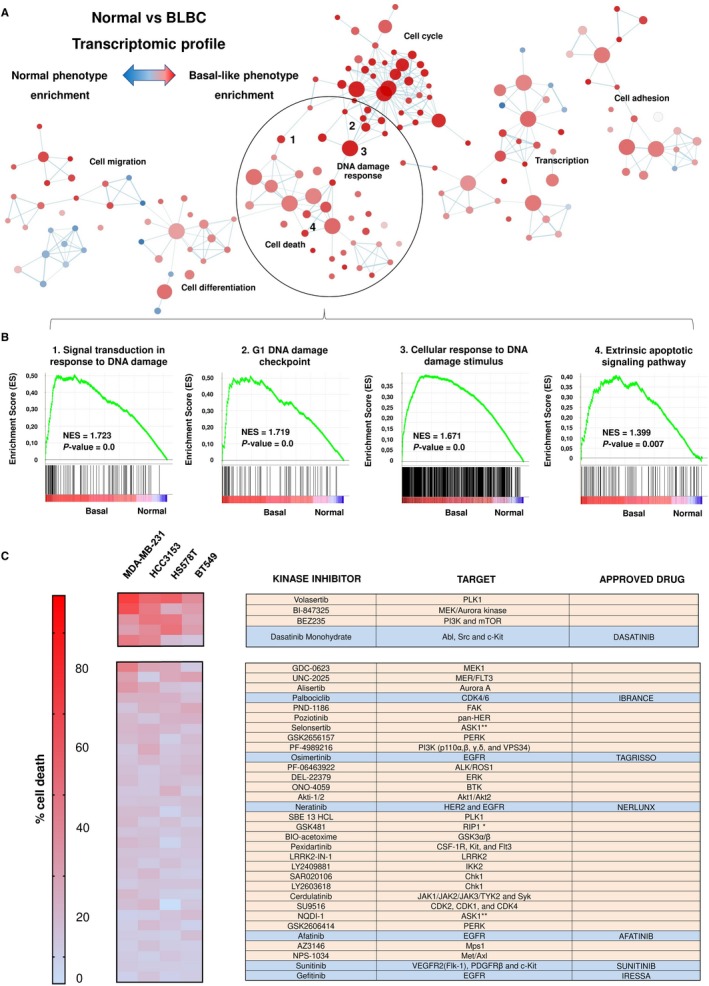
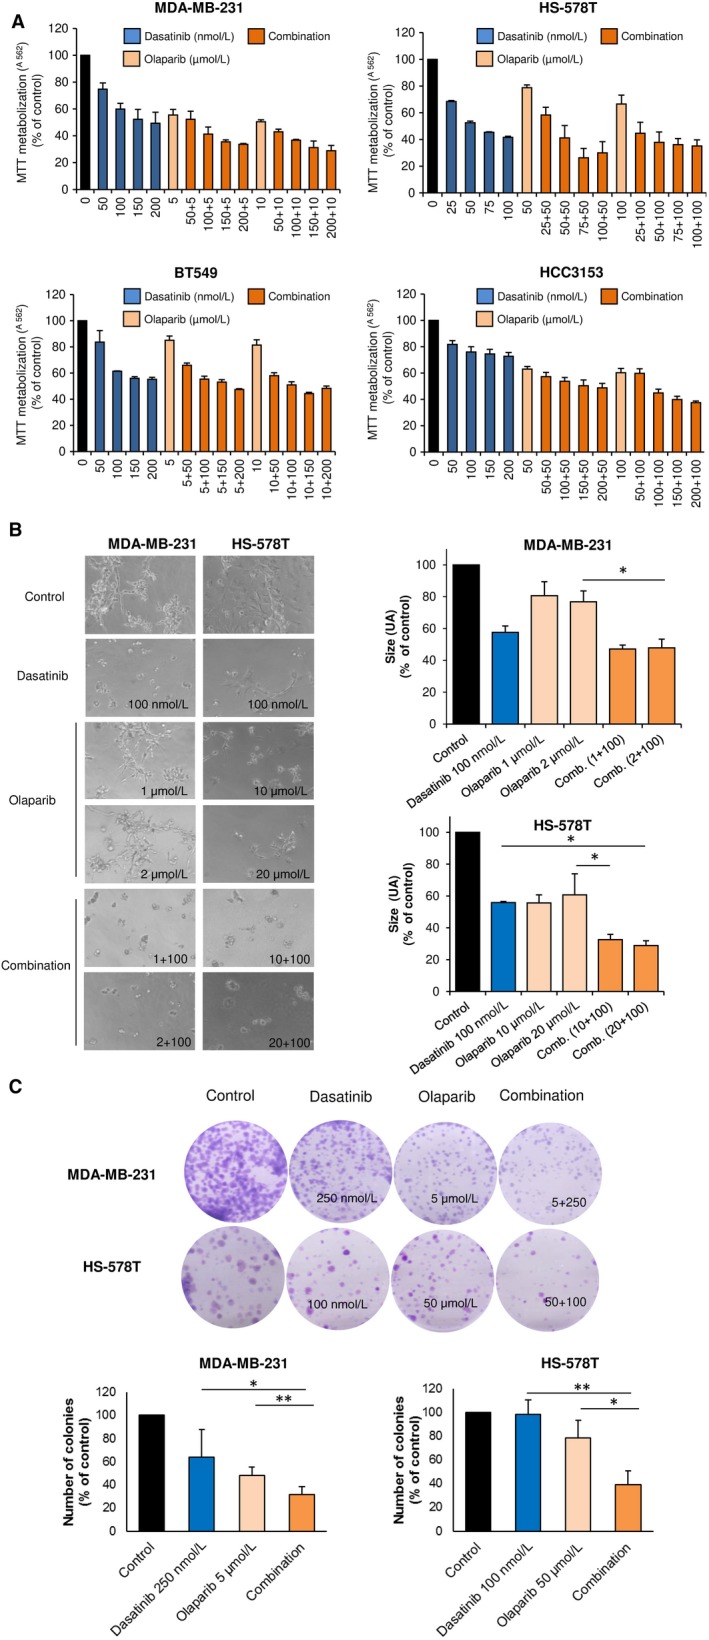
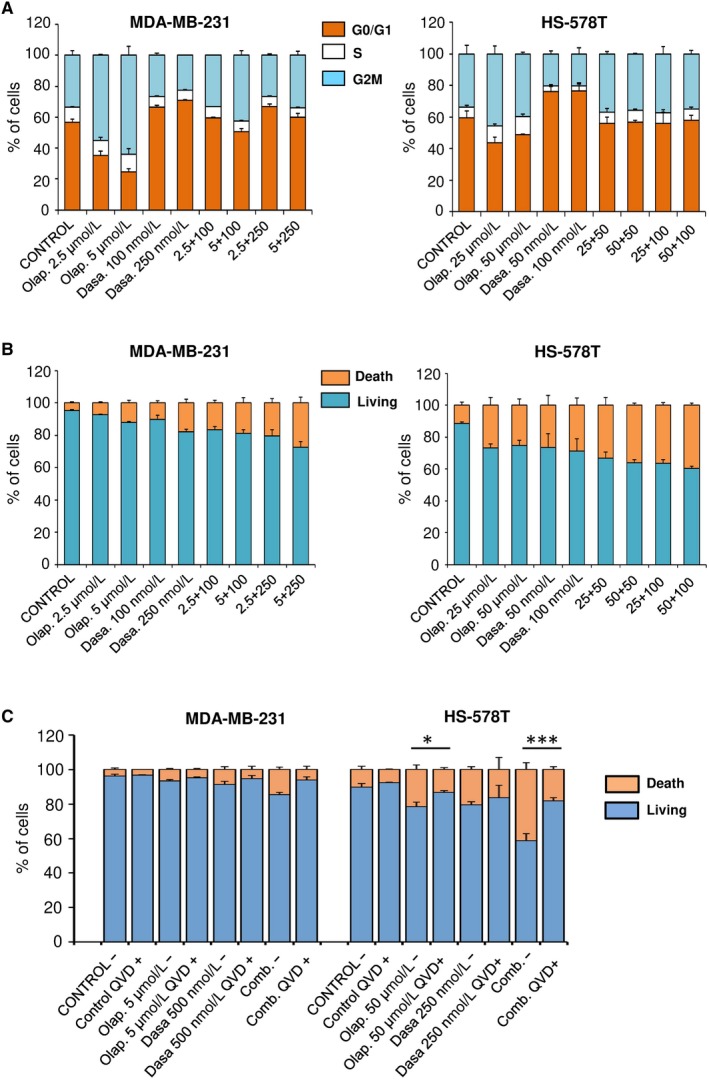
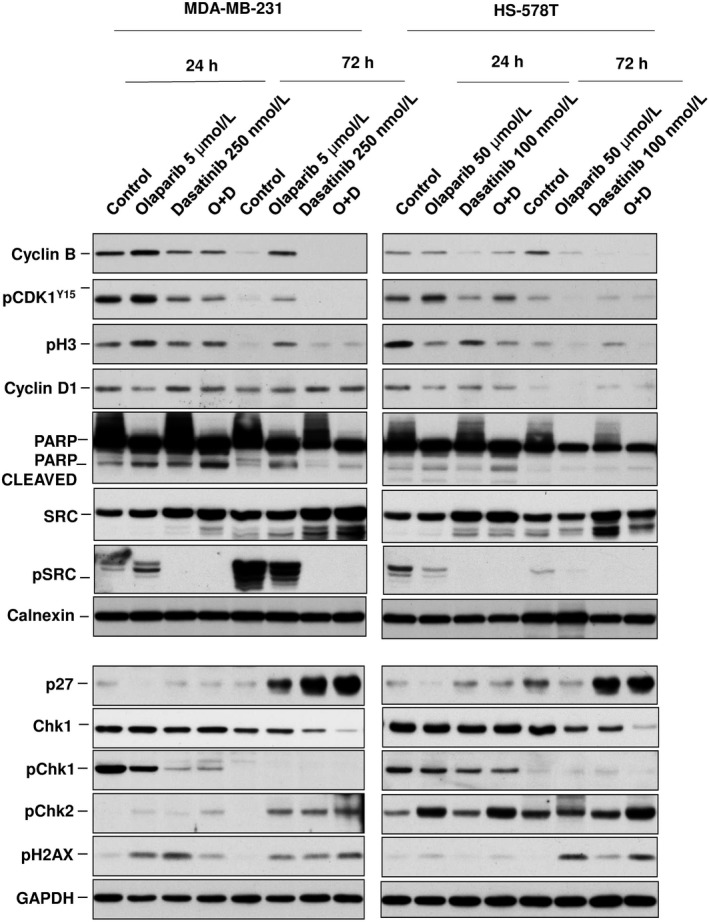
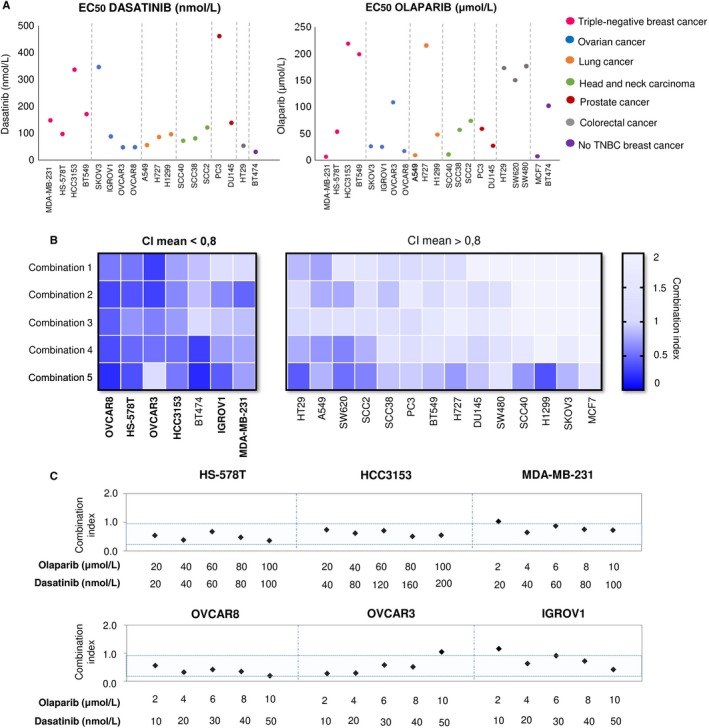
Identification of druggable vulnerabilities is a main objective in triple-negative breast cancer (TNBC), where no curative therapies exist. Gene set enrichment analyses (GSEA) and a pharmacological evaluation using a library of compounds were used to select potential druggable combinations. MTT and studies with semi-solid media were performed to explore the activity of the combinations. TNBC cell lines (MDAMB-231, BT549, HS-578T and HCC3153) and an additional panel of 16 cell lines were used to assess the activity of the two compounds. Flow cytometry experiments and biochemical studies were also performed to explore the mechanism of action. GSEA were performed using several data sets (GSE21422, GSE26910, GSE3744, GSE65194 and GSE42568), and more than 35 compounds against the identified functions were evaluated to discover druggable opportunities. Analyses done with the Chou and Talalay algorithm confirmed the synergy of dasatinib and olaparib. The combination of both agents significantly induced apoptosis in a caspase-dependent manner and revealed a pleotropic effect on cell cycle: Dasatinib arrested cells in G0/G1 and olaparib in G2/M. Dasatinib inhibited pChk1 and induced DNA damage measured by pH2AX, and olaparib increased pH3. Finally, the effect of the combination was also evaluated in a panel of 18 cell lines representative of the most frequent solid tumours, observing a particularly synergism in ovarian cancer. Breast cancer, triple negative, dasatinib, olaparib, screening.

Keywords: breast cancer; dasatinib; olaparib; screening; triple negative.


Conflict of interest statement

The authors declare that they have no competing interests.

Figures

Figure 1
Figure 1
In silico analyses and pharmacological screening. A, Gene set enrichment expression network constructed by using Cytoscape after comparing normal and basal‐like tumours. A total of 178 different gene sets related with several cellular functions were represented. Blue‐red intensity of colour was determined by normalized enrichment score and defined the phenotype enrichment. B, Enrichment score profile and locations of gene set members on the rank ordered list of the four most altered DNA damage signatures. All of them were enriched for basal‐like phenotype. C, Antiproliferative effect of the kinase inhibitor library in TNBC cell lines. Cell death is represented in a heat map; red colour indicates more antiproliferative effect. MDA‐MB‐231, HS‐578T, BT549 and HCC3153 cells were treated with the indicated kinase inhibitor (100 nmol/L) for 3 d. Then, cell viability was determined by MTT assay. Molecular targets for each inhibitor and approved FDA drugs (blue), when existed, are listed in the annex table. Main biological functions (Uniprot) of FDA‐approved drugs are also indicated
Figure 2
Figure 2
Antiproliferative and anti‐invasive effect of dasatinib‐olaparib combination in TNBC cells. A, Antiproliferative effect of dasatinib and olaparib combination in TNBC cells. MDA‐MB‐231, HS‐578T, BT549 and HCC3153 cells were incubated with increasing concentrations of dasatinib alone or in combination with olaparib indicated doses for 3 d and, then, cell viability was assessed by MTT assay. MTT metabolization is referred to control absorbance values. Results are shown as the mean of three independent experiment ± SD, each of them performed with triplicates. B, Invasion capacity of matrigel‐embedded invading cultures of MDA‐MB‐231 and HS‐578T is impaired with dasatinib and olaparib. Cells were grown in a semi‐solid matrigel matrix. Then, invading cultures were exposed to the indicated doses of the drugs, alone or in combination, for 3 d. Size is referred to area score as arbitrary length units (AU). Data of three independent experiments ± SD. C, Clonogenic formation of MDA‐MB‐231 and HS‐578T is reduced with the combination. Cells were treated (24 h) with the indicated doses. After, cells were reseeded (500 and 1000 cells, respectably). The colonies formed were fixed, stained and counted. Results were referred to control as percentage. Data of three independent experiments ± SD. *P < .05; **P < .01; ***P < .001
Figure 3
Figure 3
Cell death and cell cycle analysis by flow cytometry. A, Olaparib and dasatinib treatment leads to cell cycle arrest. MDA‐MB‐231 and HS‐578T were incubated the indicated doses of dasatinib, olaparib or both. After 24 h, cell cycle progression was examined by flow cytometry. Propidium iodide was used as DNA staining. Histogram shows the percentage of cells in the different phases of the cell cycle. B, Olaparib and dasatinib combination increases cell death. MDA‐MB‐231 and HS‐578T were incubated with the indicated doses of dasatinib, olaparib or both. After 72 h, apopototic activity was evaluated by flow cytometry. Annexin V was used as staining in combination with propidium iodide. Histograms present percentage of cells divided into living cells (AV‐, IP‐) vs apoptotic cells (AV+, PI‐ and AV+, PI+). C, Olaparib and dasatinib‐associated apoptosis is caspase‐dependent. MDA‐MB‐231 and HS‐578T were incubated with the indicated doses of dasatinib, olaparib or both, in presence or absence of pan‐caspase inhibitor QVD (10 μmol/L). After 72 h, apoptotic activity was evaluated by flow cytometry as explained in B. Results were show as living cells (AV‐, PI‐) vs apoptotic cells (AV+, PI‐ and AV+, PI+)
Figure 4
Figure 4
Biochemical analyses of proteins involved in cell cycle progression and cell death. Protein levels of Cyclin B, pCDK1(Y15), pH3, Cyclin D1, PARP and C‐PARP, p27, Chk1, pChk1, pChk2, pSrc, Src and pH2AX were evaluated in MDA‐MB‐231 and HS‐578T following dasatinib (250 and 100 nm, respectively) and olaparib (5 and 50 μmol/L) single and combination treatments (24 and 72 h) determined by Western blotting. Calnexin and GAPDH were used as loading control
Figure 5
Figure 5
Action of dasatinib and olaparib alone or in combination in multiple solid tumours cell lines. A, Effect of dasatinib and olaparib in individual treatments. EC50 values of the different solid tumours cancer cell lines after single dasatinib or olaparib treatment (72 h). Ovarian cancer, lung cancer, head and neck squamous carcinoma, prostate cancer, colorectal cancer, TNBC and non‐TNBC cell lines were used and indicated with different colours. Dasatinib EC50 values of MCF7, SW620 and SW480 cell lines are highest than 200 nmol/L. Cell viability was determinate by MTT colorimetry assay. MTT metabolization was referred to control (%). EC50 values were obtained by GraphPad software. B, Effect of dasatinib and olaparib combination treatments. Combination index (CI) heat map of drug combinations in solid tumours cancer cell lines. CI for the different drug combinations were obtained using CalcuSyn program from viability values obtained in an MTT assay after 72 h of incubation with the drugs. Combination doses used are shown in Table S1 . CI values lower than 0.8 indicate synergistic action. C, Synergistic action of dasatinib and olaparib on TNBC cells and ovarian cancer cells. Synergistic antiproliferative effects of dasatinib and olaparib in TNBC cell lines (HS‐578T, HCC3153 and MDA‐MB‐231) and ovarian cell lines (OVCAR8, OVCAR3 and IGROV1). CI for the different drug combinations were obtained as described in B. Blue zone represents CI synergistic values for the different drug combinations

References

    1. Amir E, Seruga B, Serrano R, Ocana A. Targeting DNA repair in breast cancer: a clinical and translational update. Cancer Treat Rev. 2010;36:557‐565. - PubMed
    1. Dietlein F, Thelen L, Reinhardt HC. Cancer‐specific defects in DNA repair pathways as targets for personalized therapeutic approaches. Trends in genetics. 2014;30:326‐339. - PubMed
    1. Denkert C, Liedtke C, Tutt A, von Minckwitz G. Molecular alterations in triple‐negative breast cancer‐the road to new treatment strategies. Lancet. 2016;389(10087):2430‐2442. - PubMed
    1. Turner N, Tutt A, Ashworth A. Hallmarks of 'BRCAness' in sporadic cancers. Nat Rev Cancer. 2004;4:814‐819. - PubMed
    1. Turner NC, Lord CJ, Iorns E, et al. A synthetic lethal siRNA screen identifying genes mediating sensitivity to a PARP inhibitor. EMBO J. 2008;27:1368‐1377. - PMC - PubMed

Publication types

MeSH terms