Multicenter Study
. 2020 Mar;128(3):207-220.
doi: 10.1002/cncy.22236. Epub 2020 Feb 7.

Point-of-care oral cytology tool for the screening and assessment of potentially malignant oral lesions

Affiliations
Multicenter Study

Point-of-care oral cytology tool for the screening and assessment of potentially malignant oral lesions

Michael P McRae et al. Cancer Cytopathol. 2020 Mar.

Abstract

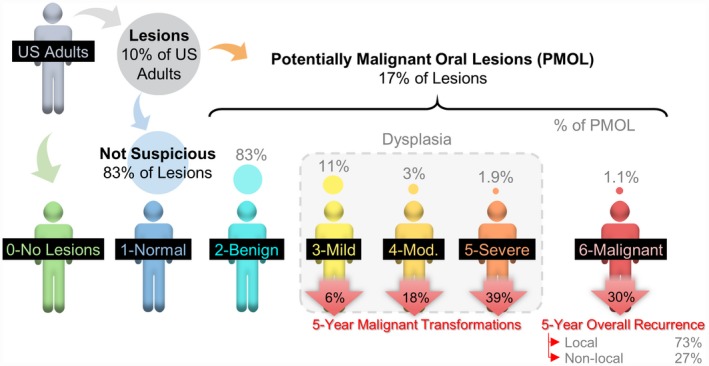
Background: The effective detection and monitoring of potentially malignant oral lesions (PMOL) are critical to identifying early-stage cancer and improving outcomes. In the current study, the authors described cytopathology tools, including machine learning algorithms, clinical algorithms, and test reports developed to assist pathologists and clinicians with PMOL evaluation.

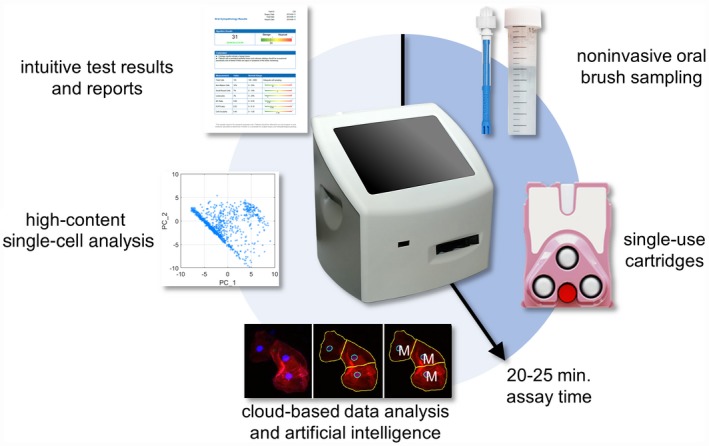
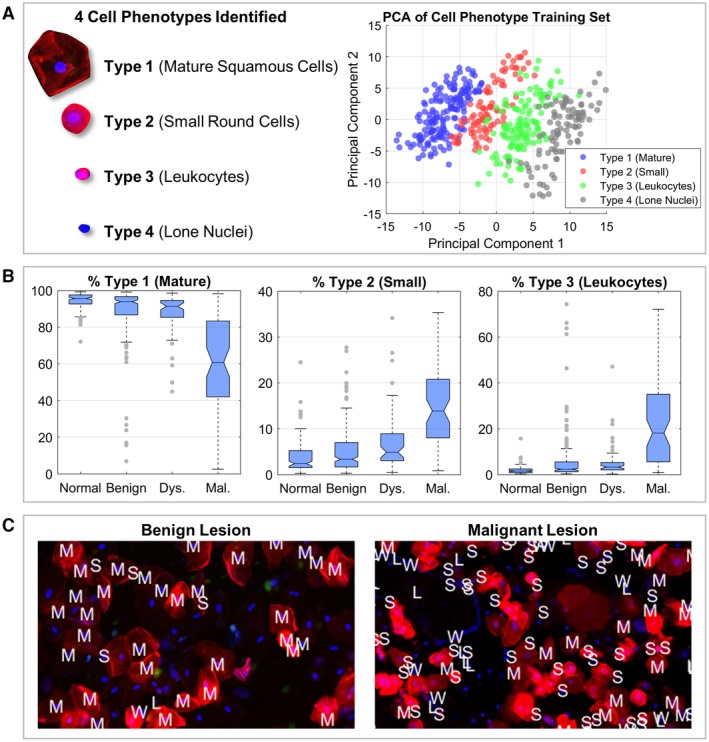
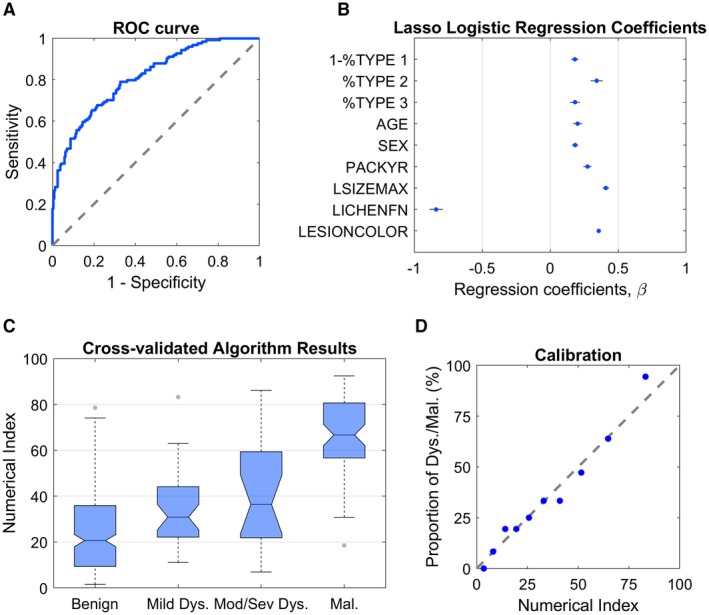
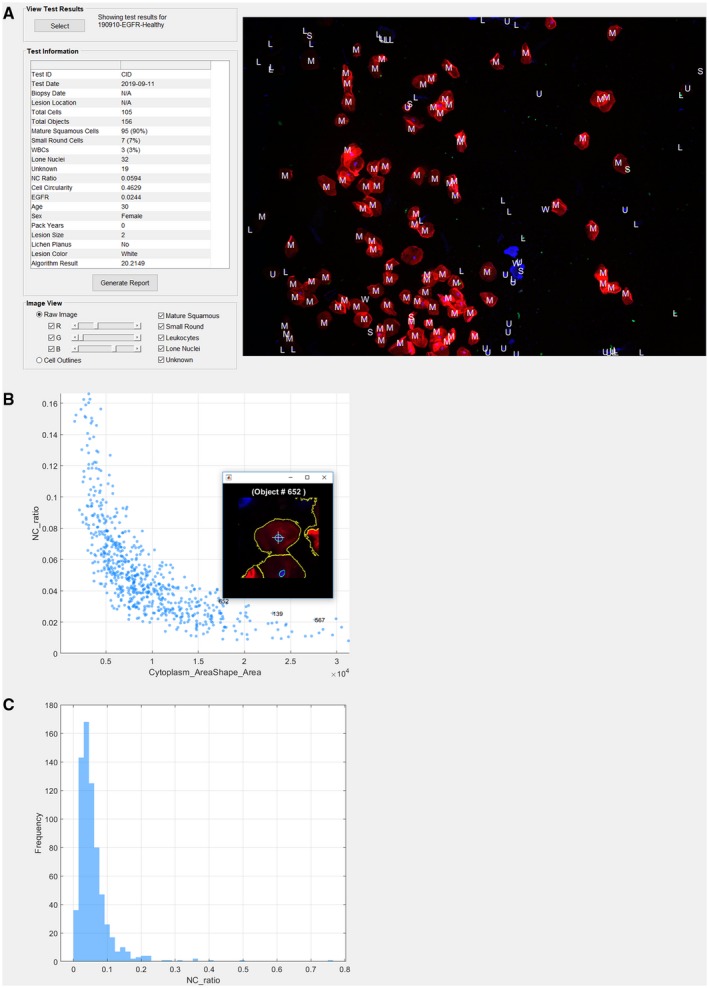
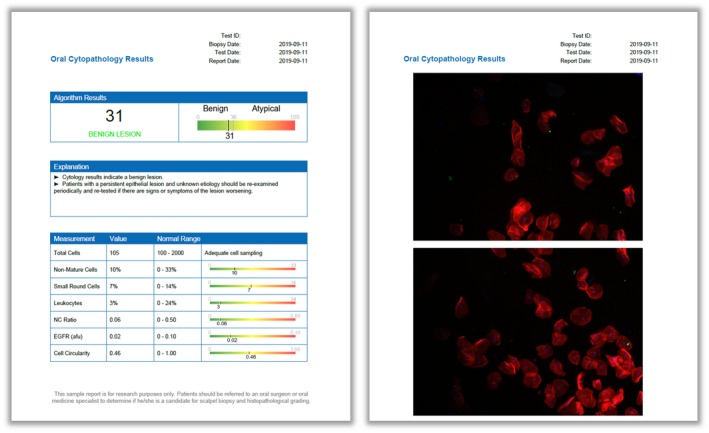
Methods: Data were acquired from a multisite clinical validation study of 999 subjects with PMOLs and oral squamous cell carcinoma (OSCC) using a cytology-on-a-chip approach. A machine learning model was trained to recognize and quantify the distributions of 4 cell phenotypes. A least absolute shrinkage and selection operator (lasso) logistic regression model was trained to distinguish PMOLs and cancer across a spectrum of histopathologic diagnoses ranging from benign, to increasing grades of oral epithelial dysplasia (OED), to OSCC using demographics, lesion characteristics, and cell phenotypes. Cytopathology software was developed to assist pathologists in reviewing brush cytology test results, including high-content cell analyses, data visualization tools, and results reporting.

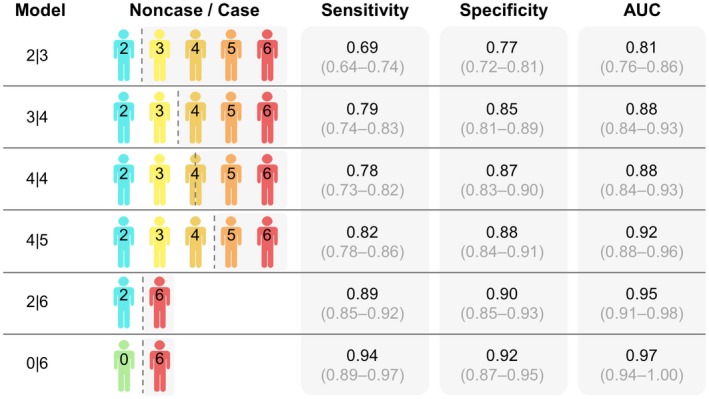
Results: Cell phenotypes were determined accurately through an automated cytological assay and machine learning approach (99.3% accuracy). Significant differences in cell phenotype distributions across diagnostic categories were found in 3 phenotypes (type 1 ["mature squamous"], type 2 ["small round"], and type 3 ["leukocytes"]). The clinical algorithms resulted in acceptable performance characteristics (area under the curve of 0.81 for benign vs mild dysplasia and 0.95 for benign vs malignancy).

Conclusions: These new cytopathology tools represent a practical solution for rapid PMOL assessment, with the potential to facilitate screening and longitudinal monitoring in primary, secondary, and tertiary clinical care settings.

Keywords: artificial intelligence; biomarkers; cytology; oral epithelial dysplasia; point-of-care testing; single-cell analysis; squamous cell carcinoma.


Conflict of interest statement

Michael P. McRae has served as paid consultant for SensoDx and has a provisional patent pending. Glennon W. Simmons has patents US10060937B2 and US7781226B2 issued. Denise A. Trochesset has received grants from the New York University College of Dentistry for work performed as part of the current study. Martin H. Thornhill has received National Institutes of Health grant 1RC2DE020785‐01 for work performed as part of the current study. Spencer W. Redding has patent US9535068B2 issued. Stella K. Kang has received royalties from Wolters Kluwer for work performed outside of the current study. John T. McDevitt has received grants from the National Institutes of Health for work performed as part of the current study (grants 1RC2DE020785‐01, 4R44DE025798‐02, and R01DE024392) and has a provisional patent pending. In addition, he has an ownership position and an equity interest in SensoDx II LLC and also serves on its Scientific Advisory Board. The other authors made no disclosures.

Figures

Figure 1
Figure 1
Diagnostic categories for oral cancer and dysplasia based on the World Health Organization classification with 5‐year malignant transformations and 5‐year cancer recurrence rates. Although approximately 10% of US adults may present to their dentist for a routine care visit with an abnormal oral cavity lesion, approximately 83% of these lesions are diagnosed clinically as having no malignant potential, and 17% have unknown significance and meet the clinical criteria for potentially malignant oral lesions (PMOLs). Approximately 17% of patients with PMOLs are histopathologically diagnosed with oral epithelial dysplasia (OED) or oral squamous cell carcinoma (OSCC). OED is approximately 15 times more common than OSCC, yet only a small percentage of patients with dysplastic PMOLs undergo malignant transformation.
Figure 2
Figure 2
The Point‐of‐Care Oral Cytology Tool (POCOCT) assay platform allows for the analysis of cellular samples obtained from a minimally invasive brush cytology sample. The cell suspension collected in this manner allows for the simultaneous quantification of cell morphometric data and the expression of molecular biomarkers of malignant potential in an automated manner using refined image analysis algorithms based on pattern recognition techniques and advanced statistical methods. This novel approach turns around cytology results in a matter of minutes compared with days for traditional pathology methods, thereby making it amenable to POC settings. The POC testing is expected to have tremendous implications for disease management by enabling dental practitioners and primary care physicians to circumvent the need for multiple referrals and consultations before obtaining assessment of molecular risk of PMOL.
Figure 3
Figure 3
A cell type identification model was developed to automatically classify cell types 1 to 4. Panel A (left) shows the 4 distinct cell phenotypes that were identified: type 1 (“mature squamous cells”), type 2 (“small round cells”), type 3 (“leukocytes”), and type 4 (“lone nuclei”). Principal component analysis (PCA) (right) shows cell phenotypes clustered into distinct groups with substantial separation between cell phenotype labels, demonstrating strong promise for an effective cell phenotype recognition algorithm. Boxplots in panel B show the study population distributions of mature squamous cells (left), small round cells (center), and leukocytes (right), representing the predicted mean cell type percentages across 6 biomarker assays (αvβ6, CD‐147, EGFR, geminin, Ki‐67, and MCM2) within each lesion class: normal (121 cases), benign (241 cases), dysplasia (59 cases), and malignant (65 cases). The results shown include only patients with definitive lesion determinations and patients with evaluable data for all 6 biomarkers. Panel C shows limited field‐of‐view cytology pseudocolor images (fluorescence images acquired with a monochrome camera and digitally assigned to red, green, and blue color channels) of benign (left) and malignant (right) lesions with the cell phenotype model output labels overlaid as follows: “M” indicates mature squamous cells, “S” indicates small round cells, “W” indicates leukocytes, and “L” indicates lone nuclei (unknown type [“U”] not shown). Fluorescent staining showed the cytoplasm (red), nuclei (blue), and Ki‐67 biomarker (green). Dys indicates dysplasia; Mal, malignant.
Figure 4
Figure 4
Algorithm results of the dichotomous benign versus dysplasia/malignant lesion model from 241 subjects with benign lesions and 124 subjects with dysplasia and malignant lesions for 6 molecular biomarker assays on the Point‐of‐Care Oral Cytology Tool (POCOCT) system. Panel A shows the receiver operating characteristic (ROC) curve for the model. The least absolute shrinkage and selection operator (lasso) logistic regression coefficients are provided in panel B. The predictors were as follows: “1‐%TYPE 1” (percentage of cells that were nonmature squamous cells), “%TYPE 2” (percentage of cells that were small round cells), “%TYPE 3” (percentage of cells that were leukocytes), “AGE,” “SEX,” “PACKYR” (pack‐years of smoking), “LSIZEMAX” (lesion diameter of the major axis), “LICHENFN” (clinical impression of lichen planus), and “LESIONCOLOR” (red, white, or red/white). The boxplot in panel C shows cross‐validated algorithm response (“numerical index”) for the lasso logistic regression on the test set averaged over all biomarker assays. Distribution of scores are represented for benign (241 lesions), mild dysplasia (38 lesions), moderate/severe dysplasia (21 lesions), and malignant (65 lesions). Panel D shows a model calibration plot of the predicted responses (numerical index) sorted and grouped into deciles versus the observed percentages of dysplasia and malignant lesions. Mod/sev dys indicates moderate/severe dysplasia.
Figure 5
Figure 5
Diagnostic models for the oral epithelial dysplasia (OED) spectrum. Results are shown for the cross‐validated clinical algorithms for benign versus dysplasia (model 2|3), mild versus moderate dysplasia (model 3|4), low versus high risk (model 4|4), moderate versus severe dysplasia (model 4|5), healthy control (no lesion) versus malignant (model 0|6), and benign dysplasia versus malignant (model 2|6) models. Model responses for each subject were averaged over all biomarker assays to inform diagnostic performance. The area under the curve (AUC), sensitivity, and specificity are shown as the mean and 95% CI values for the cross‐validated test set.
Figure 6
Figure 6
The cytopathology interface tool provides pathologists with cloud access to test results summaries and detailed (A) data visualizations, (B) scatter plots, and (C) histograms for >150 different cytology parameters. With this tool, pathologists can view all cells within the field of view, zoom in for more detail, and isolate individual cells of interest. L indicates lone nuclei; M, mature squamous cells; NC, nuclear‐cytoplasmic ratio; S, small round cells; U, unknown type; W, leukocytes; WBC, white blood cell.
Figure 7
Figure 7
Oral cytopathology test results. The algorithm result is a numerical index between 0 and 100 with a cutoff value of 36 that distinguishes benign and dysplasia/malignant (“atypical”) lesions (left). Other informative cytopathology results are shown on a reference range, including total cell counts, cell phenotype distributions, mean values for the nuclear‐cytoplasmic (NC) ratio, molecular biomarker fluorescence intensity, and cell circularity. Images and outlines of the cells are provided for additional test context (right). afu indicates arbitrary fluorescence units.

References

    1. Shield KD, Ferlay J, Jemal A, et al. The global incidence of lip, oral cavity, and pharyngeal cancers by subsite in 2012. CA Cancer J Clin. 2017;67:51‐64. - PubMed
    1. National Cancer Institute Surveillance, Epidemiology, and End Results Program . Cancer stat facts: oral cancer and pharynx cancer. Accessed May 10, 2019. https://seer.cancer.gov/statfacts/html/oralcav.html
    1. Neville BW, Damm DD, Allen CM, Chi AC. Epithelial pathology In: Neville BW, Damm DD, Allen CM, Chi AC, eds. Oral Maxillofacial Pathology. 4th ed Elsevier Health Sciences; 2015:331‐421.
    1. Siegel RL, Miller KD, Jemal A. Cancer statistics, 2018. CA Cancer J Clin. 2018;68:7‐30. - PubMed
    1. Huber MA. Adjunctive diagnostic techniques for oral and oropharyngeal cancer discovery. Dent Clin North Am. 2018;62:59‐75. - PubMed

Publication types

MeSH terms

Substances