. 2020 Feb 6;26(2):277-293.e8.
doi: 10.1016/j.stem.2020.01.002.

Defining the Adult Neural Stem Cell Niche Proteome Identifies Key Regulators of Adult Neurogenesis

Affiliations

Defining the Adult Neural Stem Cell Niche Proteome Identifies Key Regulators of Adult Neurogenesis

Jacob Kjell et al. Cell Stem Cell. .

Abstract

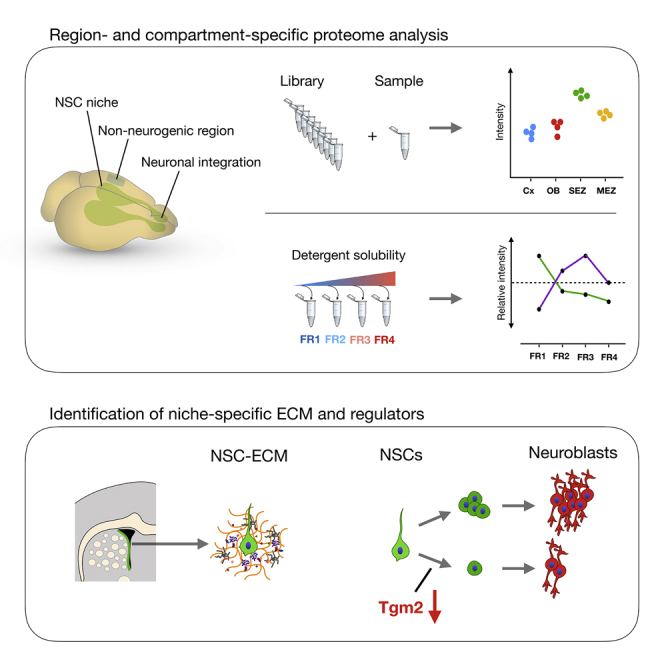
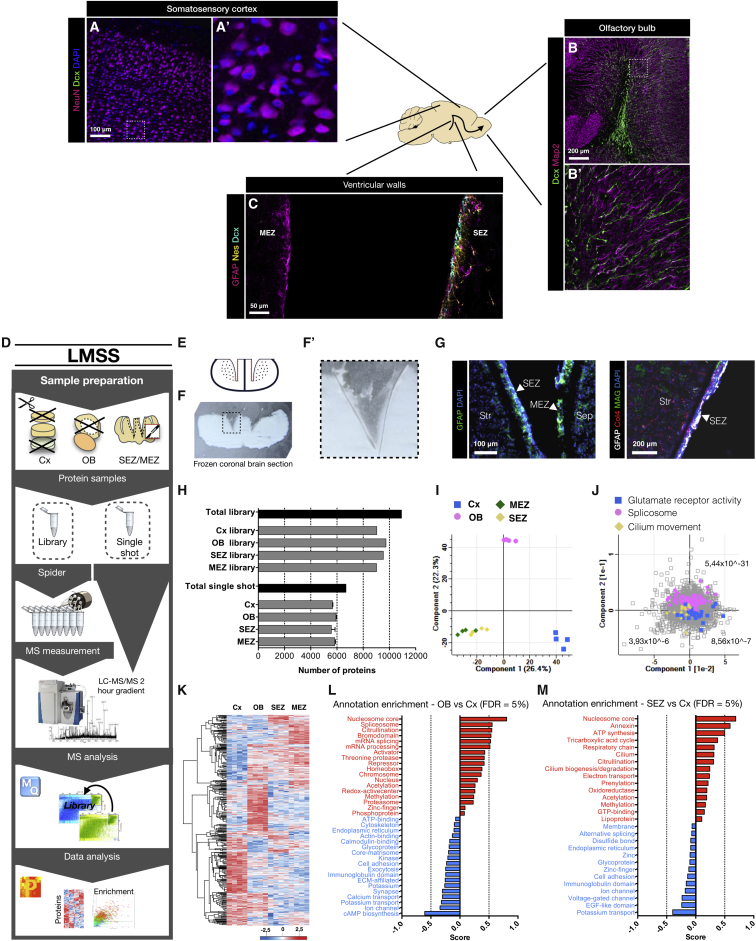
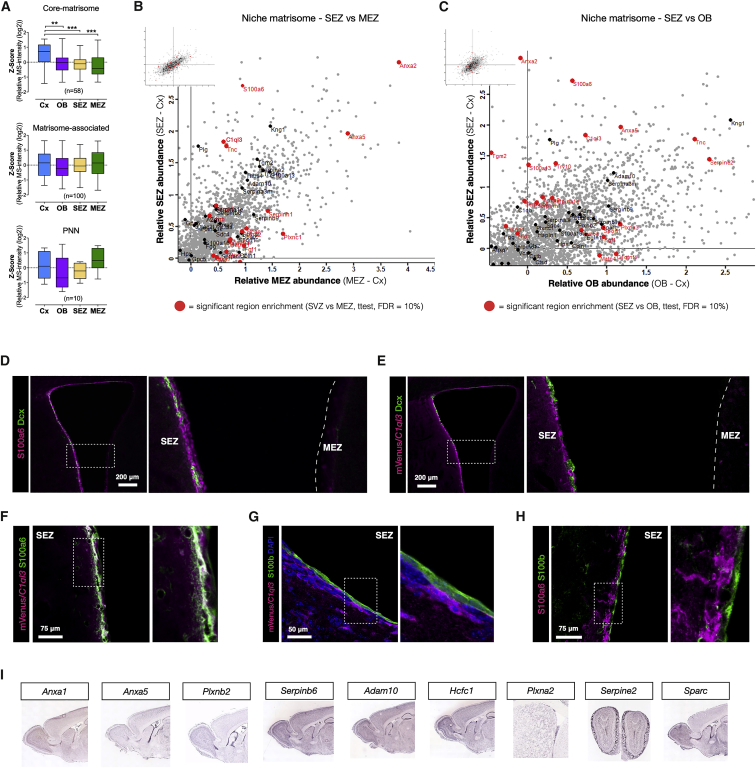
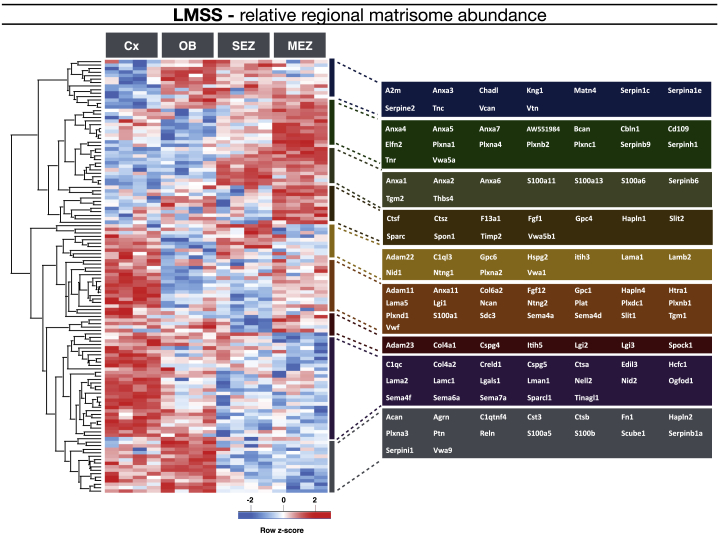
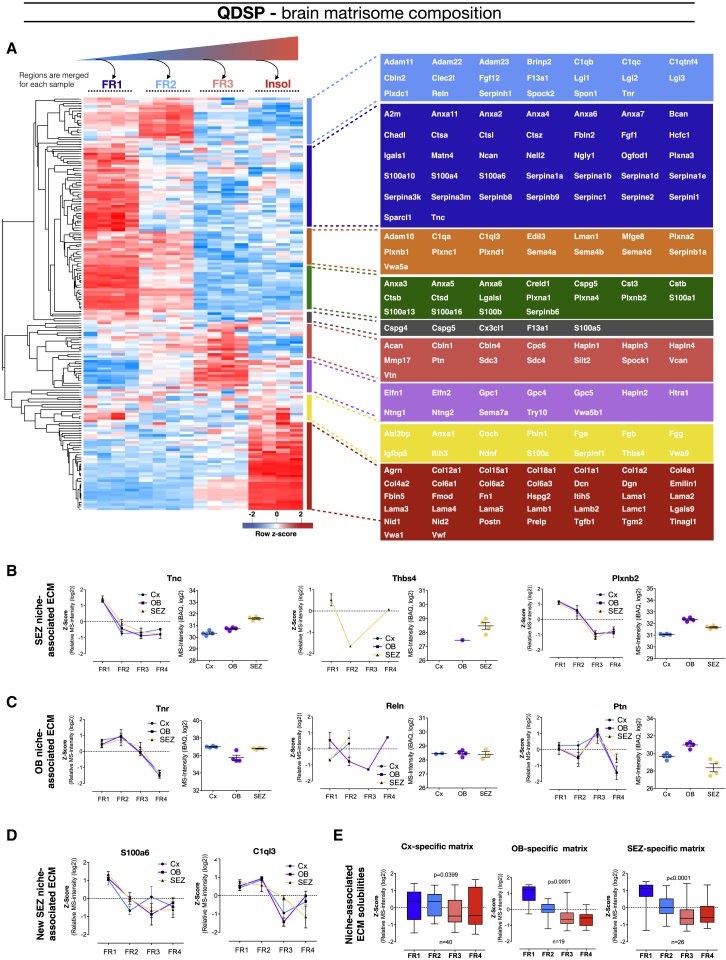
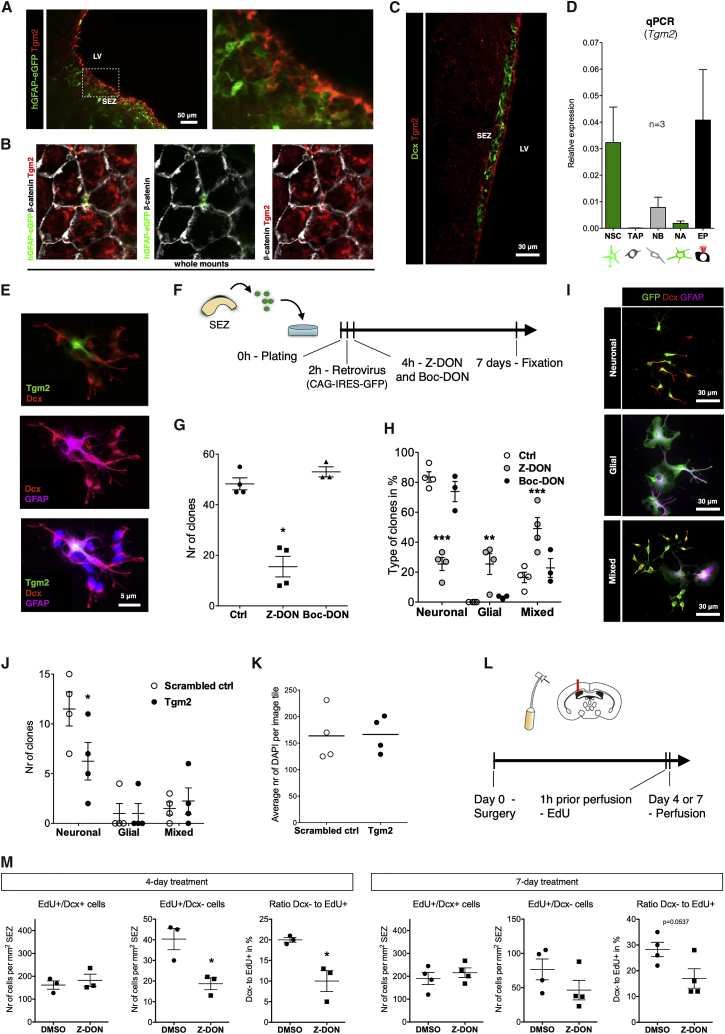
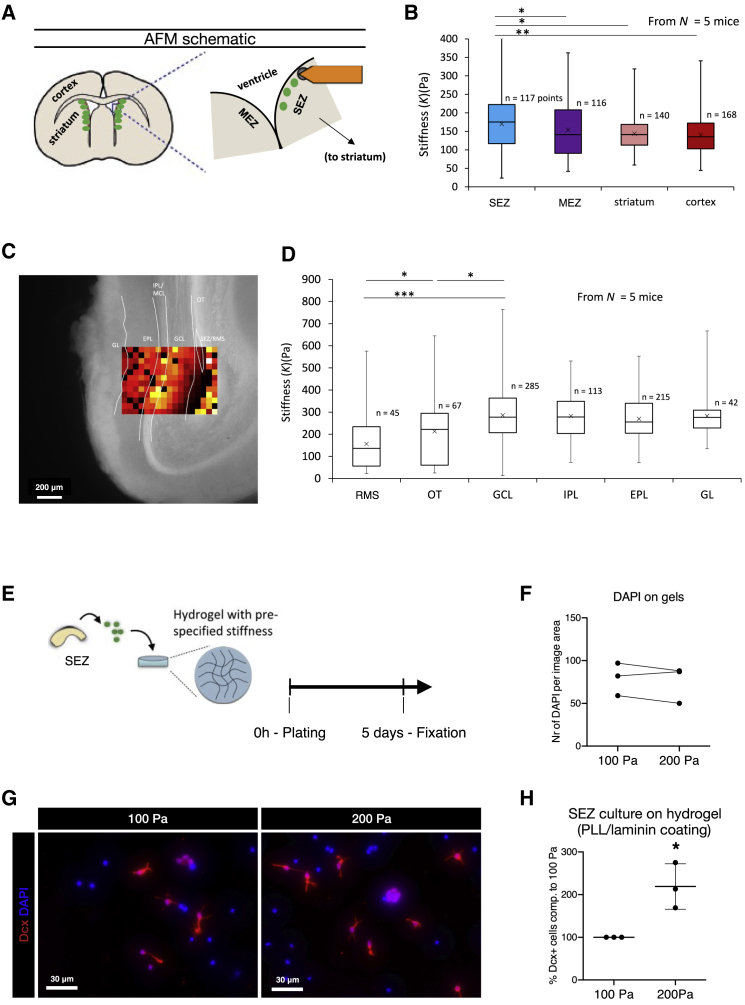
The mammalian brain contains few niches for neural stem cells (NSCs) capable of generating new neurons, whereas other regions are primarily gliogenic. Here we leverage the spatial separation of the sub-ependymal zone NSC niche and the olfactory bulb, the region to which newly generated neurons from the sub-ependymal zone migrate and integrate, and present a comprehensive proteomic characterization of these regions in comparison to the cerebral cortex, which is not conducive to neurogenesis and integration of new neurons. We find differing compositions of regulatory extracellular matrix (ECM) components in the neurogenic niche. We further show that quiescent NSCs are the main source of their local ECM, including the multi-functional enzyme transglutaminase 2, which we show is crucial for neurogenesis. Atomic force microscopy corroborated indications from the proteomic analyses that neurogenic niches are significantly stiffer than non-neurogenic parenchyma. Together these findings provide a powerful resource for unraveling unique compositions of neurogenic niches.

Keywords: C1ql3; S100a6; cerebral cortex; extracellular matrix; neuroblast; olfactory bulb; subventricular zone; tissue stiffness; transglutaminase2; transit-amplifying progenitor.


Conflict of interest statement

Declaration of Interests The authors declare no competing interests.

Figures

None
Graphical abstract
Figure 1
Figure 1
High-Resolution Proteome of the Somatosensory Cortex and Neurogenic Niches (A–C) The schematic drawing indicates a sagittal section of the adult murine brain with example photomicrographs of the regions used in this analysis—the non-neurogenic somatosensory cortex (A), the olfactory bulb (OB), where new neurons (labeled for doublecortin [Dcx]) integrate (B), and the lateral sub-ependymal zone (SEZ) where most NSCs reside, whereas only a few are located in the medial sub-ependymal zone (MEZ) (C). Sections were immunostained as indicated in the panels and are confocal z stacks. (D) Experimental workflow using loss-less nano-fractionation for library-matched single shot measurements. (E) Schematic of the high-precision cryo-dissection of the SEZ and the MEZ. (F) Picture of a 50-μm frozen coronal section (white, ventral down) with cortex, corpus callosum, and choroid plexus removed. (F′) shows magnification of the dissected region visible as a thin gray line. (G) Photomicrographs of cryo-dissected SEZ and MEZ (separated from striatum [Str] and septum [Sep]) stained for GFAP and DAPI (left panel) and cryo-dissected SEZ stained for GFAP, collagen 4 (Col4), myelin-associated glycoprotein (MAG), and DAPI (right panel). (H) Number of proteins quantified in the library sample measurements and the library-matched single shot (LMSS) sample measurements for each region. Data are shown as mean ± standard deviation (n = 1 library sample per region, n = 4 single shot samples per region). See also Figures S1A–S1D. (I) Principal component analysis (PCA) for each brain region. Components 1 and 2 separate the main regions. The SEZ and the MEZ are similar in these components. (J) Colors indicate three categories that are enriched, respectively, in the Cx, the OB, and both the SEZ and the MEZ (FDR is presented for each category). (K) Heatmap of 4,786 proteins found to be of different abundance comparing the four brain regions (n = 4 per region). Intensities are based on label-free quantification (LFQ) intensities after unsupervised hierarchical clustering (ANOVA with Benjamin-Hochberg post hoc test, FDR = 0.05). (L) The datasets were annotated with Uniprot keywords and the matrisome annotation (see STAR Methods). Enriched features of the OB in comparison to the Cx were then scored (0 to 1) and are displayed in a bar graph (1D-annotation enrichment, FDR = 0.05). Conversely, features with a negative score (0 to −1) are enriched in the Cx compared to the OB. (M) Enriched features of the SEZ in comparison to the Cx were analyzed in the same manner (1D-annotation enrichment, FDR = 0.05). Scale bars as indicated in the panels.
Figure 2
Figure 2
Niche-Specific ECM and NSC Markers (A) Distribution plots of each brain region in the different categories of the matrisome as indicated. Average LFQ intensities for each protein were Z scored and displayed in whisker plots (ANOVA, Kruskal-Wallis test with Dunn’s multiple comparison test, p = 0.05, ∗∗p = 0.01, and ∗∗∗p = 0.001). (B) Scatterplot with the matrisome (black) and matrisome significantly different (FDR ≤ 0.1) comparing the SEZ and the MEZ (red) highlighted. (C) Scatterplot with the relative SEZ and OB values and significant differences (FDR ≤ 0.1) between intensities for the SEZ and the OB. Both plots highlight S100a6 and C1ql3 as enriched in the SEZ. See also Figures S2B and S2C. (D–H) Photomicrographs of the ventricle and the SEZ and the MEZ from coronal brain sections of C57BL/6J mouse or mVenus/C1ql3 transcriptional reporter mouse immunostained as indicated. Note that S100a6 and C1ql3 are not found in Dcx+ neuroblasts or parenchymal astrocytes and, typically, neither in ependymal cells. Scale bars as indicated, and (D) and (E) are z stacks of confocal images, while (F)–(H) are single optical sections. See also Figures S3 and S4A–S4I. (I) In situ hybridization shows mRNA expression in the SEZ. Image credit: Allen Institute for Brain Science.
Figure 3
Figure 3
Regional Matrisome Distribution and Neurogenic Niche-Specific Matrisome We compared 158 matrisome proteins and 78 of these had a significantly different distribution in the respective regions, of which the somatosensory cortex was found to be most abundant with extracellular matrix proteins. The heatmap displays unsupervised hierarchical clustering of the matrisome proteins with significantly different abundance when comparing the four brain regions (ANOVA with Benjamin-Hochberg post hoc test, FDR = 0.05). Members of different clusters (indicated by bars on the right of the heatmap) are listed on the further right of the heatmap in colored areas.
Figure 4
Figure 4
Compartment Analysis with In-Depth Quantitative Proteomes of the Somatosensory Cortex and the Neurogenic Niches (A) With stepwise de-cellularization we determined insoluble and various diffusible grades of ECM and other cellular compartment-associated proteins. (B) Total number of quantified proteins for all regions (top, black and gray) and proteins quantified in each detergent fraction from each of the three brain regions (bottom, color). Each sample fraction is shown as mean ± standard deviation (n = 4 in each brain region). (C) Solubility profile overview and distribution plot for the proteins in the displayed categories. Abundances were Z scored and then averaged for each protein in these categories shown in whisker plots with number of proteins in each category displayed in the graphs. Insoluble proteins distribute more toward fraction four and soluble proteins distribute toward fraction one (significance analyzed with Kruskal-Wallis test with Dunn’s multiple comparison test). See also Figures S2G, S5A, and S5B. (D) Heatmap of 1,216 proteins with significantly different solubility among our three regions (FDR ≥ 0.05). (E and F) Significantly enriched features among the more soluble (E) and insoluble (F) proteins in the OB when compared to the Cx using the relative difference of the LFQ intensities in the fourth fraction (1D-annotation enrichment, FDR = 0.05). The dataset was annotated with Uniprot keywords, matrisome, and a custom perineural nets annotation (see STAR Methods). (G) From the relatively more soluble and insoluble proteins in the OB, we display the quantitative profile of lamins of the nuclear matrix and neurogenesis-associated proteins (two-way ANOVA). Data are presented as mean ± SEM. (H) Matrisome proteins with significantly different solubility profiles comparing the three brain regions (Z scored LFQ intensity values, two-way ANOVA, p ≥ 0.05). Rows have undergone unsupervised hierarchical clustering.
Figure 5
Figure 5
Brain- and Niche-Matrisome Composition (A) The matrisome protein solubility profiles are displayed using unsupervised hierarchical clustering of the detergent solubility profiles derived from averaged Z scores from each brain region (the Cx, the OB, and the SEZ). (B–D) Detergent solubility profiles for the SEZ-associated ECM proteins (B) Tenascin-C (Tnc), Thrombospondin-4 (Thbs4), and Plexin-b2 (Plxnb2); the OB-associated proteins (C) Tenascin-R (Tnr), Reelin (Reln), and Pleiotrophin (Ptn); and the two neurogenic niche-specific proteins (D) S100a6 and C1ql3 (p = 0.0948). Data are presented as mean ± SEM. (E) Solubility profiles for Cx-, SEZ-, and OB-enriched matrisome proteins shown in whisker plots (ANOVA, p values in graphs).
Figure 6
Figure 6
Transglutaminase 2 Promotes Neurogenesis (A) NSCs were identified as hGFAP-GFP+ cells in the SEZ in sagittal sections counterstained with Tgm2 and inserted to the right indicated by the dashed line in the lower magnification picture on the left. Both NSCs and ependymal cells were labeled with Tgm2. LV, lateral ventricle. (B) Whole-mount section of the SEZ showing an hGFAP-GFP+ Tgm2+ apical endfoot between ependymal cells delineated by β-catenin+ junctions. (C) Single-plane confocal picture of the coronal section of the SEZ immunostained for Dcx and Tgm2 showing no double-positive cells. (D) Tgm2 expression analysis by qRT-PCR in cells isolated from the SEZ by fluorescence-activated cell sorting (FACS). NSCs were identified by hGFAP-eGFP+ and the apical membrane marker CD133+, ependymal cells (EP) as hGFAP-GFP-/CD133+ and hGFAP-GFP+, and CD133-, PSA-NCAM-, EGFR- cells as niche astrocytes (NA). Note that NSCs and ependymal cells express high levels of Tgm2 mRNA. The direct progeny of NSCs, the transit-amplifying progenitors (TAPs), isolated as EGFR+, CD133-, PSA-NCAM-, and neuroblasts, isolated as PSA-NCAM+ also hardly expressed Tgm2. Data are presented as mean ± standard deviation. (E) Primary culture from the SEZ stained as indicated showing that Tgm2+ cells were also GFAP+. (F) Experimental setup for the primary SEZ culture and clonal analysis following Tgm2 inhibition with Z-DON (irreversible Tgm2 inhibitor) or Boc-DON (cell membrane impermeable and irreversible Tgm2 inhibitor). (G) 10-μM Z-DON treatment at 4 h after plating significantly reduced the number of retrovirally labeled cell clusters (clones, i.e., a cluster of cells sharing the cell of origin), whereas 100-μM Boc-DON did not alter the number of clones. Data are presented as mean ± SEM. p ≤ 0.05, two-tailed Mann-Whitney test. (H) With Z-DON, but not Boc-DON, the proportion of GFP+ clones containing newly generated neuroblasts (Dcx+) was reduced, whereas the proportion of mixed and glial clones arising from NSCs was conversely increased. Data are presented as mean ± SEM, two-way ANOVA with Bonferroni’s multiple comparison test, ∗∗p ≤ 0.01 and ∗∗p ≤ 0.001. (I) Examples of retrovirally labeled (CAG-IRES-GFP) clones composed of neuronal, glial, and mixed cell types stained as indicated. Scale bars as indicated. (J) Primary SEZ cultures were treated with 10-nM siRNAs against Tgm2 and showed a reduced number of neuronal clones compared to the control (scrambled siRNA) (n = 4, Data are presented as mean ± SEM, two-way ANOVA with Bonferroni’s multiple comparison test, p ≤ 0.05). (K) Countings of DAPI stainings from representative tiles (n = 4, with nine tiles counted in each n). (L) Experimental setup for osmotic pump experiment with two time-points, 4 and 7 days, with continuous intra-ventricular infusion of 100-μM Z-DON in artificial CSF. (M) On the contralateral side of the infusion, we quantified EdU+ cells that were either Dcx+ or Dcx− at the SEZ. After 4 days Z-DON treatment, we found a significant reduction in TAPs (EdU+/Dcx−), whereas proliferating neuroblasts (EdU+/Dcx+) remained similar to control (Data are presented as mean ± SEM. p ≤ 0.05, two-tailed t test). This trend continued after 7 days treatment (Data are presented as mean ± SEM. p = 0.0537, two-tailed t test). Confocal image stacks from 6 sections were quantified per brain.
Figure 7
Figure 7
Higher Stiffness of the Neurogenic Niches (A) Schematic drawing of the stiffness measurements on coronal slices (300 μm) with AFM. (B) Stiffness was assessed in the SEZ, the MEZ, the striatum, and the Cx. Both ventricular regions are significantly stiffer than the Cx and the striatum that both have similar tissue stiffness. The SEZ was significantly stiffer than the MEZ. Data shown as whisker plots, p = 0.05 and ∗∗p = 0.01. (C) Representative tissue heatmap of OB measurements with scale bar as indicated. (D) In the OB, the end of the RMS was less stiff in comparison to the adjacent olfactory tract. The granule cell layer (GCL) was even stiffer still, as well as the internal and external plexiform layer (IPL/EPL) and the glomerular layer (GL). Data shown as whisker plots, Mann-Whitney test (two tailed), p = 0.05 and ∗∗∗p = 0.001. (E) Experimental setup for the primary SEZ culture plated on hydrogels with 100- or 200-Pa stiffness. (F) Number of DAPI cells was similar at the end of the 5-day experimental period. (G) Representative images of the Dcx+ cells at 5 days after plating. (H) Hydrogels with 200-Pa stiffness significantly increased the percentage of Dcx+ cells in comparison to the same primary SEZ culture on hydrogels with 100 Pa stiffness. Data are presented as mean ± standard deviation. p = 0.05, paired t test.

Comment in

References

    1. Alonso M., Ortega-Pérez I., Grubb M.S., Bourgeois J.P., Charneau P., Lledo P.M. Turning astrocytes from the rostral migratory stream into neurons: a role for the olfactory sensory organ. J. Neurosci. 2008;28:11089–11102. - PMC - PubMed
    1. Angelidis I., Simon L.M., Fernandez I.E., Strunz M., Mayr C.H., Greiffo F.R., Tsitsiridis G., Ansari M., Graf E., Strom T.M. An atlas of the aging lung mapped by single cell transcriptomics and deep tissue proteomics. Nat. Commun. 2019;10:963. - PMC - PubMed
    1. Barker R.A., Götz M., Parmar M. New approaches for brain repair-from rescue to reprogramming. Nature. 2018;557:329–334. - PubMed
    1. Baser A., Skabkin M., Kleber S., Dang Y., Gülcüler Balta G.S., Kalamakis G., Göpferich M., Ibañez D.C., Schefzik R., Lopez A.S. Onset of differentiation is post-transcriptionally controlled in adult neural stem cells. Nature. 2019;566:100–104. - PubMed
    1. Beckervordersandforth R., Tripathi P., Ninkovic J., Bayam E., Lepier A., Stempfhuber B., Kirchhoff F., Hirrlinger J., Haslinger A., Lie D.C. In vivo fate mapping and expression analysis reveals molecular hallmarks of prospectively isolated adult neural stem cells. Cell Stem Cell. 2010;7:744–758. - PubMed

Publication types

LinkOut - more resources