. 2020 May;158(6):1667-1681.e12.
doi: 10.1053/j.gastro.2020.01.045. Epub 2020 Feb 4.

Gliadin Nanoparticles Induce Immune Tolerance to Gliadin in Mouse Models of Celiac Disease

Affiliations

Gliadin Nanoparticles Induce Immune Tolerance to Gliadin in Mouse Models of Celiac Disease

Tobias L Freitag et al. Gastroenterology. 2020 May.

Abstract

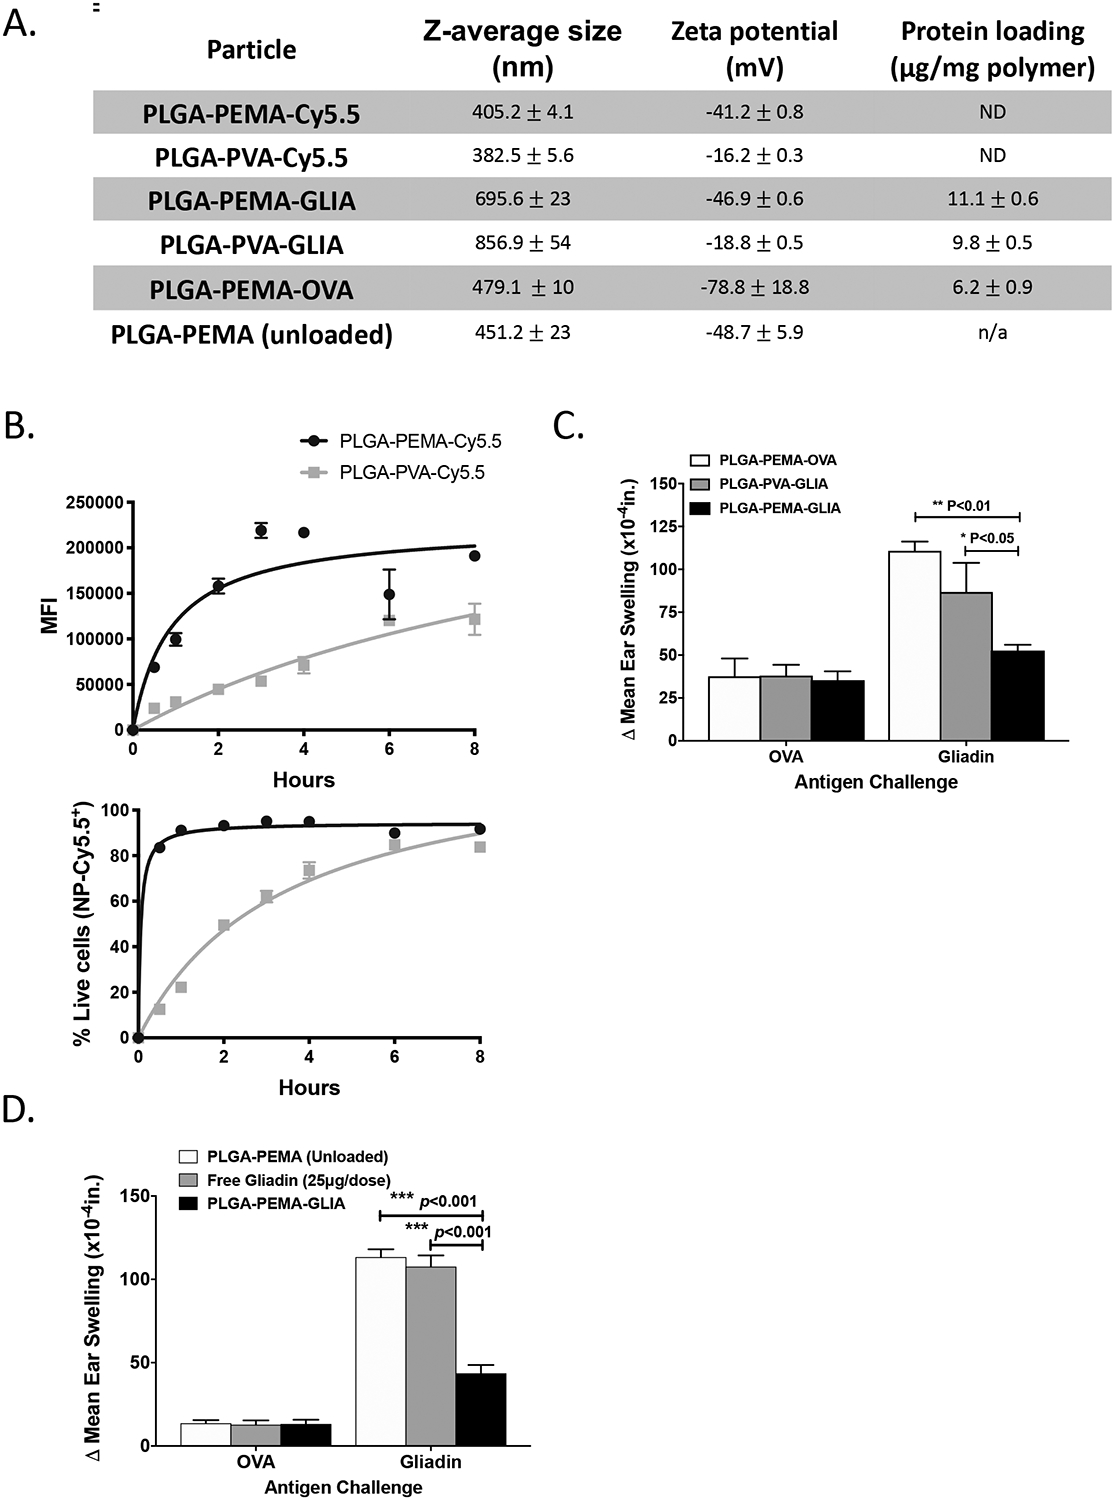
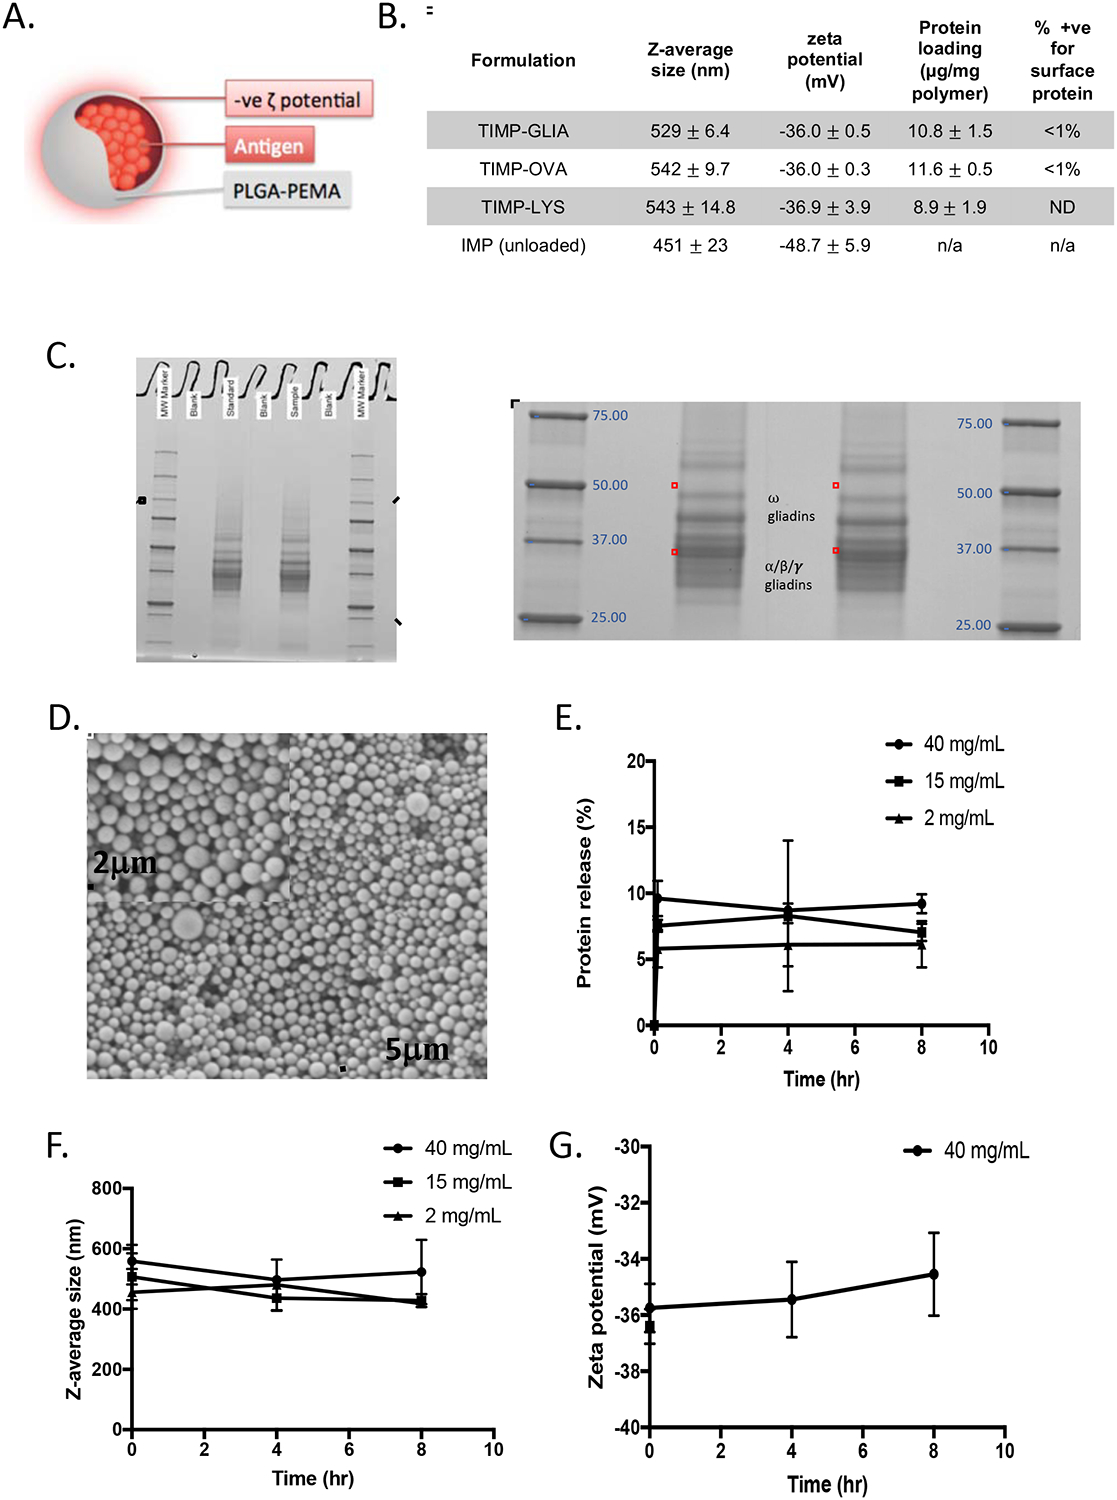
Background & aims: Celiac disease could be treated, and potentially cured, by restoring T-cell tolerance to gliadin. We investigated the safety and efficacy of negatively charged 500-nm poly(lactide-co-glycolide) nanoparticles encapsulating gliadin protein (TIMP-GLIA) in 3 mouse models of celiac disease. Uptake of these nanoparticles by antigen-presenting cells was shown to induce immune tolerance in other animal models of autoimmune disease.

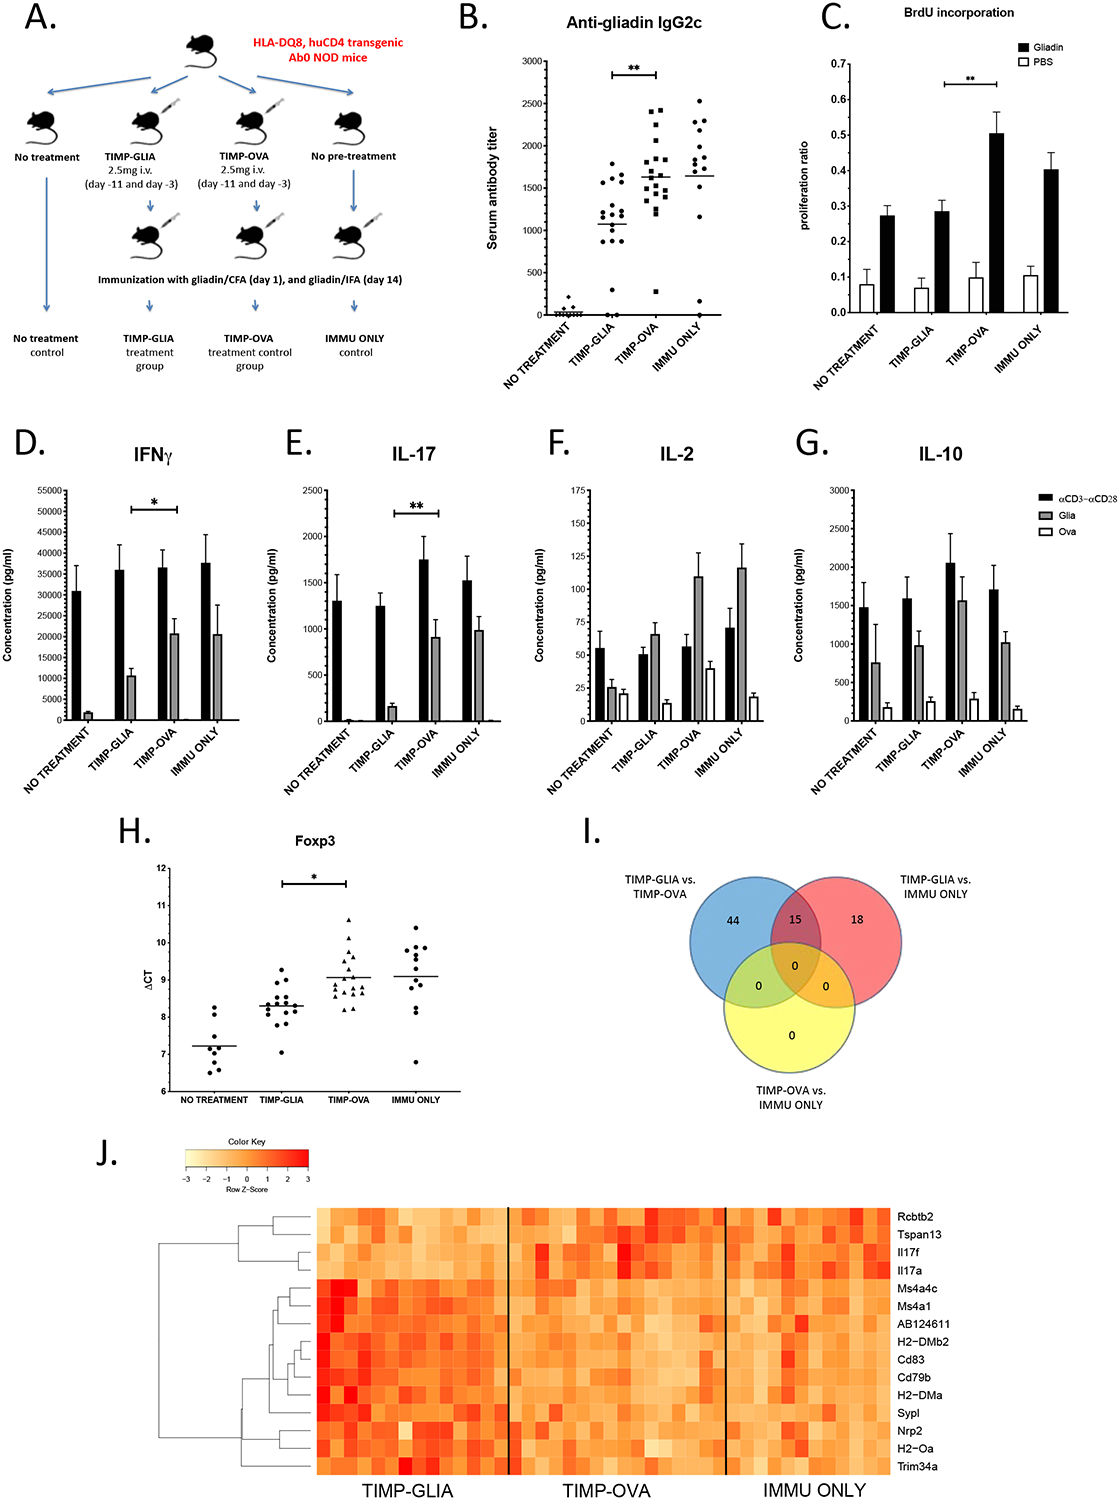
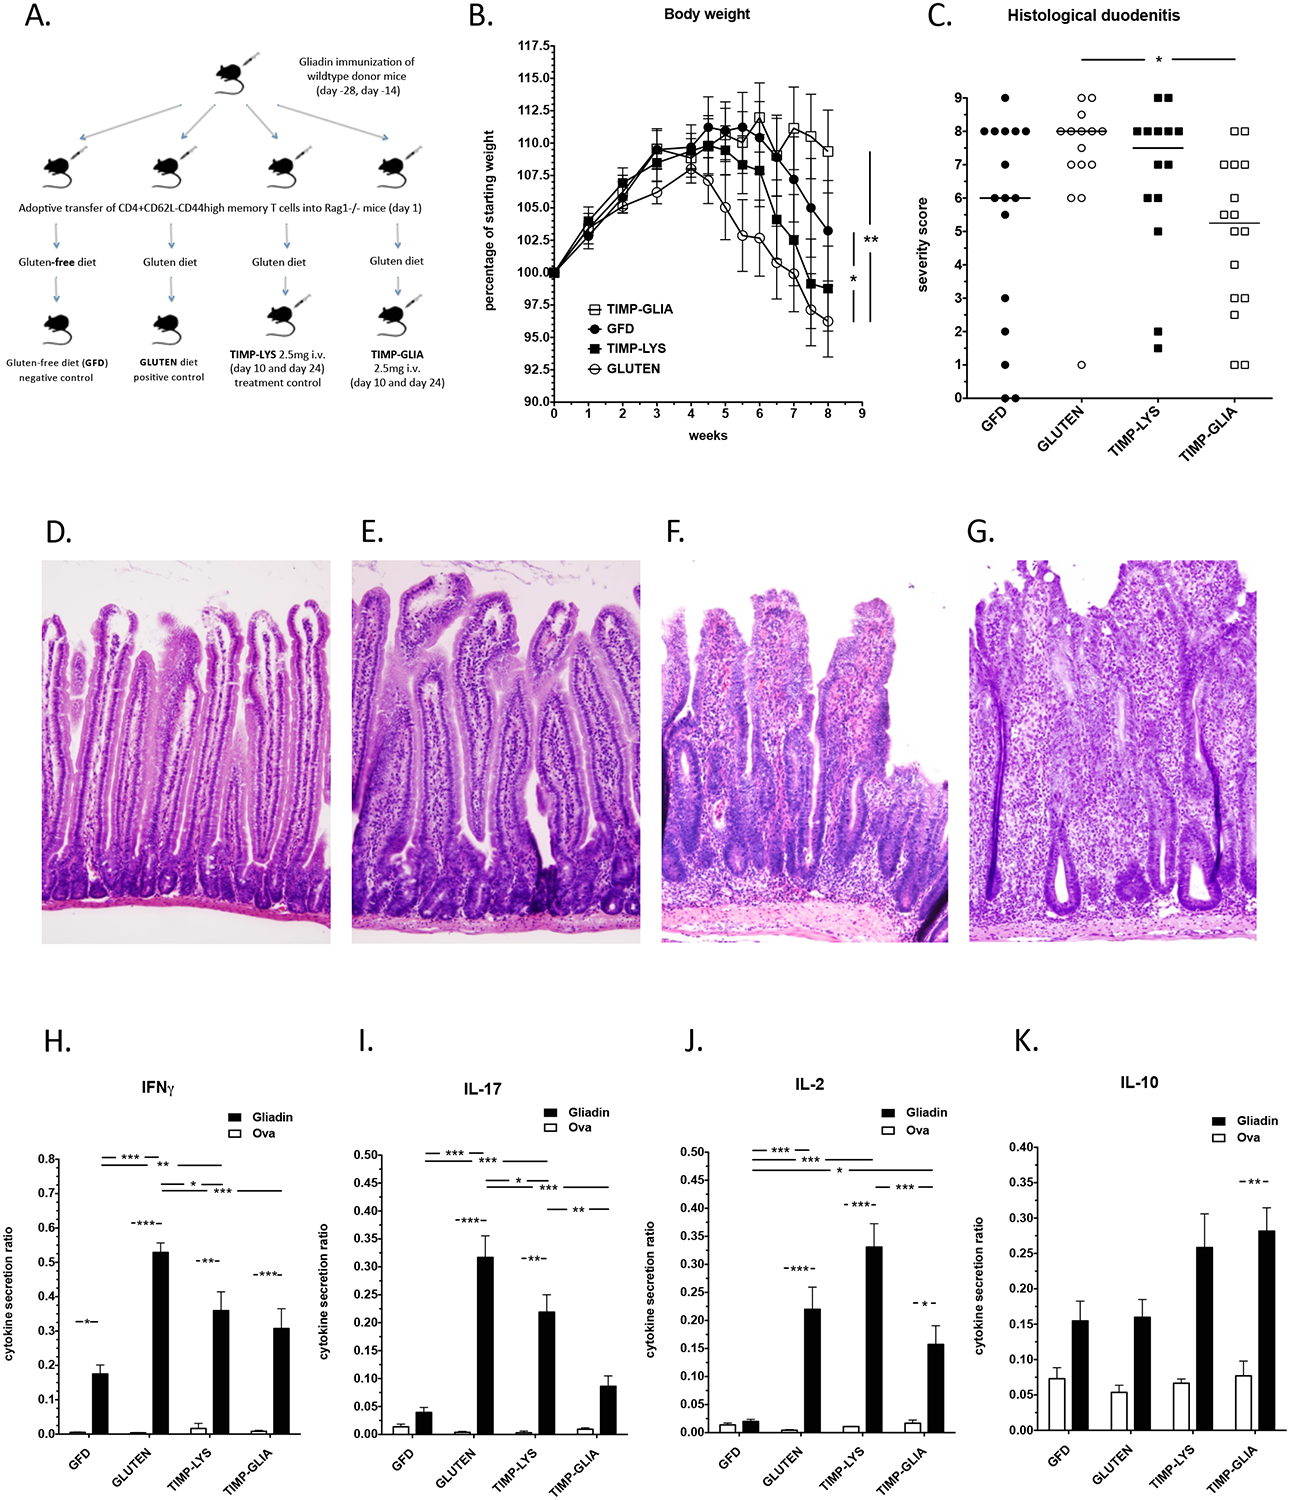
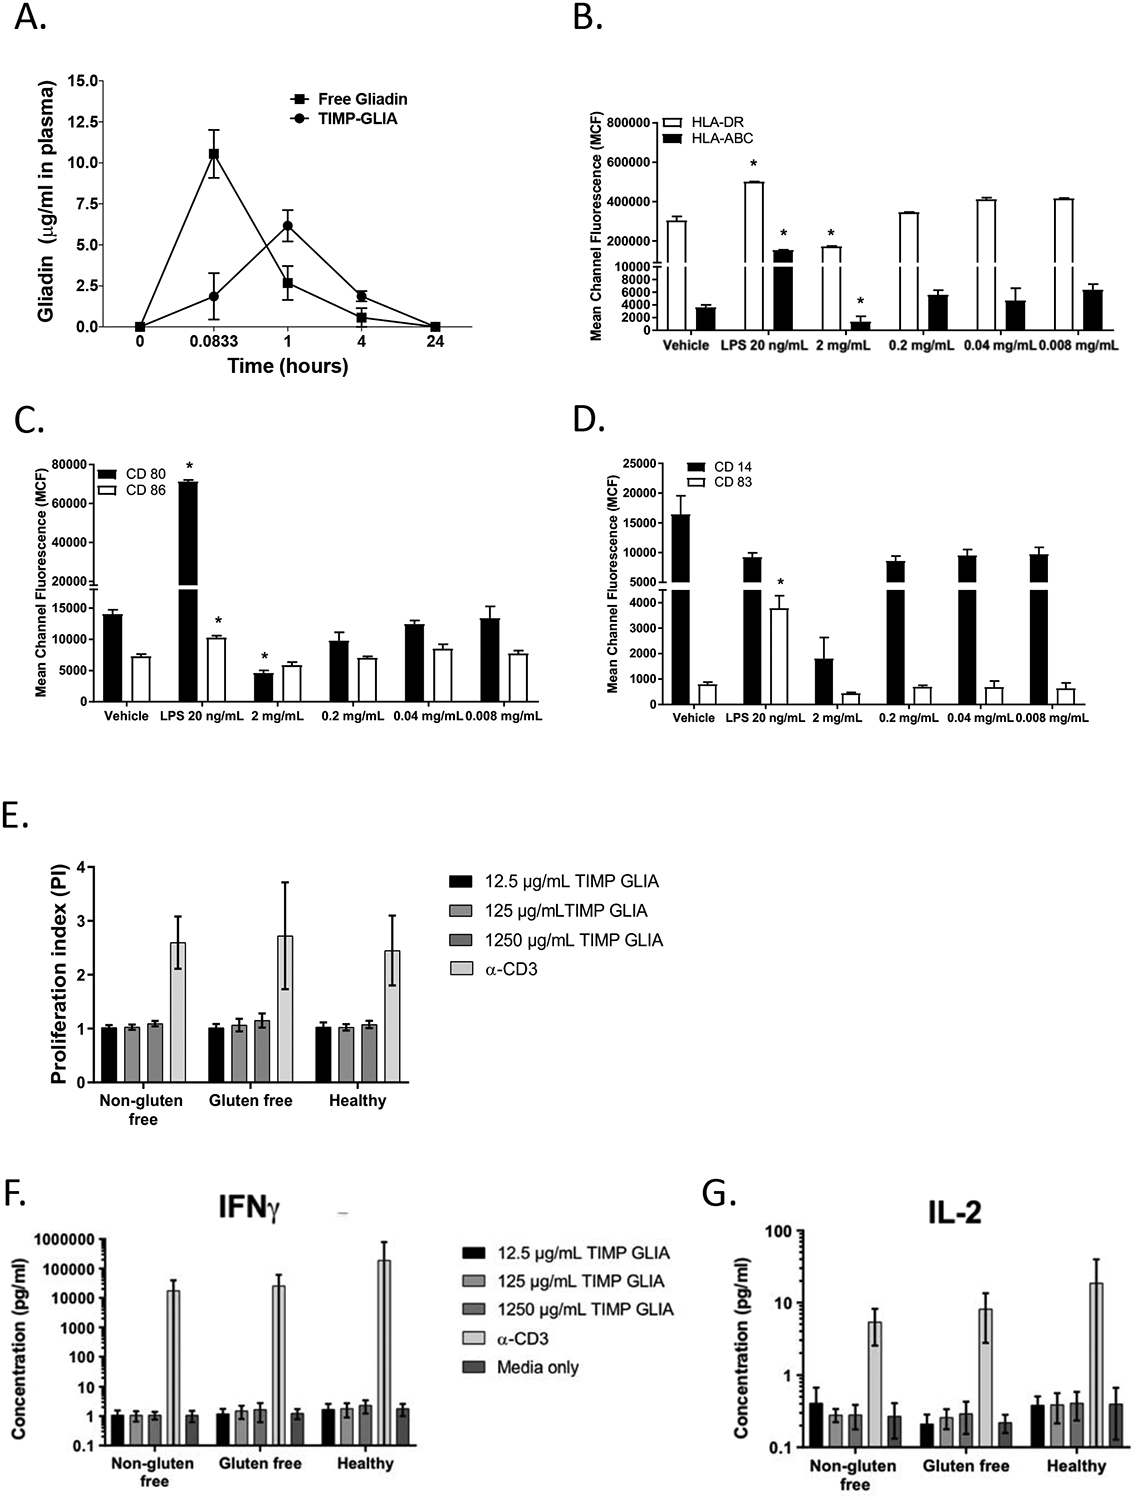
Methods: We performed studies with C57BL/6; RAG1-/- (C57BL/6); and HLA-DQ8, huCD4 transgenic Ab0 NOD mice. Mice were given 1 or 2 tail-vein injections of TIMP-GLIA or control nanoparticles. Some mice were given intradermal injections of gliadin in complete Freund's adjuvant (immunization) or of soluble gliadin or ovalbumin (ear challenge). RAG-/- mice were given intraperitoneal injections of CD4+CD62L-CD44hi T cells from gliadin-immunized C57BL/6 mice and were fed with an AIN-76A-based diet containing wheat gluten (oral challenge) or without gluten. Spleen or lymph node cells were analyzed in proliferation and cytokine secretion assays or by flow cytometry, RNA sequencing, or real-time quantitative polymerase chain reaction. Serum samples were analyzed by gliadin antibody enzyme-linked immunosorbent assay, and intestinal tissues were analyzed by histology. Human peripheral blood mononuclear cells, or immature dendritic cells derived from human peripheral blood mononuclear cells, were cultured in medium containing TIMP-GLIA, anti-CD3 antibody, or lipopolysaccharide (controls) and analyzed in proliferation and cytokine secretion assays or by flow cytometry. Whole blood or plasma from healthy volunteers was incubated with TIMP-GLIA, and hemolysis, platelet activation and aggregation, and complement activation or coagulation were analyzed.

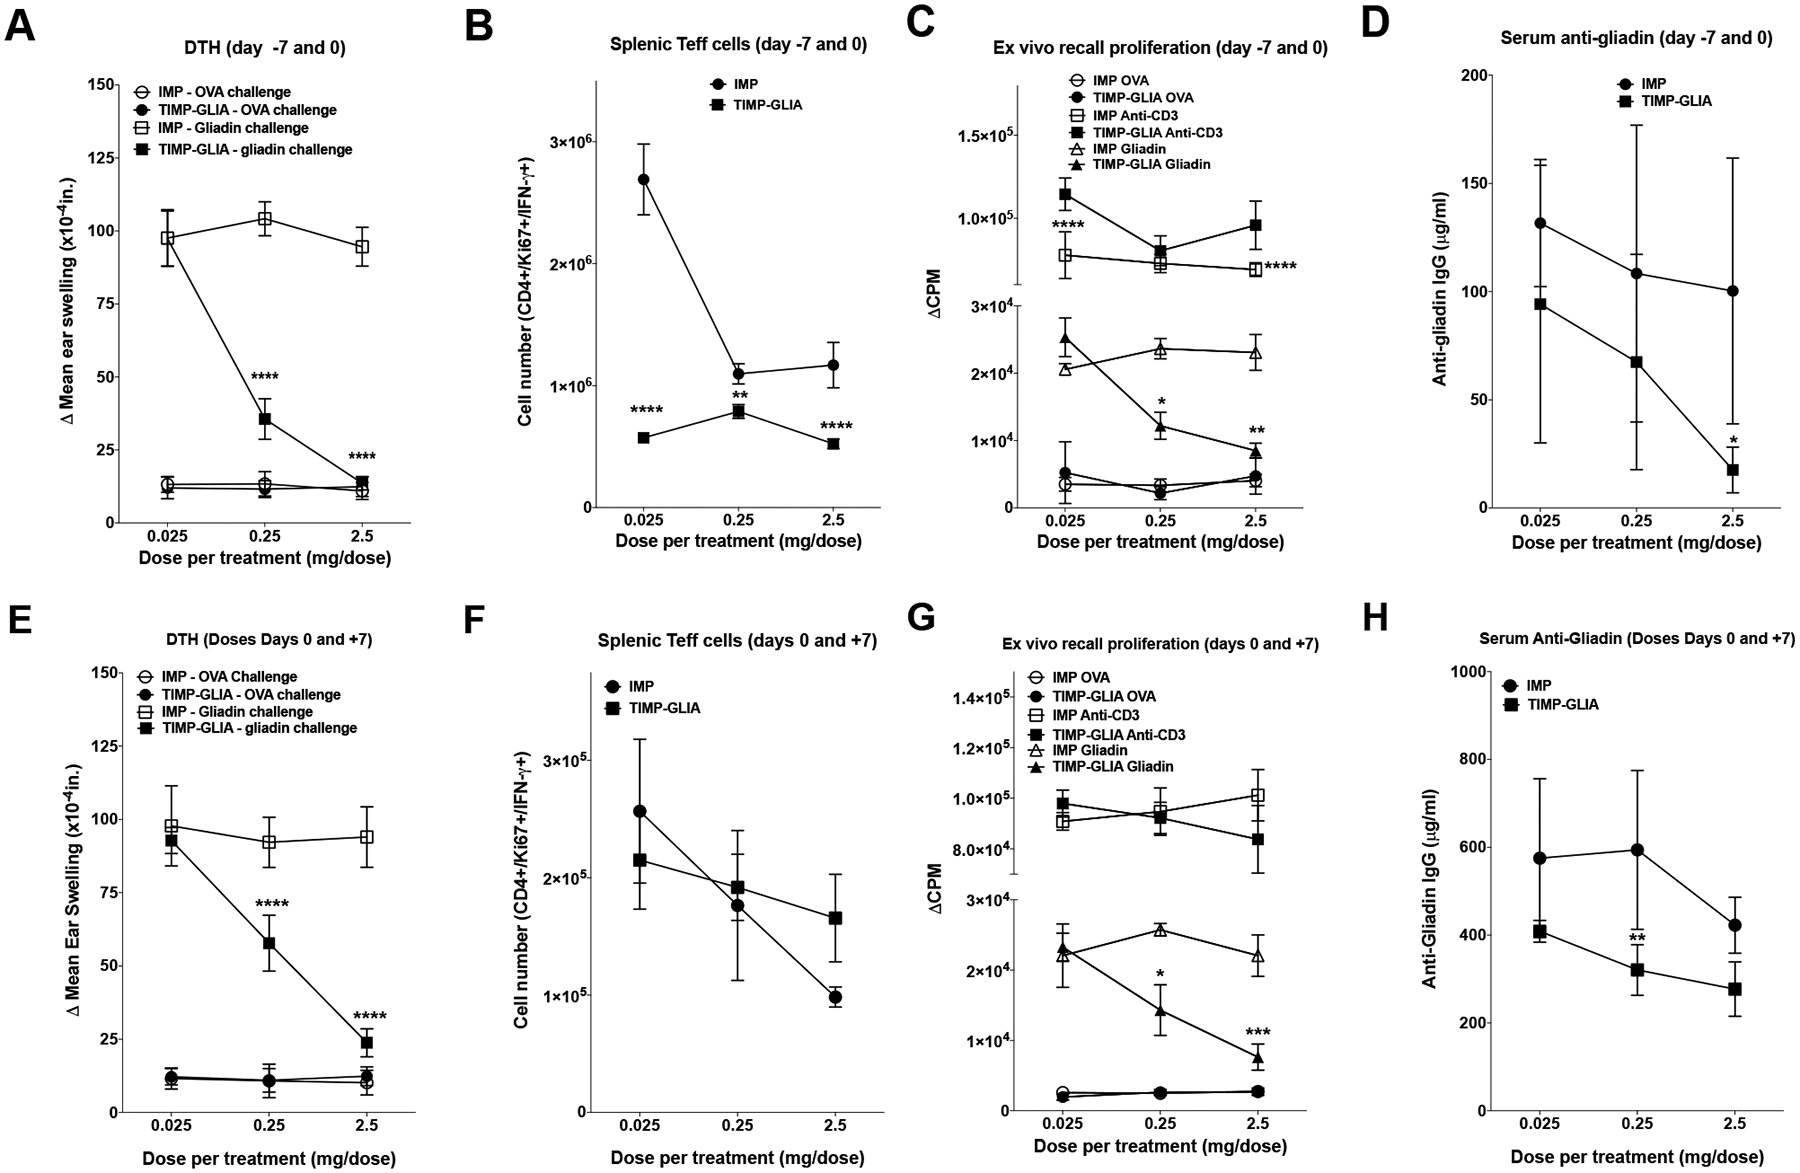
Results: TIMP-GLIA did not increase markers of maturation on cultured human dendritic cells or induce activation of T cells from patients with active or treated celiac disease. In the delayed-type hypersensitivity (model 1), the HLA-DQ8 transgenic (model 2), and the gliadin memory T-cell enteropathy (model 3) models of celiac disease, intravenous injections of TIMP-GLIA significantly decreased gliadin-specific T-cell proliferation (in models 1 and 2), inflammatory cytokine secretion (in models 1, 2, and 3), circulating gliadin-specific IgG/IgG2c (in models 1 and 2), ear swelling (in model 1), gluten-dependent enteropathy (in model 3), and body weight loss (in model 3). In model 1, the effects were shown to be dose dependent. Splenocytes from HLA-DQ8 transgenic mice given TIMP-GLIA nanoparticles, but not control nanoparticles, had increased levels of FOXP3 and gene expression signatures associated with tolerance induction.

Conclusions: In mice with gliadin sensitivity, injection of TIMP-GLIA nanoparticles induced unresponsiveness to gliadin and reduced markers of inflammation and enteropathy. This strategy might be developed for the treatment of celiac disease.

Keywords: Gluten Sensitivity; Immunomodulation; Immunotherapy; Tolerogenic Vaccine.


Figures

Figure 1:
Figure 1:. Development of Tolerogenic Immune-Modifying Nanoparticles encapsulating gliadin (TIMP-GLIA) (I).
A) Six different formulations of nanoparticles were prepared for testing, using either PEMA or PVA as stabilizing surfactant, and encapsulating either Cy5.5 dye, gliadin or ovalbumin (or remaining unloaded). Size, charge and protein loading were measured (mean +/− SD). B) PLGA-PEMA-Cy5.5 or PLGA-PVA-Cy5.5 particles were added to bone marrow-derived macrophage cultures. Cells were analyzed by flow cytometry for mean fluorescence intensity, or for percentage of Cy5.5+/DAPI- live cells (triplicates; mean +/− SD). C) Intravenous treatment effect of PLGA-PEMA-GLIA, PLGA-PVA-GLIA or PLGA-PEMA-OVA in the gliadin DTH mouse model. Ear thickness was measured 24h after injection of either gliadin or ovalbumin (n=5; Δ mean ear thickness +/− SEM; x10−4in). D) Treatment effect of PLGA-PEMA-GLIA, soluble gliadin or PLGA-PEMA (unloaded) in the gliadin DTH mouse model (n=5; Δ mean ear thickness +/− SEM; x10−4in). Statistical analyses were performed using one-way ANOVA and Tukey’s multiple comparison test (C, D; *p≤0.05, **p≤0.01, ***p≤0.001)
Figure 2:
Figure 2:. Development of Tolerogenic Immune-Modifying Nanoparticles encapsulating gliadin (TIMP-GLIA) (II)
. A) Schematic representation of TIMP. B) Four different formulations of PLGA-PEMA nanoparticles were prepared for testing, encapsulating either gliadin (TIMP-GLIA), ovalbumin (TIMP-OVA) or lysozyme (TIMP-LYS), or remaining unloaded (IMP). Size, charge, protein loading (mean +/− SD) and percentage of particles positive for surface protein (FACS) were analyzed. C) SDS-PAGE of gliadin preparation used for production of TIMP-GLIA (duplicates, central rows). D) Scanning electron microscopy of a representative TIMP-GLIA suspension. E-G) Analysis of TIMP-GLIA stability in water over 8h, measuring protein release (E), size (F) and charge (G; triplicates, mean +/− SD).
Figure 3:
Figure 3:. TIMP-GLIA tolerance induction in mice with delayed-type hypersensitivity to gliadin.
A-H) C57BL/6 female mice (n=5) were treated with TIMP-GLIA, or unloaded control particles (IMP), either on days −7 and 0 (A-D), or days 0 and 7 (E-H). Mice were primed with gliadin in CFA on day 0. A, E) On day 14 post priming, mice were injected with gliadin or ovalbumin (OVA) into the ear pinna for DTH analysis (Δ mean ear thickness after 24h +/− SEM; x10−4in). B, F) The numbers of live, CD3+/CD4+/Ki67+/IFNG+ splenic effector T cells were determined (Teffs; mean +/− SEM; flow cytometry). C, G) To assess proliferation, spleen cells were stimulated with anti-CD3, OVA, or gliadin (mean counts per minute +/− SEM; 3H-TdR incorporation). D, H) Serum anti-gliadin IgG antibody levels were analyzed, testing serial dilutions (mean concentration +/− SEM; ELISA). Statistical analyses were performed using one-way ANOVA and Tukey’s multiple comparison test (A-H; *p≤0.05, **p≤0.01, ***p≤0.001, ****p≤0.0001).
Figure 4.
Figure 4.. TIMP-GLIA tolerance induction in transgenic mice expressing celiac disease-associated HLA-DQ8.
A) Experimental design. B) Serum anti-gliadin IgG2c antibody titers in groups of HLA-DQ8 mice, treated according to A (n=11–19; ELISA). C) Proliferation of spleen cells (n=8–9; BrdU ELISA). Data expressed as proliferation ratios, relating to anti-CD3/anti-CD28 positive control. D-G) IFNG, IL17, IL2 and IL10 cytokine concentrations in supernatants of spleen cells stimulated with gliadin, ovalbumin (negative control) or anti-CD3/anti-CD28 (positive control; n=11–19; ELISA). H) Foxp3 mRNA expression by spleen cells in response to gliadin restimulation (n=9–18; RT-qPCR). Results expressed in ΔCT values (reductions of ΔCT reflect increases in Foxp3 mRNA expression). I) Venn diagram depicting the numbers of genes differentially expressed in spleen cells restimulated with gliadin, in 3 separate comparisons between 3 groups of HLA-DQ8 mice (n=13–16; RNAseq). J) Heat map depicting the up- (red) or down-regulation (yellow) of 15 genes differentially expressed after treatment with TIMP-GLIA (n=13–16, adjusted p-value p≤0.05; RNAseq). Statistical analyses were performed using one-way ANOVA and Tukey’s multiple comparison test (B, H), t-tests corrected for multiple testing using the Holm-Sidak method (C-G) or edgeR (I, J). In plots B-H, significant results are indicated for comparisons between TIMP-GLIA and TIMP-OVA groups only (*p≤0.05, **p≤0.01).
Figure 5.
Figure 5.. TIMP-GLIA tolerance induction reverses gliadin memory T cell enteropathy in mice.
A) Experimental design. B) Total body weight development in four groups of Rag1−/− mice, treated according to A (n=14–16; data expressed as percentage of starting weight). C) Histological duodenitis severity scores (n=14–16; max. score 9). D-G) Hematoxylin/eosin staining of duodenal sections. Examples represent histological scores of D) 0 (normal), E) 3 (mild), F) 6 (moderate), or G) 9 (severe) duodenitis. Note increased villus and basal mononuclear cell infiltration, reduced villus-to-crypt ratios, and development of crypt abscesses with increasing scores. H-K). IFNG, IL17, IL2 and IL10 cytokine secretion in response to gliadin, or ovalbumin (Ova, negative control), in relation to anti-CD3/anti-CD28 antibody (positive control; n=9–12; ELISA; data expressed as cytokine secretion ratios). Statistical analyses were performed using one-way ANOVA and Tukey’s multiple comparison test (*p≤0.05, **p≤0.01, ***p≤0.001).
Figure 6.
Figure 6.. TIMP-GLIA clearance, and interaction with human peripheral blood mononuclear cells (PBMC).
A) Naïve C57BL/6 mice (n=3 per time point) were injected intravenously with either 2.5mg of TIMP-GLIA, or 40ug of free gliadin (corresponding amount). Mice were bled at 5min, 1h, 4h, and 24h. Collected plasma samples were assessed for the level of free gliadin (ELISA; mean concentration +/− SEM). B-D) Immature dendritic cells derived from human PBMC (n=6–9) were treated with vehicle (PBS), LPS 20 ng/mL (positive control) or TIMP-GLIA at increasing concentrations for 48 hours. Surface expression of HLA-ABC and HLA-DR (B), CD80 and CD86 (C) and CD14 and CD83 (D) were determined by flow cytometry (mean channel fluorescence; mean ± SD). E-G) Human PBMC from celiac disease patients on normal or gluten free diet, or healthy controls, were stimulated with anti-CD3 antibody (positive control) or TIMP-GLIA at increasing concentrations (triplicates; n=9–11). Proliferation (E), and IFNG (F) or IL2 (G) cytokine secretion were measured after 72h. Data is expressed as proliferation index (relating to unstimulated cells; luminescent cell viability assay), or cytokine concentrations (V-Plex assay). Statistical analyses were performed using paired t-test, compared to vehicle group (B-D; *p≤0.05).

References

    1. Lebwohl B, Sanders DS, Green PHR Coeliac disease. Lancet 391, 70–81 (2018). - PubMed
    1. Nilsen EM, Jahnsen FL, Lundin KE et al. Gluten induces an intestinal cytokine response strongly dominated by interferon gamma in patients with celiac disease. Gastroenterology 115, 551–63 (1998). - PubMed
    1. Anderson RP, Jabri B Vaccine against autoimmune disease: antigen-specific immunotherapy. Curr. Opin. Immunol 25, 410–7 (2013). - PMC - PubMed
    1. Pearson RM, Casey LM, Hughes KR et al. Controlled delivery of single or multiple antigens in tolerogenic nanoparticles using peptide-polymer bioconjugates. Mol. Ther 25, 1655–1664 (2017). - PMC - PubMed
    1. Hlavaty KA, McCarthy DP, Saito E et al. Tolerance induction using nanoparticles bearing HY peptides in bone marrow transplantation. Biomaterials 76, 1–10 (2016). - PMC - PubMed

Publication types

MeSH terms