. 2020 May:69:109552.
doi: 10.1016/j.cellsig.2020.109552. Epub 2020 Feb 4.

Synergistic activation of p53 by actinomycin D and nutlin-3a is associated with the upregulation of crucial regulators and effectors of innate immunity

Affiliations

Synergistic activation of p53 by actinomycin D and nutlin-3a is associated with the upregulation of crucial regulators and effectors of innate immunity

Małgorzata Krześniak et al. Cell Signal. 2020 May.

Abstract

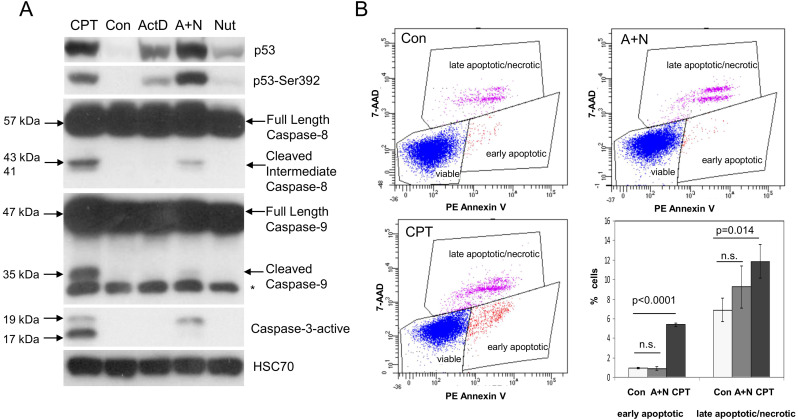
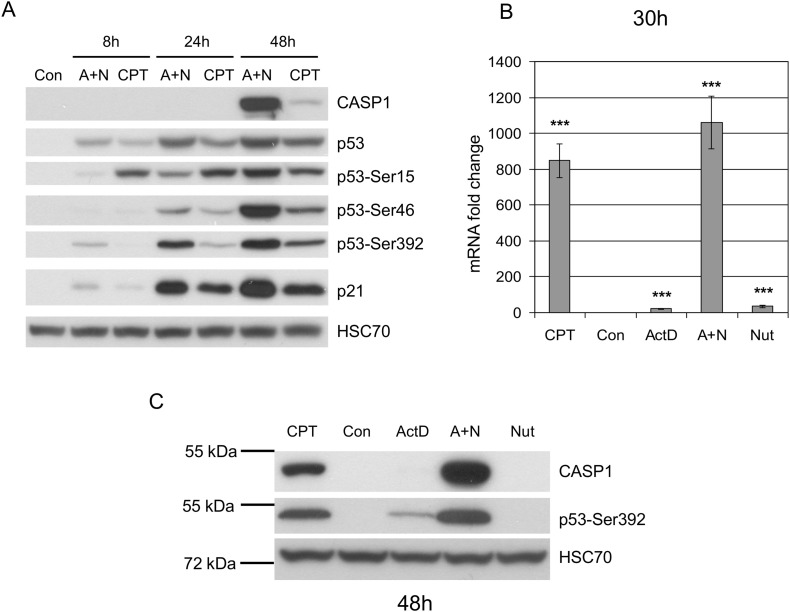
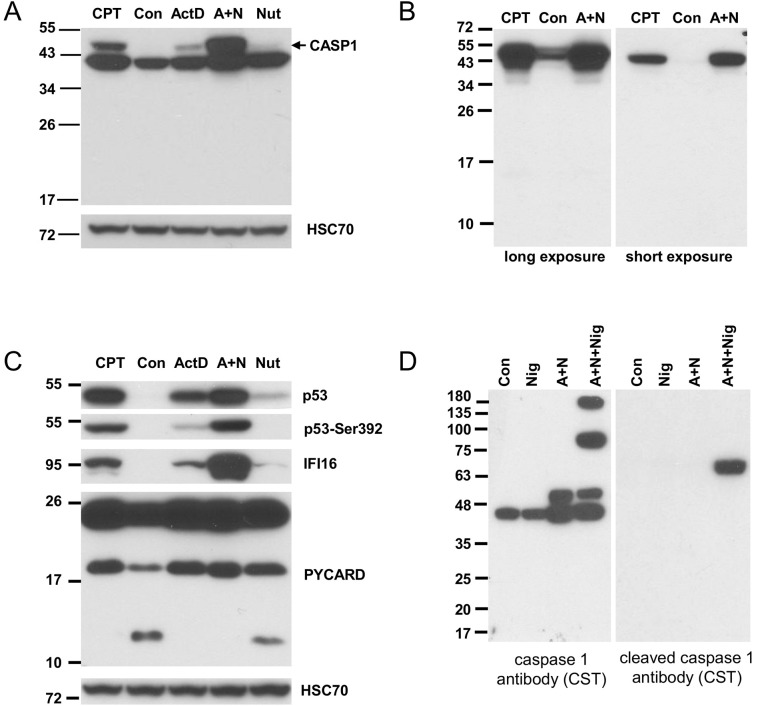
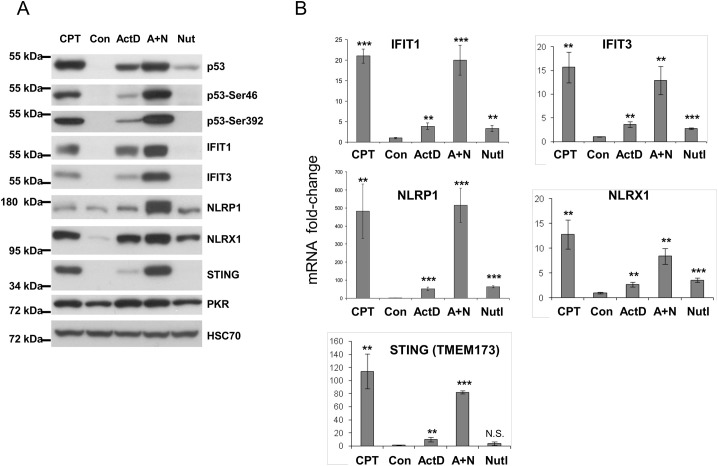
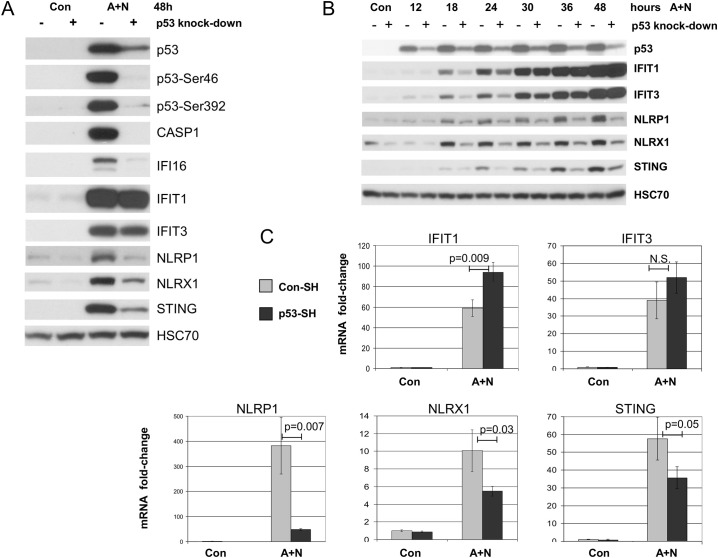
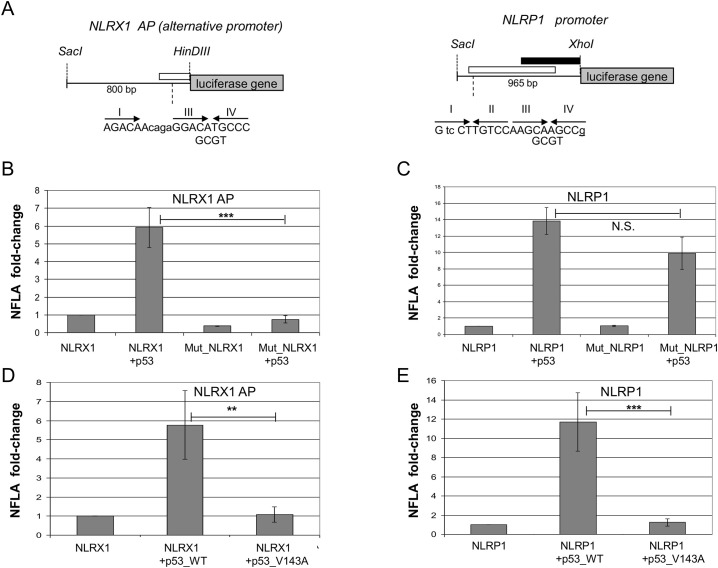
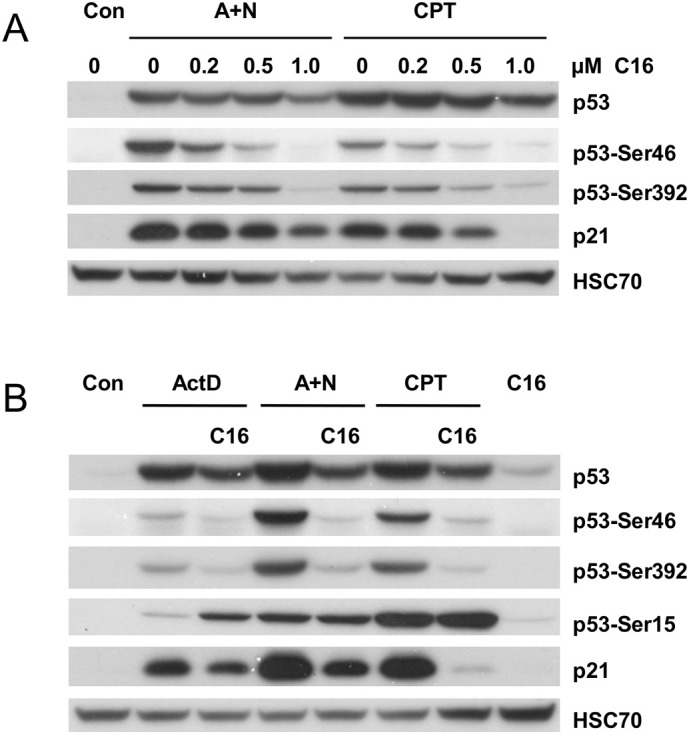
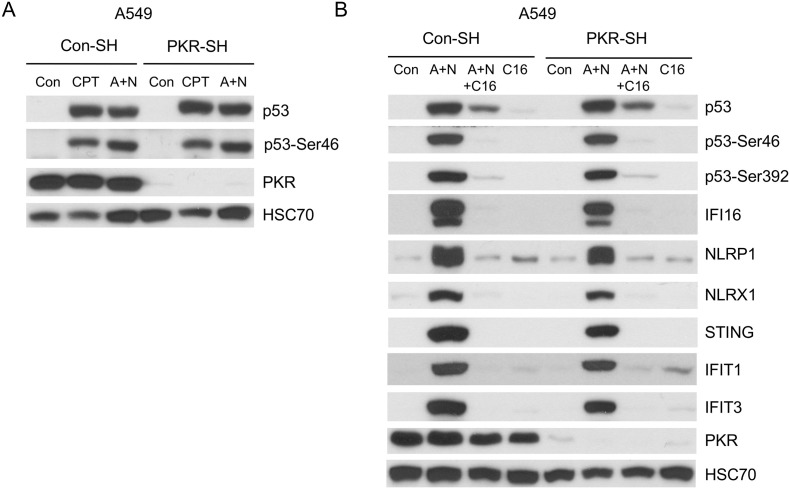
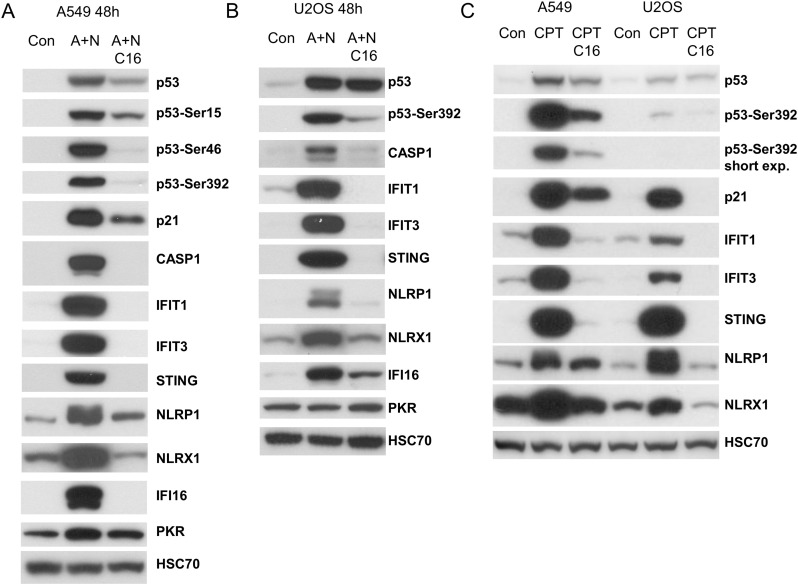
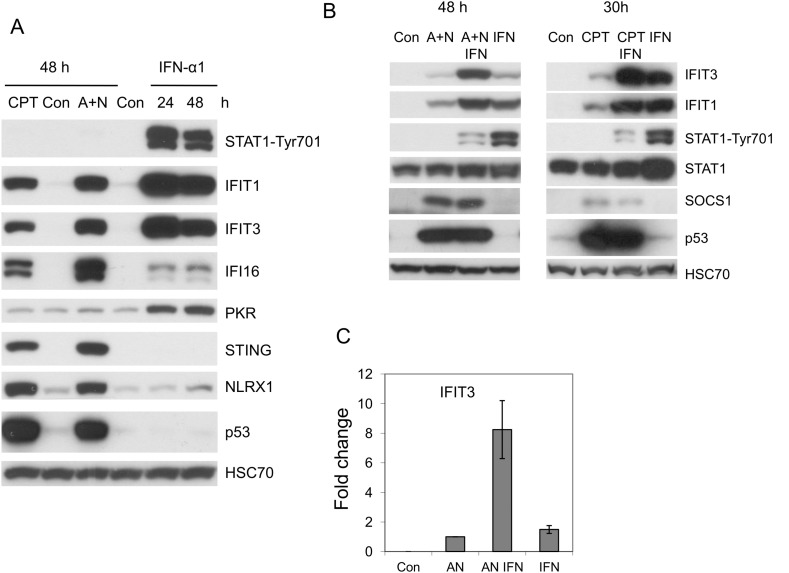
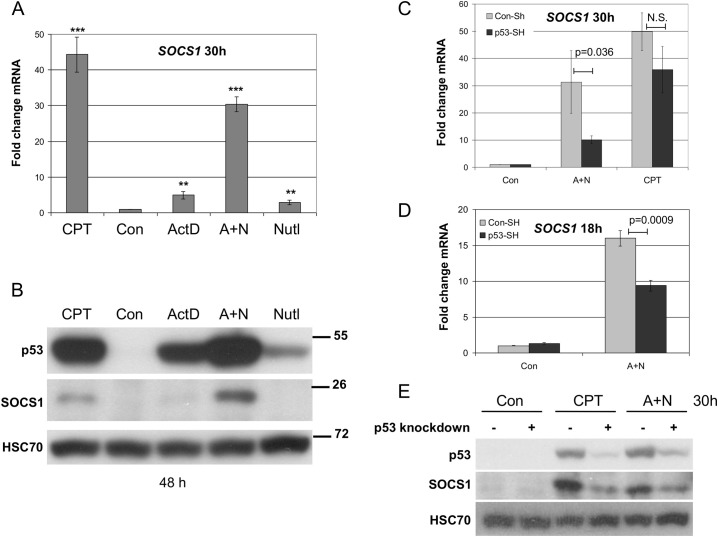
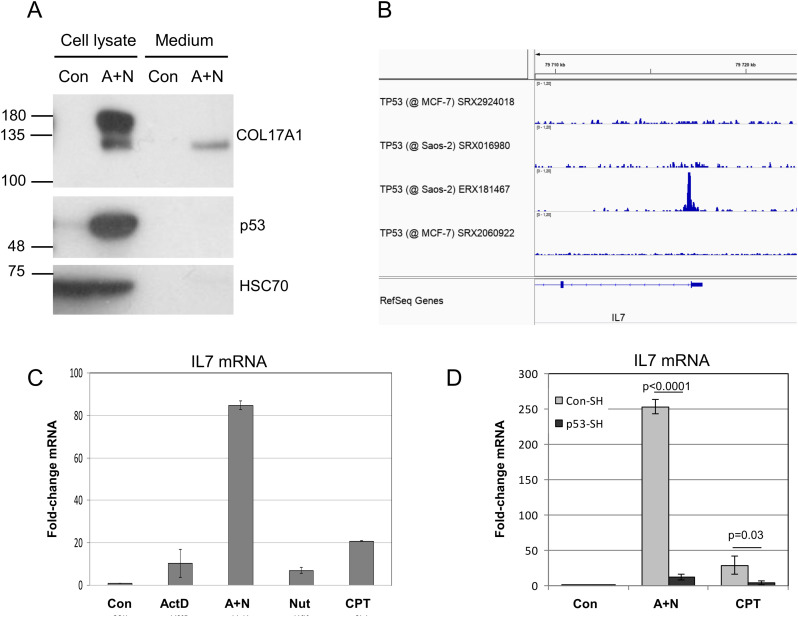
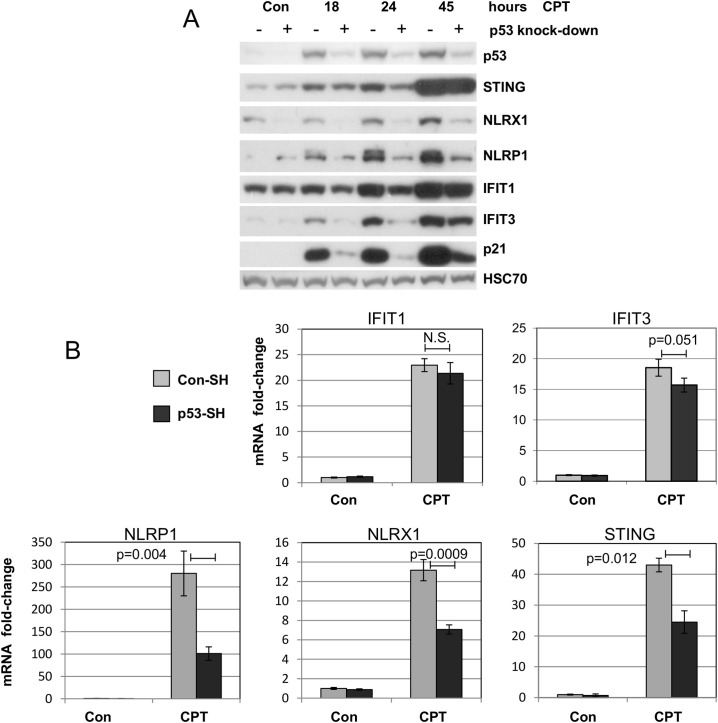
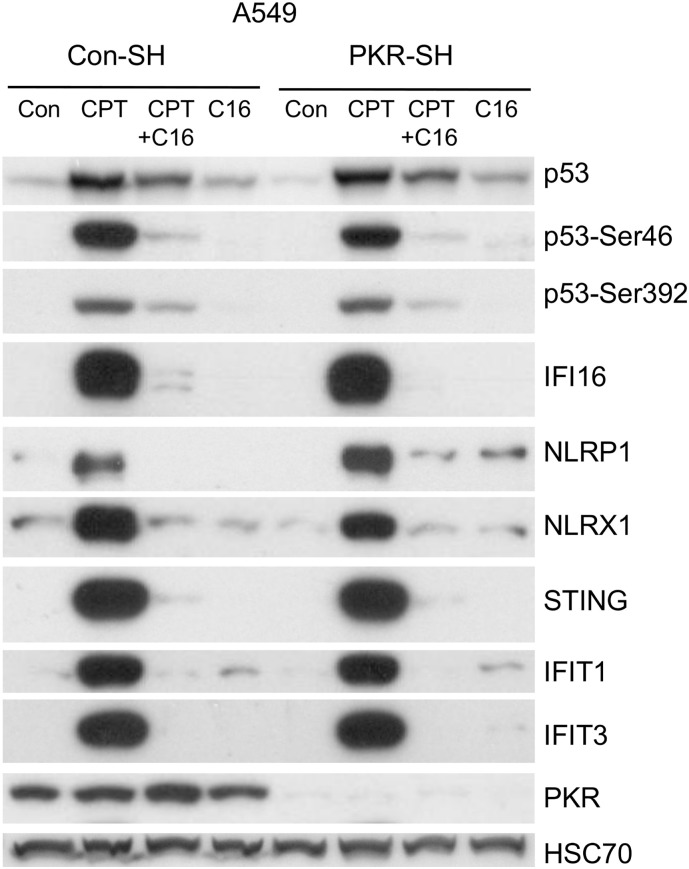
Actinomycin D and nutlin-3a (A + N) activate p53, partly through induction of phosphorylation on Ser392. The death of A549 cells induced by A + N morphologically resembles inflammation-inducing pyroptosis - cell destruction triggered by activated caspase-1. The treatment with A + N (or camptothecin) strongly upregulated caspase-1 and its two activators: IFI16 and NLRP1, however, caspase-1 activation was not detected. A549 cells may have been primed for pyroptosis, with the absence of a crucial trigger. The investigation of additional innate immunity elements revealed that A + N (or camptothecin) stimulated the expression of NLRX1, STING (stimulator of interferon genes) and two antiviral proteins, IFIT1 and IFIT3. IFI16 and caspase-1 are coded by p53-regulated genes which led us to investigate regulation of NLRP1, NLRX1, STING, IFIT1 and IFIT3 in p53-dependent mode. The upregulation of NLRP1, NLRX1 and STING was attenuated in p53 knockdown cells. The upsurge of the examined genes, and activation of p53, was inhibited by C16, an inhibitor of PKR kinase. PKR was tested due to its ability to phosphorylate p53 on Ser392. Surprisingly, C16 was active even in PKR knockdown cells. The ability of C16 to prevent activation of p53 and expression of innate immunity genes may be the source of its strong anti-inflammatory action. Moreover, cells exposed to A + N can influence neighboring cells in paracrine fashion, for instance, they shed ectodomain of COL17A1 protein and induce, in p53-dependent mode, the expression of gene for interleukin-7. Further, the activation of p53 also spurred the expression of SOCS1, an inhibitor of interferon triggered STAT1-dependent signaling. We conclude that, stimulation of p53 primes cells for the production of interferons (through upregulation of STING), and may activate negative-feedback within this signaling system by enhancing the production of SOCS1.

Keywords: IL7; Inflammation; Innate immunity; Interferon; Pyroptosis; p53.


Conflict of interest statement

Declaration of Competing Interest The authors declare no conflict of interest.

Figures

Fig. 1
Fig. 1
Treatment with A + N does not induce extensive apoptosis of A549 cells. A. Western blot showing expression of indicated proteins in A549 cells mock-treated (Con) or incubated for 48 h with actinomycin D (ActD), nutlin-3a (Nut), both substances A + N, or CPT (* - protein unspecifically detected by ani-Caspase-9 antibody). B. Cytometric analysis of cell populations mock-treated (Con) or exposed to CPT or A + N for 48 h. Viable cells are 7-AAD (7-Amino-Actinomycin) and PE Annexin V negative, cells in early apoptosis are PE Annexin V positive and 7-AAD negative, whereas late apoptotic or dead cells are both PE Annexin V and 7-AAD positive. The graph shows the frequency of indicated cell types calculated from three biological repeats (p values were calculated by Student's t-test; n.s. - non significant).
Fig. 2
Fig. 2
Synergy between actinomycin D and nutlin-3a induces pro-caspase-1 (CASP1) expression. A. Levels of pro-caspase-1 (CASP1), p53, phospho-p53, p21, and loading control (HSC70) in A549 cells treated with A + N or CPT for indicated time. Con - mock-treated control. B. Changes in the levels of CASP1 mRNA, measured by semi-quantitative real-time PCR of RNA samples isolated from mock-treated A549 cells (Con) or from cells incubated for 30 h with actinomycin D (ActD), nutlin-3a (Nut), both substances A + N, or CPT. The mRNA level in the mock-treated population was defined as 1. Results represent mean and standard deviations from three biological replicates, *** p < .001 by two-tailed Student's t-test, treatment versus control. C. Levels in whole-cell lysates of pro-caspase-1 protein, p53 phosphorylated on Ser392 and loading control (HSC70). A549 cells were treated as in A for 48 h. The location of molecular weight markers is indicated.
Fig. 3
Fig. 3
The activation of pro-caspase-1 by proteolytic digestion is not detected in cells treated with actinomycin D & nutlin-3a (A + N) combination or those treated with camptothecin (CPT). A. Expression of pro-caspase-1 detected in A549 cells treated, as indicated, for 48 h. Protein was detected using the D7F10 antibody from Cell Signaling Technology. The arrow shows pro-caspase-1. The lower band is apparently off-target protein. B. The expression of pro-caspase-1 in A549 cells treated, as indicated, for 48 h. This blot was incubated with ab179515 antibody from Abcam. Both panels are results of different exposures of the same blot. This antibody is able to recognize the small subunit (p10) of active form of the enzyme. C. Expression level in whole-cell lysates of total p53, its form phosphorylated on Ser392 and the expression of IFI16 and PYCARD proteins involved in formation of inflammasomes. The PYCARD protein, known also as ASC, has four splicing isoforms, three of them can be detected by antibody used in this study, which detects epitope near carboxyl terminus of protein. Two upper bands of PYCARD (approximately 19 and 22 kDa) are activating inflammasome adaptors, while the bottom band is an inhibitory adaptor (it lacks PYRIN domain). D. Western blots on protein lysates from A549 cells: Con - mock-treated, Nig - exposed to 15 μM nigericin for 70 min, A + N - exposed to actinomycin D and nutlin-3a for 49 h and for 70 min with fresh medium, A + N + Nig - exposed to actinomycin D and nutlin-3a for 49 h and subsequently to nigericin (15 μM) for 70 min. The blot was probed with anti-cleaved Caspase-1 (Asp297) rabbit monoclonal antibody (D57A2) from Cell Signaling Technology (CST). The blot on the left was probed with anti-caspase-1 antibody (D7F10) from CST.
Fig. 4
Fig. 4
Actinomycin D and nutlin-3a synergistically activate a subset of genes involved in innate immunity. A. Expression level in whole-cell lysates of p53 (total and phosphorylated) and the expression of IFIT1, IFIT3, NLRP1, NLRX1, STING (TMEM173) and PKR proteins. A549 cells were exposed as indicated for 48 h. B. Changes in the levels of IFIT1, IFIT3, NLRP1, NLRX1 and STING mRNA, measured by semi-quantitative real-time PCR of samples isolated from mock-treated A549 cells (Con) or from cells incubated for 30 h as indicated. The mRNA level in the mock-treated population was defined as 1. Results represent means and standard deviations from three biological replicates, *** p < .001, ** p < .01 by two-tailed Student's t-test, treatment versus control (N.S. non significant).
Fig. 5
Fig. 5
Innate immunity associated genes are upregulated in a p53-dependent manner following combination actinomycin D and nutlin-3a treatment. A. Western blot showing expression of indicated proteins in A549 cells with knocked-down expression of p53 (+). These cells (+) or the controls (−) for knock-down were mock-treated (Con) or exposed to actinomycin D and nutlin-3a (A + N) for 48 h. B. The control (−) or p53 knocked-down (+) A549 cells were treated with A + N and examined by Western blotting. “Con” cells were mock-treated. C. The expression of mRNA for indicated proteins determined by semi-quantitative RT-PCR in mock-treated control cells (Con) or the cells exposed to A + N for 30 h. The A549 cells with knocked-down p53 are marked as “p53-SH”, whereas the controls for knock-down are “Con-SH”. The results represent mean and standard deviation from three biological replicates, p values were calculated by two-tailed Student's t-test (N.S. non significant).
Fig. 6
Fig. 6
NLRX1 and NLRP1 promoters contain a p53 response element (RE). A. The arrows and Roman numerals mark the quarter-sites of p53 RE. The nucleotides, which do not match the consensus quarter-site are marked by small-case letters. The location of p53 ChIP-Seq peaks reported by others [32] is marked by open rectangles. The NLRP1 promoter fragment forming G4 quadruplex [32 and refs therein] is marked by black rectangle. B. & C. The fold change of the normalized firefly luciferase activity (NFLA) in U-2 OS cells transfected with a p53 expression vector and the reporter vector coding for firefly luciferase under the transcriptional control of promoters cloned from the NLRX1 or NLRP1 genes (presented on panel A). “Mut” prefix indicates the promoter version with the mutated p53 site as indicated on panels A. D. & E. The fold change of NFLA after co-transfection of the wild-type promoter reporter plasmids with expression vectors coding for either wild-type p53 or V143A mutant. The mean and standard deviation from three biological replicates performed in triplicate are presented, *** p < .001, ** p < .01 by two-tailed Student's t-test.
Fig. 7
Fig. 7
C16 treatment attenuates phosphorylation of p53 on Ser46 and Ser392. A. The level of p53, its two phosphorylated forms and the expression of p21 (coded by p53 target) in A549 cells exposed for 30 h to either A + N or CPT alone or in combination with C16 at indicated concentrations. B. The Western blot showing expression of p53 and its phosphorylated forms in A549 cells exposed for 30 h to actinomycin D (ActD) actinomycin D and nutlin-3a (A + N) or to camptothecin (CPT). Some cells were also exposed to C16 used at 1 μM concentration.
Fig. 8
Fig. 8
C16 treatment inhibits activation of the p53 pathway in a PKR kinase-independent fashion. A. The expression of p53 and its phosphorylated form in A549 cells with knocked-down expression of PKR and in controls for knockdown exposed to A + N or CPT for 48 h. B. The expression of indicated proteins in cells with knocked-down expression of PKR and in controls for knockdown exposed to A + N and/or C16 (1 μM) for 48 h.
Fig. 9
Fig. 9
Upregulation of innate immunity associated genes by A + N (or by camptothecin) is blocked by C16 treatment in A549 and U-2 OS cell lines. A549 (A) or U-2 OS (B) cells were exposed to A + N or A + N and C16 (1 μM) for 48 h. Control cells were mock-treated (Con). (C) Similar experiment was performed using camptothecin (CPT) as a stress factor. The cells were exposed for 41 h. The indicated proteins or their modified forms were subsequently detected by Western blotting.
Fig. 10
Fig. 10
Upregulation of innate immunity associated genes by A + N or camptothecin does not involve activation of STAT1. A. A549 cells were mock-treated (Con) or exposed either to A + N or to camptothecin (CPT) for 48 h. Other cells were exposed to recombinant human interferon-α1 (IFN-α1) at 2 ng/ml for 24 or 48 h. Subsequently, the expression of indicated proteins was examined by Western blotting. One of the antibodies detects activated STAT1 transcription factor with phosphorylated tyrosine 701 (STAT1-Tyr701). B. A549 cells were exposed to A + N (or CPT), IFN-α1 (IFN, 1 ng/ml) or to both treatment modalities simultaneously. The expression of IFIT3, IFIT1, SOCS1, STAT1 (total or phosphorylated) and p53 was examined by Western blotting. C. Quantitative Western blot analysis of IFIT3 in A549 cells exposed as indicated. The means and standard deviation were calculated from Western blots of protein lysates prepared from three biological replicates. Because IFIT3 was undetectable in control cells, its expression was set as 1 in cells exposed to A + N.
Fig. 11
Fig. 11
SOCS1 gene expression is upregulated in a p53-dependent manner. A. Measurement of relative SOCS1 mRNA levels in A549 cells exposed to indicated substances or combination treatments for 30 h: CPT - camptothecin, Con - mock-treated control, ActD - actinomycin D, A + N, and Nut - nutlin-3a, *** p < .001, ** p < .01 by Student's t-test. B. Protein expression in A549 cells exposed to indicated substances or their combinations for 48 h. C. D. Relative SOCS1 mRNA levels in p53 knockdown A549 cells (p53-SH), and control cells (Con-SH), exposed to A + N or CPT for 30 (C) or 18 (D) hours. The results represent mean and standard deviation from three independent experiments, p values calculated by Student's t-test E. Expression of indicated proteins in p53 knockdown A549 cells (+), or control cells (−), exposed to CPT or A + N for 30 h.
Fig. 12
Fig. 12
Exposure to A + N upregulates expression of genes coding for secreted proteins. A. The expression of COL17A1 protein (180 kDa whole-length molecule and 120 kDa ectodomain) in cell lysates and in concentrated medium of A549 cells exposed for 48 h to A + N (24 h in complete medium +24 h in serum-free medium). B. Genome browser (IGV) views of p53 binding peak at the exon1/intron1 border of IL7 gene. Using ChIP-Atlas tool [33] we imported publically available coverage tracks from four ChIP-Seq experiments aimed at finding p53 binding sites in MCF-7 cell line exposed to ionizing radiation and Nutlin (sample ID SRX2924018), SAOS-2 cell line ectopically expressing wild-type p53 (sample ID SRX016980), SAOS-2 ectopically expressing pair of engineered p53 molecules with strong cooperative binding of p53 monomers [31] (sample ID ERX181467) or in MCF7 cells treated with Nutlin (sample ID SRX2060922). C. Measurement of relative IL7 mRNA levels in A549 cells exposed to indicated substances or combination treatments for 30 h. D. Relative IL7 mRNA levels in p53 knockdown A549 cells (p53-SH), and control cells (Con-SH), exposed to A + N or CPT for 30 h (p values from three repeats calculated by Student's t-test).
Fig. S1
Fig. S1
Innate immunity associated genes are upregulated in a p53-dependent manner following camptothecin treatment. A. The control (−) or p53 knocked-down (+) A549 cells were treated with camptothecin (CPT) and examined by Western blotting. “Con” cells were mock-treated. B. The expression of mRNA for indicated proteins determined by semi-quantitative RT-PCR in mock-treated control cells (Con) or the cells exposed to CPT for 30 h. The A549 cells with knocked-down p53 are marked as “p53-SH”, whereas the controls for knock-down are “Con-SH”. The results represent mean and standard deviation from three biological replicates, p values were calculated by two-tailed Student's t-test (N.S. non significant).
Fig. S2
Fig. S2
Several studies detected p53 ChIP-Seq peaks in promoter regions of NLRX1 and NLRP1, which we cloned and tested in luciferase reporter assay. Genome browser (IGV) views of p53 binding peaks that overlap with cloned promoter regions (red bars) of NLRX1 (upper panel) or NLRP1 (lower panel). Using ChIP-Atlas tool [33] we imported publically available coverage tracks from four ChIP-Seq experiments aimed at finding p53 binding sites in MCF-7 cell line exposed to ionizing radiation and Nutlin (sample ID SRX2924018), SAOS-2 cell line ectopically expressing wild-type p53 (sample ID SRX016980), SAOS-2 ectopically expressing pair of engineered p53 molecules with strong cooperative binding of p53 monomers [31] (sample ID ERX181467) or in MCF7 cells treated with Nutlin (sample ID SRX2060922).
Fig. S3
Fig. S3
C16 treatment inhibits activation of the p53 pathway by camptothecin in a PKR knockdown cells. The expression of indicated proteins in cells with knocked-down expression of PKR (PKR-SH) and in controls for knockdown (Con-SH) exposed to camptothecin (CPT) and/or C16 (1 μM) for 48 h.

References

    1. Zajkowicz A., Gdowicz-Kłosok A., Krześniak M., Ścieglińska D., Rusin M. Actinomycin D and nutlin-3a synergistically promote phosphorylation of p53 on serine 46 in cancer cell lines of different origin. Cell. Signal. 2015 Sep;27(9):1677–1687. - PubMed
    1. Zajkowicz A., Gdowicz-Kłosok A., Krześniak M., Janus P., Łasut B., Rusin M. The Alzheimer's disease-associated TREM2 gene is regulated by p53 tumor suppressor protein. Neurosci. Lett. 2018 Aug 10;681:62–67. - PubMed
    1. Choong M.L., Yang H., Lee M.A., Lane D.P. Specific activation of the p53 pathway by low dose actinomycin D: a new route to p53 based cyclotherapy. Cell Cycle. 2009 Sep 1;8(17):2810–2818. - PubMed
    1. Mantovani F., Tocco F., Girardini J., Smith P., Gasco M., Lu X., Crook T., Del Sal G. The prolyl isomerase Pin1 orchestrates p53 acetylation and dissociation from the apoptosis inhibitor iASPP. Nat. Struct. Mol. Biol. 2007 Oct;14(10):912–920. - PubMed
    1. Galluzzi L., Vitale I., Aaronson S.A. Molecular mechanisms of cell death: recommendations of the nomenclature committee on cell death 2018. Cell Death Differ. 2018 Mar;25(3):486–541. - PMC - PubMed

Publication types

MeSH terms