. 2020 Jun:139:104786.
doi: 10.1016/j.nbd.2020.104786. Epub 2020 Feb 5.

Dysregulated iron metabolism in C. elegans catp-6/ATP13A2 mutant impairs mitochondrial function

Affiliations

Dysregulated iron metabolism in C. elegans catp-6/ATP13A2 mutant impairs mitochondrial function

Nikhita Anand et al. Neurobiol Dis. 2020 Jun.

Abstract

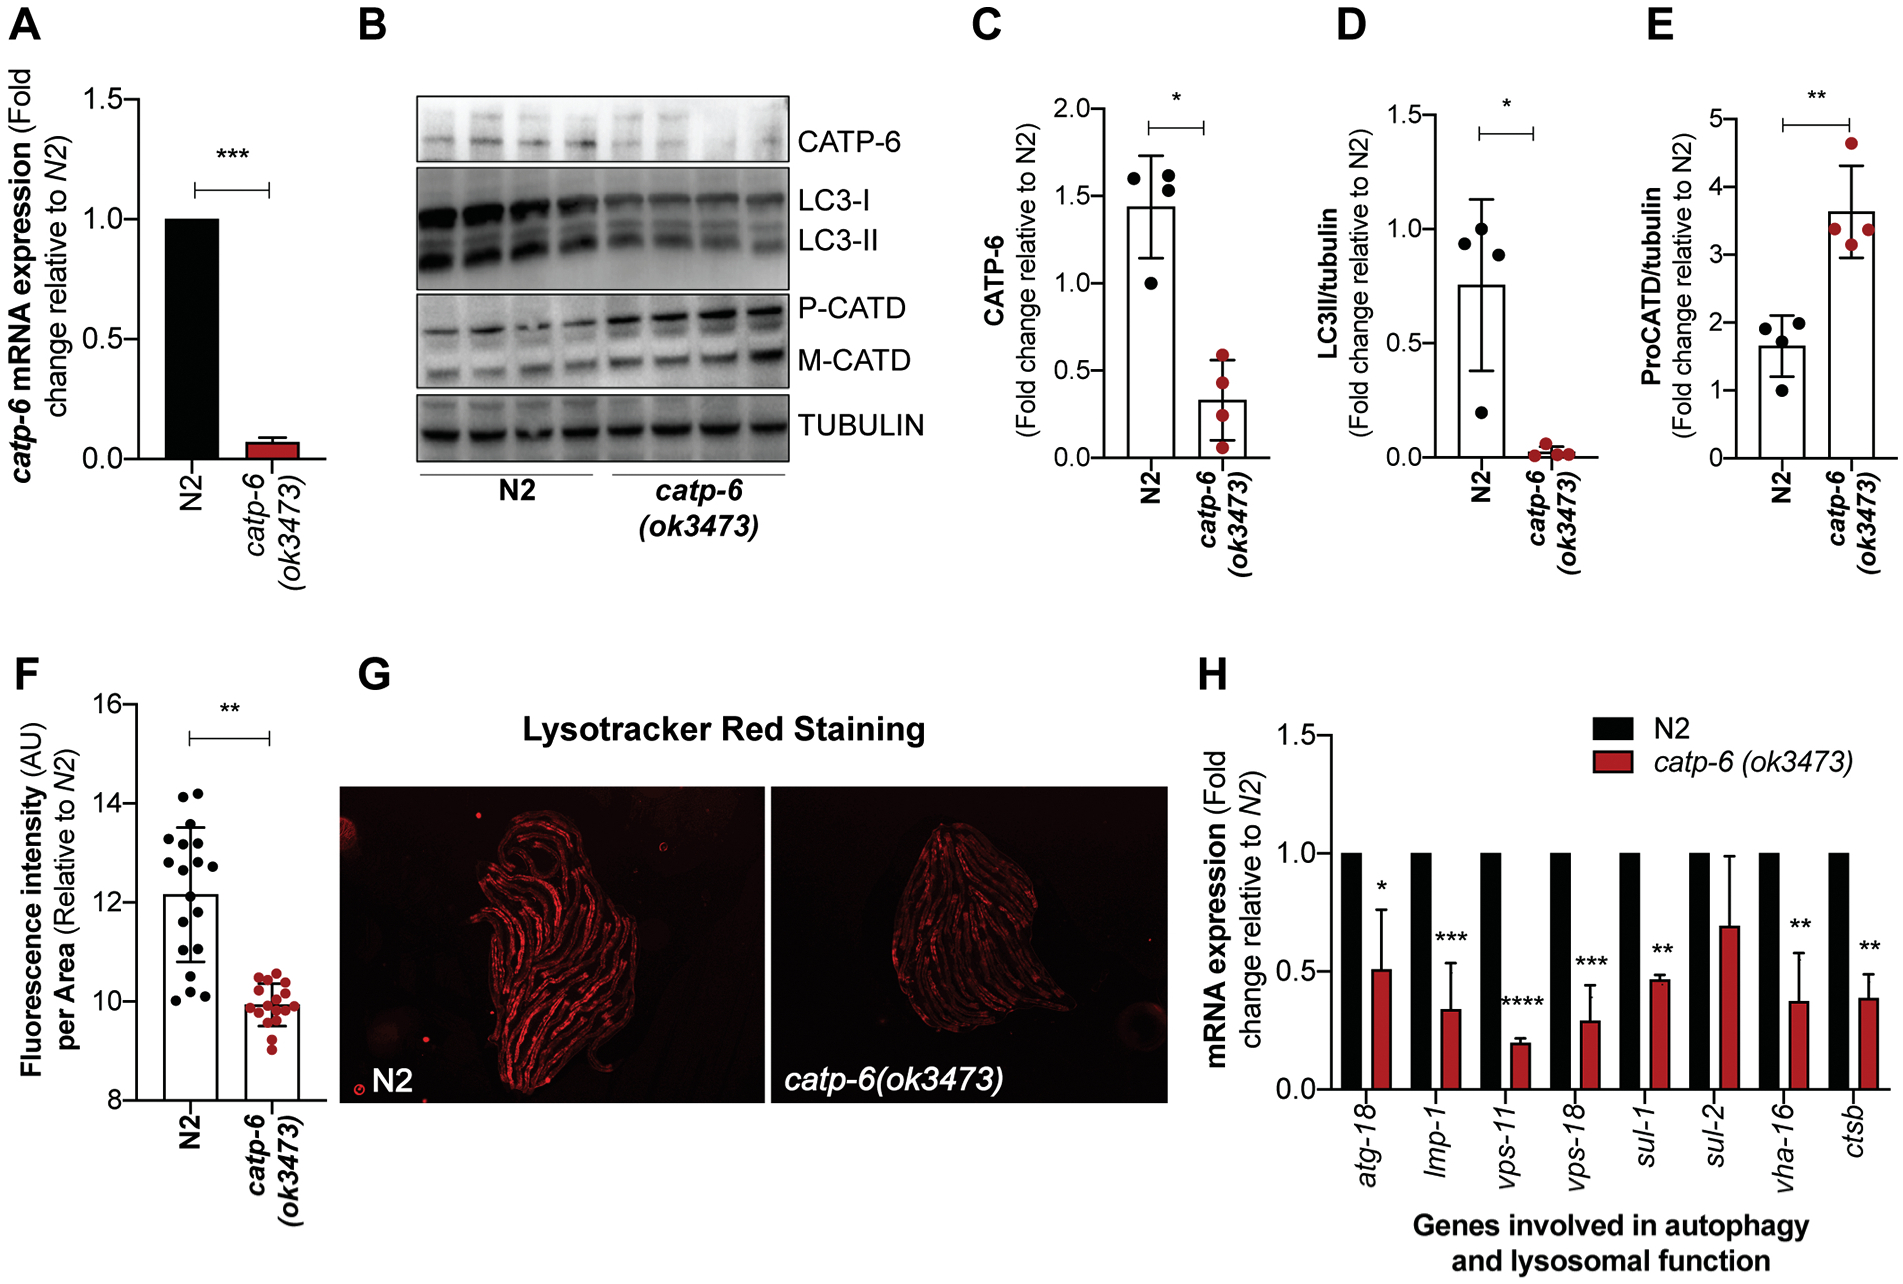
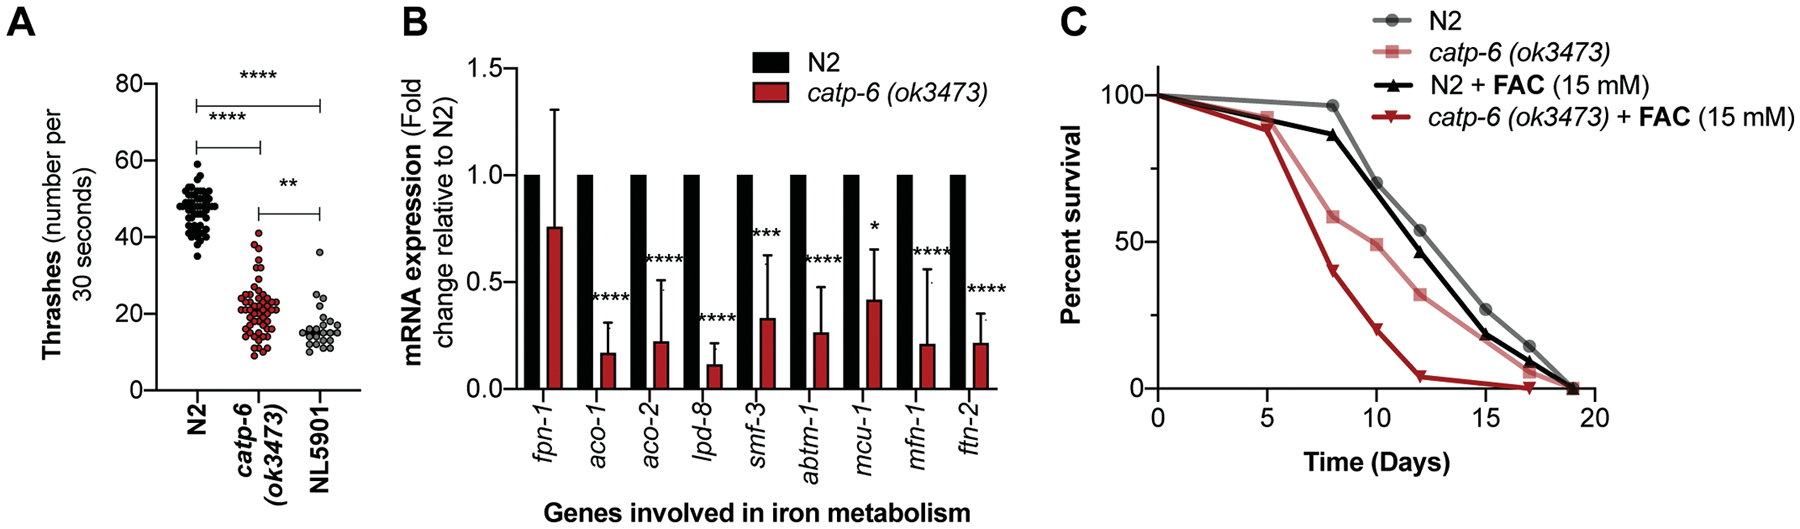
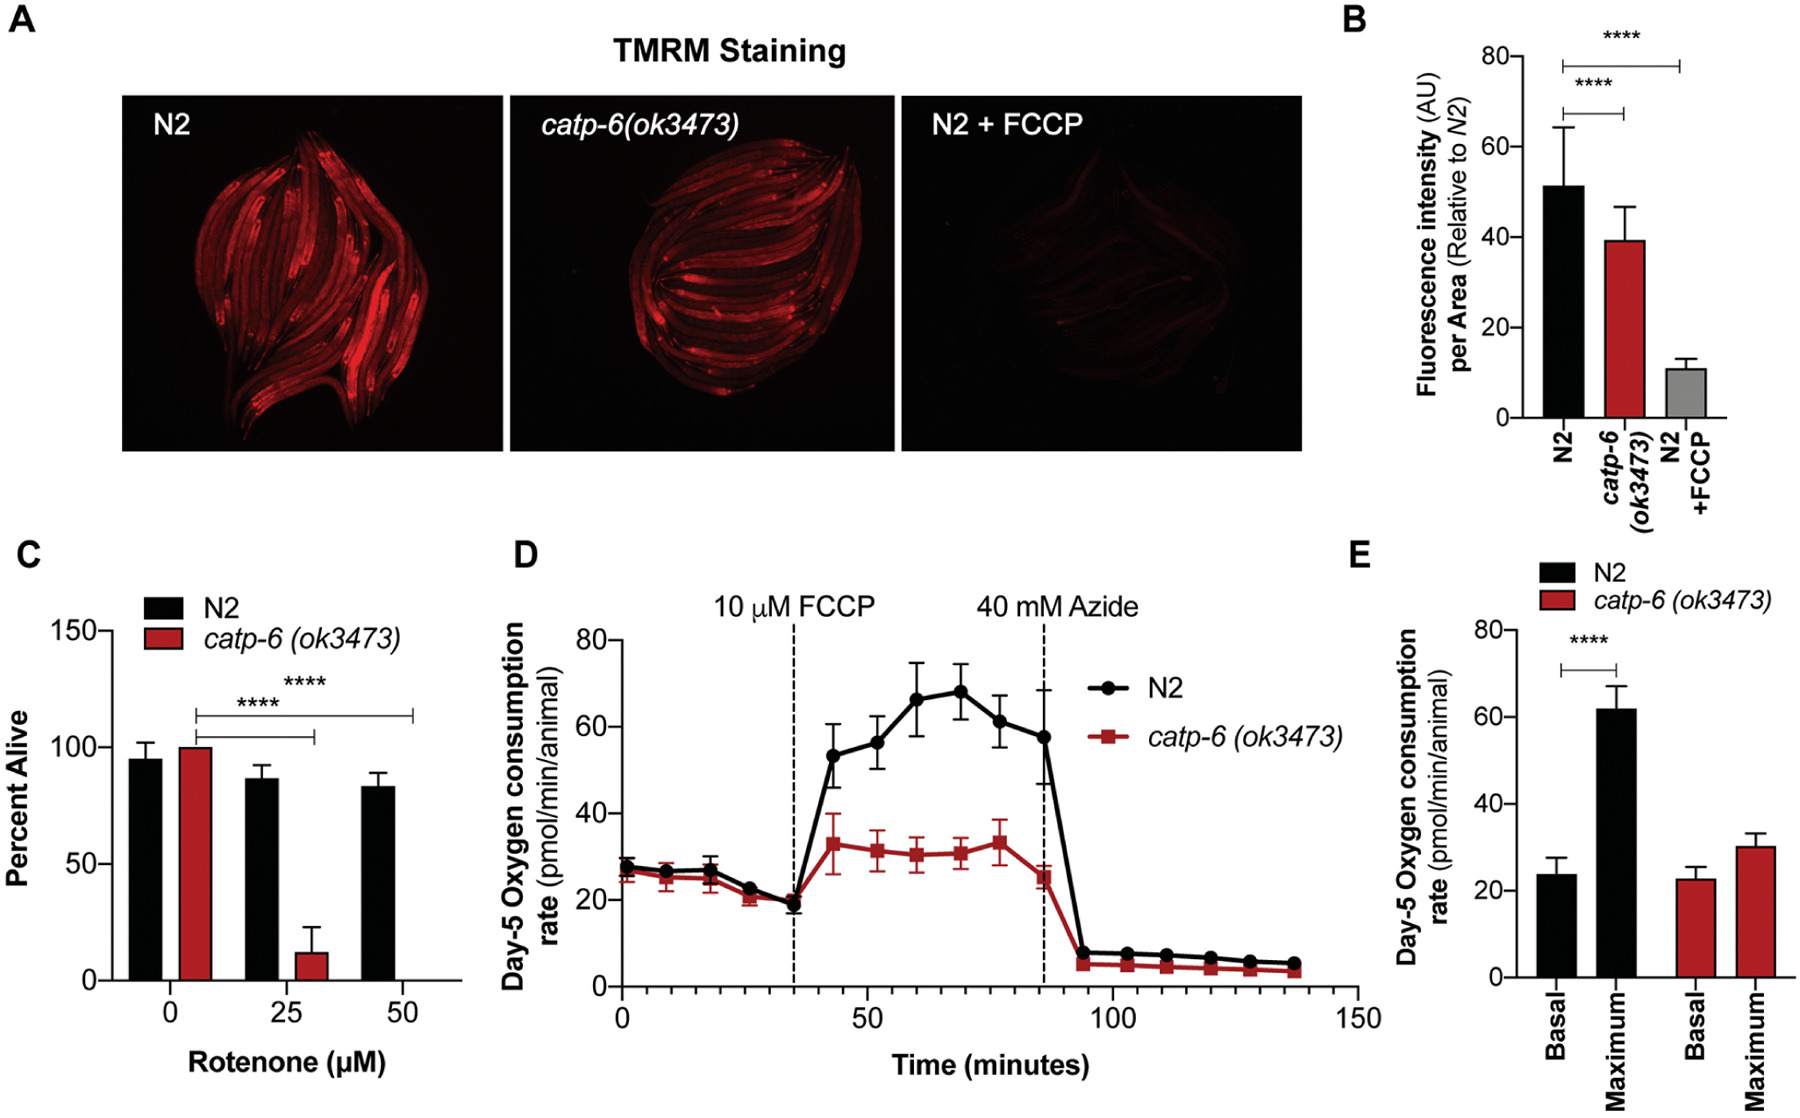
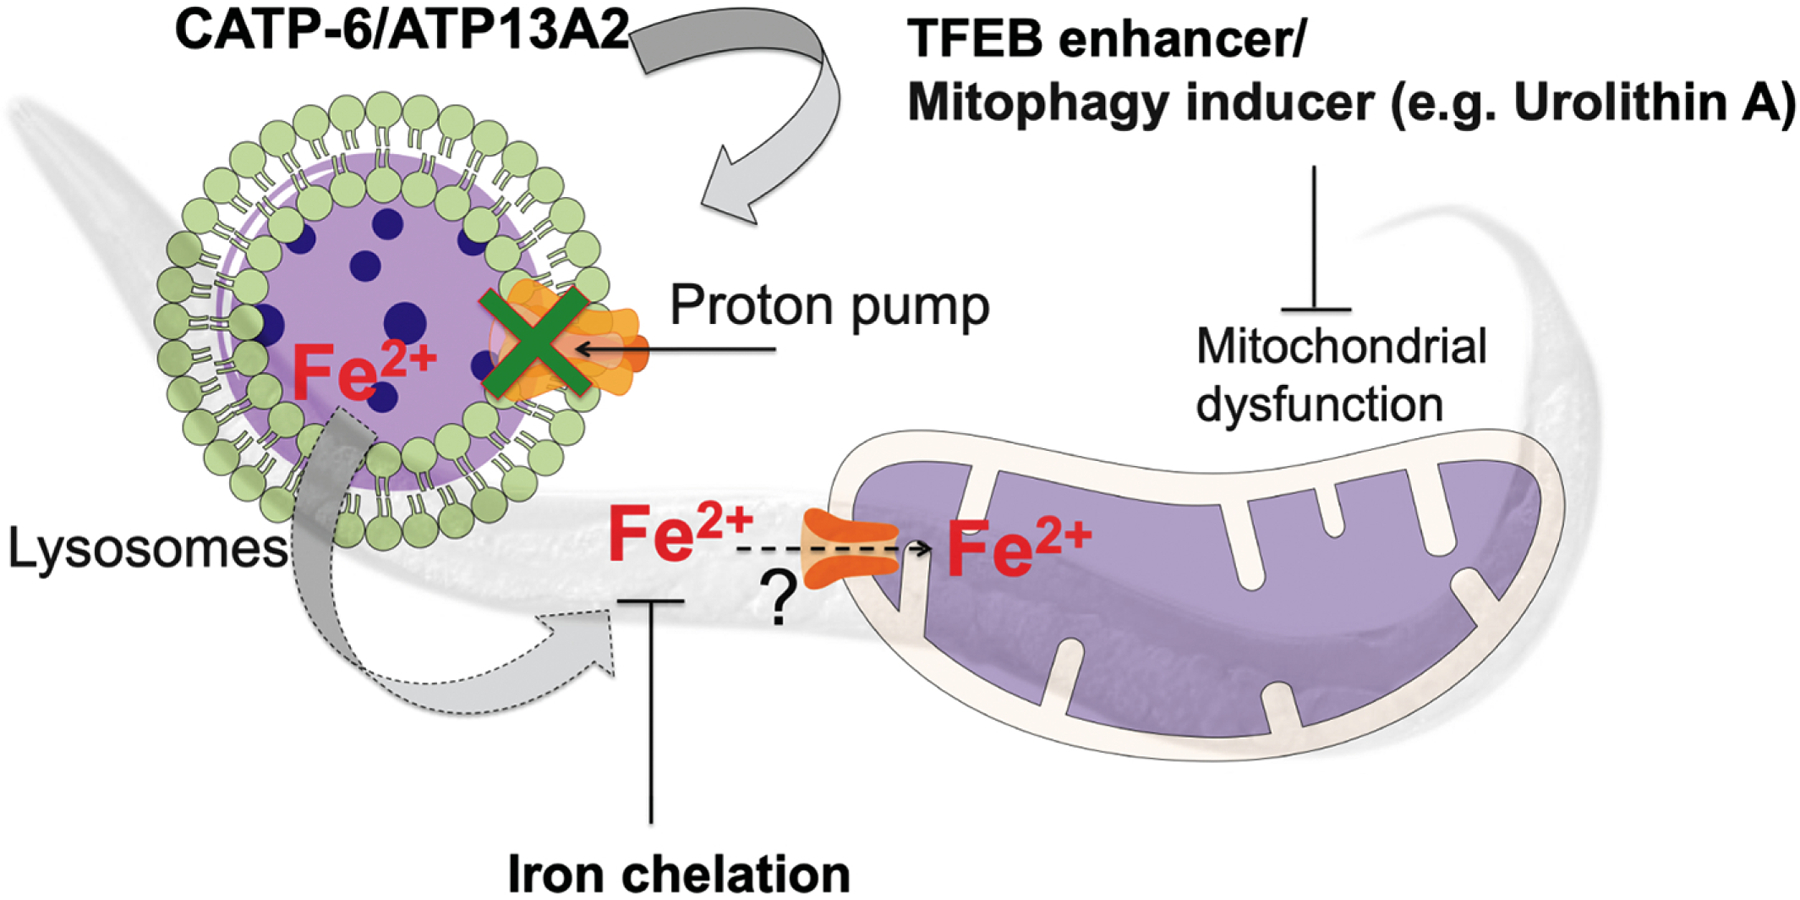
Mutations in the human ATP13A2 gene are associated with an early-onset form of Parkinson's disease (PD) known as Kufor Rakeb Syndrome (KRS). Patients with KRS show increased iron deposition in the basal ganglia, suggesting iron toxicity-induced neurodegeneration as a potential pathogenesis associated with the ATP13A2 mutation. Previously we demonstrated that functional losses of ATP13A2 disrupt the lysosomes ability to store excess iron, leading to reduce survival of dopaminergic neuronal cells. To understand the possible mechanisms involved, we studied a Caenorhabditis elegans mutant defective in catp-6 function, an ortholog of human ATP13A2 gene. Here we show that catp-6 mutant worms have defective autophagy and lysosomal function, demonstrate characteristic PD phenotypes including reduced motor function and dysregulated iron metabolism. Additionally, these mutants have defective mitochondrial health, which is rescuable via iron chelation or mitophagy induction.

Keywords: ATP13A2; C. elegans; Catp-6; Iron chelation; Iron metabolism; Lysosomes; Mitochondrial function; Parkinson's disease; TFEB; Urolithin A.


Figures

Figure 1:
Figure 1:. Loss of catp-6 affects autophagy and lysosomal function in C. elegans.
(A) Graph represents fold change ± SD in the mRNA expression of catp-6 in catp-6(ok3473) mutant relative to wild type N2 worms (n=2, p-values calculated using unpaired Student’s t-test). (B) Immunoblot showing the level of CATP-6, autophagosome specific cleaved LGG-1/LC3-II protein and lysosome specific aspartyl protease ASP-3/cathepsin D (CATD) which exists as procathepsin D (P) and mature (M) cathepsin D and loading control γ-tubulin. (C-E) Graph represents the densitometric analysis of the bands, showing average band intensity ± SD of CATP-6, cleaved LGG-1/LC3-II and P-CATD normalized to loading control γ-tubulin (n=4, p-values calculated using unpaired Student’s t-test) (F) Graph represents the mean fluorescence intensity ± SD of LysoTracker Red stain normalized to the body size for wild type N2 and catp-6(ok3473) worms. Quantification was performed on the whole body of an individual worm using NIH image J software (n=2, p-values calculated using unpaired Student’s t-test). (G) Representative images of the N2 and catp-6(ok3473) worms showing LysoTracker red fluorescence. (H) Graph represents fold change ± SD in the mRNA expression of autophagy and lysosomal specific genes in catp-6(ok3473) mutant worms relative to wild type N2 worms (n=2, p-values calculated using ordinary two-way ANOVA by Multiple t-tests with correction for multiple comparisons using the Holm-Sidak method). All the p-values are represented as *p < 0.05, **p<0.01 ***p<0.001 and ****p<0.0001.
Figure 2:
Figure 2:. Reduced motor function and dysregulated iron metabolism in catp-6 mutants.
(A) Quantification of the number of thrashes in N2 versus catp-6(ok3473) mutant worms. Graph represents average number of thrashes ± SD over the period of 30 seconds, where Individual dot represents single worm. NL5901 (pkIs2386 [unc- 54p::alphasynuclein::YFP + unc-119(+)] strain expressing human α-synuclein in muscles shows motor defects and served as a positive control for the assay. (n=3, p-values calculated using ordinary one-way ANOVA and Tukey’s multiple comparisons test). (B) Graph represents fold change ± SD in the mRNA expression of iron-metabolizing genes in catp-6(ok3473) mutant worms relative to wild type N2 worms (n=5, p-values calculated using two-way ANOVA analysis). (C) The effect of ferric ammonium citrate (FAC) or ammonium citrate exposure as a negative control on survival of N2 and catp-6(ok3473) mutant worms. N2 control [13.78 ± 0.44] (median-14), N2 FAC (15 mM) [13.43 ± 0.58] (median-13), catp-6(ok3473) [11.64 ± 0.59] (median-11), and catp-6(ok3473) FAC (15 mM) [9.04 ± 0.36] (median-8). [Mean average lifespan ± SEM], (n=2, p-value calculated using Mantel-Cox Log rank test). All the p-values are represented as *p < 0.05, **p<0.01 and ***p<0.001, ****p<0.0001.
Figure 3:
Figure 3:. Defective mitochondrial function in catp-6 mutants.
(A) Representative images of TMRM-stained N2, catp-6(ok3473) and TMRM-N2 worms exposed to 10 μM FCCP for 1 hour (positive control). (B) Graph represents the average mean fluorescence intensity ± SD of TMRM stain normalized to the body size. Quantification was performed on the whole body of an individual worm using NIH image J software (n=2, p-value calculated using ordinary one-way ANOVA and Tukey’s multiple comparisons test). (C) Enhanced sensitivity of catp-6(ok3473) mutant worms to the mitochondrial toxin rotenone measured as percent survival ± SD (n=2, p-value calculated using ordinary two-way ANOVA and Tukey’s multiple comparisons test). (D-E) Mitochondrial function in N2 and catp-6(ok3473) mutant worms as quantitated by oxygen consumption rate using the Seahorse. Bar graph represents average OCR consumption ± SD of day-5 N2 and catp-6(ok3473) worms (n=2, p-value calculated using ordinary two-way ANOVA and Sidak’s multiple comparison test). All the p-values are represented as *p < 0.05, **p<0.01 and ***p<0.001, ****p<0.0001.
Figure 4:
Figure 4:. Iron chelation and mitophagy induction rescue sensitivity of catp-6 to rotenone exposure.
Sensitivity of N2 and catp-6(ok3473) mutant worms to the mitochondrial toxin, rotenone, measured as percent survival ± SD in worms exposed to (A) the 2.5 mM iron chelator calcium-EDTA (Ca-EDTA) or (B) the 50 μM mitophagy-inducing agents (TFEB enhancer and urolithin A) throughout development (n=2, p-value calculated using ordinary two-way ANOVA and Tukey’s multiple comparisons test). All the p-values are represented as *p < 0.05, **p<0.01 and ***p<0.001, ****p<0.0001.
Figure 5:
Figure 5:. Schematic overview of the results.
The catp-6/ATP13A2 gene encodes a lysosomal transmembrane type 5 ATPase pump that helps to maintain autophagy and lysosomal function. Loss in CATP-6 function results in dysregulated iron metabolism effecting mitochondrial function and rendering it sensitive to mitochondrial stress. Iron chelation, TFEB enhancement or mitophagy inductions all separately rescue sensitivity to the mitochondrial toxin, rotenone.

References

    1. Andreux PA, Blanco-Bose W, Ryu D, Burdet F, Ibberson M et al. , 2019. The mitophagy activator urolithin A is safe and induces a molecular signature of improved mitochondrial and cellular health in humans. Nature Metabolism 1: 595–603. - PubMed
    1. Baesler J, Kopp JF, Pohl G, Aschner M, Haase H et al. , 2019. Zn homeostasis in genetic models of Parkinson’s disease in Caenorhabditis elegans. J Trace Elem Med Biol 55: 44–49. - PMC - PubMed
    1. Behrens MI, Bruggemann N, Chana P, Venegas P, Kagi M et al. , 2010. Clinical spectrum of Kufor-Rakeb syndrome in the Chilean kindred with ATP13A2 mutations. Mov Disord 25: 1929–1937. - PubMed
    1. Bonifati V, Rizzu P, van Baren MJ, Schaap O, Breedveld GJ et al. , 2003. Mutations in the DJ-1 gene associated with autosomal recessive early-onset parkinsonism. Science 299: 256–259. - PubMed
    1. Chamoli M, Chinta S, Schmidt M, Lithgow GJ and Andersen J, 2017. ROLE OF PHARMACOLOGICALLY INDUCED-TFEB IN AGING AND AGE-RELATED NEURODEGENERATION. Innovation in Aging 1: 1224–1224.

Publication types

Supplementary concepts