. 2020 Feb 4;12(2):173.
doi: 10.3390/v12020173.

The Susceptibility of Human Melanoma Cells to Infection with the Leningrad-16 Vaccine Strain of Measles Virus

Affiliations

The Susceptibility of Human Melanoma Cells to Infection with the Leningrad-16 Vaccine Strain of Measles Virus

Yulia Ammour et al. Viruses. .

Abstract

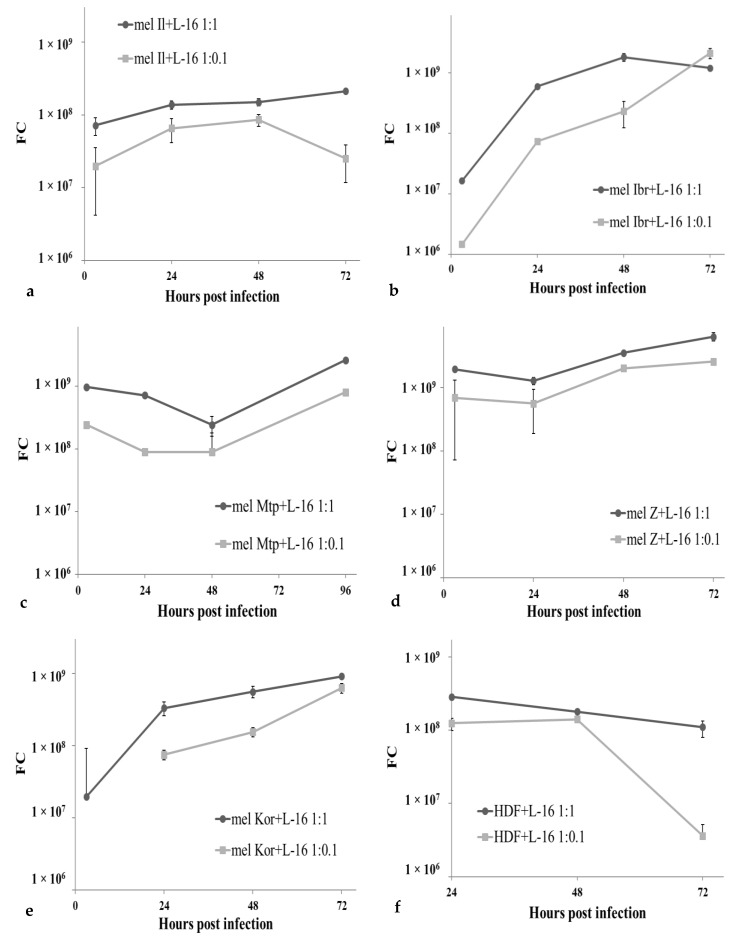
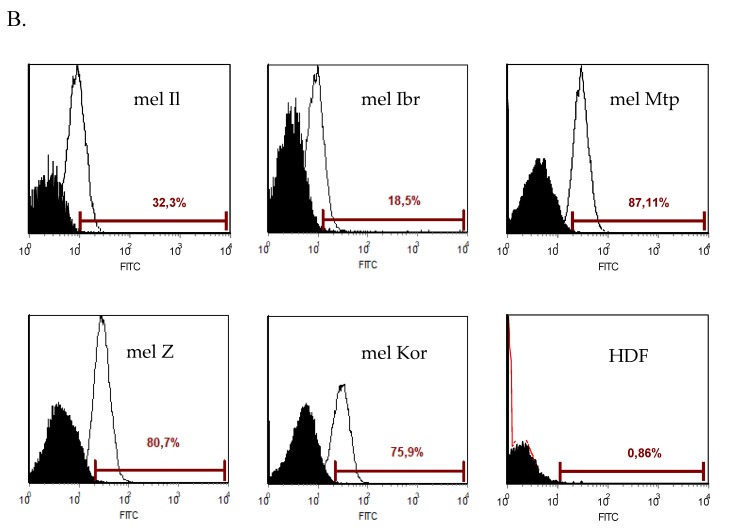
Oncolytic viruses, including live attenuated measles virus (MV) vaccine strains, have recently been shown as promising therapeutic agents against human malignancies. In this study, the oncolytic potential of the attenuated vaccine strain Leningrad-16 (L-16) of MV was evaluated in a panel of human metastatic melanoma cell lines. The L-16 measles virus was shown to replicate within melanoma cells mediating direct cell killing of tumor cells, although all melanoma cell lines varied in regard to their ability to respond to L-16 MV infection, as revealed by the different pattern of the Interferon Stimulated Gene expression, cytokine release and mechanisms of cell death. Furthermore, the statistically significant L-16 measles virus related tumor growth inhibition was demonstrated in a melanoma xenograft model. Therefore, L-16 MV represents an appealing oncolytic platform for target delivery of therapeutic genes along with other attenuated measles virus strains.

Keywords: cancer immunotherapy; measles virus; oncolytic viruses.


Conflict of interest statement

The authors declare no conflict of interest.

Figures

Figure 1
Figure 1
Oncolytic activity of MV L-16 strain against human melanoma cell lines at 72 hours post infection. Mel Il (a,b, 20×), mel Ibr (c,d, 10×), mel Mtp (e,f, 10×) and mel Z (g,h, 10×) cell lines were infected by MV at a MOI of 1.0 (left column) or mock-infected (right column). The characteristic syncytia formation is highlighted in the footnote.
Figure 1
Figure 1
Oncolytic activity of MV L-16 strain against human melanoma cell lines at 72 hours post infection. Mel Il (a,b, 20×), mel Ibr (c,d, 10×), mel Mtp (e,f, 10×) and mel Z (g,h, 10×) cell lines were infected by MV at a MOI of 1.0 (left column) or mock-infected (right column). The characteristic syncytia formation is highlighted in the footnote.
Figure 2
Figure 2
Oncolytic activity of MV strain L-16 against human melanoma cell lines. The viability of each cell line was measured after infection with MV at MOI of 1.0 (black) and 0.1 (gray) or UV-inactivated MV at MOI 1.0 (light gray) using the MTT assay. The data shown are mean results from three separate experiments; error bars indicate standard deviation (SD). The X-axis represents hours post infection, the Y is the percentage of viable cells for each time point relatively to the number of cells at 3 h post infection.
Figure 2
Figure 2
Oncolytic activity of MV strain L-16 against human melanoma cell lines. The viability of each cell line was measured after infection with MV at MOI of 1.0 (black) and 0.1 (gray) or UV-inactivated MV at MOI 1.0 (light gray) using the MTT assay. The data shown are mean results from three separate experiments; error bars indicate standard deviation (SD). The X-axis represents hours post infection, the Y is the percentage of viable cells for each time point relatively to the number of cells at 3 h post infection.
Figure 3
Figure 3
Sigmoidal dose-response for MV-infected melanoma cell lines. The sigmoidal dose-response curves were plotted and ED50 dilutions of MV were interpolated using the xCELLigence software for each cell line by the formulae—Y = Bottom + (Top - Bottom)/(1 + 10^(Log EC50 − X)). The X axis represents Log of dilution of MV, the Y—Cell Index reflected the number of viable cells.
Figure 4
Figure 4
Production of MV strain L-16 in infected melanoma cells and fibroblasts. Melanoma cells, mel Il (a), mel Ibr (b), mel Mtp (c), mel Z (d), mel Kor (e), or HDF (f) cells were infected with MV at a MOI of 1.0 (-○-) or 0.1 (-□-) and virus quantification was determined using the qPCR-RT method in supernatants collected daily from infected cell monolayer. The output of the PCR for each sample was the threshold cycle (Ct) value. In parallel with samples a 10-fold dilution series of purified reference MV with known titers (expressed in lgCCID50/mL) was performed and 5 μL of each standard dilution was run in duplicate to construct a 4-point calibration curve. Titer for the test samples was calculated in CCID50/mL relatively to reference preparations based on the standard curve and subsequently converted to the lgCCID50/mL value. Means and standard deviations (SD) from three independent experiments are shown.
Figure 5
Figure 5
Replication of MV strain L-16 in melanoma cells and fibroblasts. Melanoma cells, mel Il (a), mel Ibr (b), mel Mtp (c), mel Z (d), mel Kor (e), or HDF (f) cells were infected with MV at a MOI of 1.0 (-○-) or 0.1 (-□-) and virus quantification was determined in cell lysates using the qPCR-RT method. The data shown are representative of three separate experiments and expressed in fold change. Fold change—FC, is an average value of threshold cycle (Ct) for MV intracellular RNA obtained for each sample, normalized to an average Ct value for house-keeping genes used: GAPDH, PGK1 and ACTB, measured for the same sample in parallel (∆Сt), and calculated relatively to normalized Ct value for the respective mock-infected cell line (∆∆Сt). The data represents the FC values between the level of MV RNA expression in MV-infected cells (∆∆Сt(+)) and infected with UV-inactivated MV cells (∆∆Сt(−)) for each time point, FC = 2−∆∆Сt(+)-2−∆∆Сt(−)].
Figure 6
Figure 6
Expression of the CD46 receptor at the surface of melanoma cells and HDF as measured by flow cytometry. A total 1.0 × 10⁵ cells were incubated with a FITC-conjugated anti-human CD46 antibodies in PBS containing 1.0% FBS for extracellular staining. After 30 min, cells were washed twice, resuspended in PBS and fixed with 1% PFA for 30 min. A. Plot of fluorescence intensity (relative to isotype) of cells stained with anti-CD46-FITC. The data shown are mean results from three separate experiments; error bars indicate standard deviation of the mean B. Representative histograms. The shaded histograms represent isotype control staining; the solid line histograms represent CD46 staining; OX—CD46 (FITC), OY—the number of cells.
Figure 6
Figure 6
Expression of the CD46 receptor at the surface of melanoma cells and HDF as measured by flow cytometry. A total 1.0 × 10⁵ cells were incubated with a FITC-conjugated anti-human CD46 antibodies in PBS containing 1.0% FBS for extracellular staining. After 30 min, cells were washed twice, resuspended in PBS and fixed with 1% PFA for 30 min. A. Plot of fluorescence intensity (relative to isotype) of cells stained with anti-CD46-FITC. The data shown are mean results from three separate experiments; error bars indicate standard deviation of the mean B. Representative histograms. The shaded histograms represent isotype control staining; the solid line histograms represent CD46 staining; OX—CD46 (FITC), OY—the number of cells.
Figure 7
Figure 7
Inhibition of viral load in melanoma cells by mAbs against CD46. Mel Z cell line was incubated with increasing concentrations of mAbs or isotype control mAbs for one hour, washed with PBS and infected with MV at a MOI of 1.0. Viral load was measured in cell lysates by qPCR-RT after 4 h of incubation and the impact of anti-CD46 mAbs was expressed in % relatively to infected cells incubated with isotype control mAbs. The data shown are mean results from three independent experiments; error bars indicate standard deviation.
Figure 8
Figure 8
Molecular characterization of DI-RNAs generated by vaccine strain L-16 of MV. cDNA amplified with L-16-specific RT-PCR (upper panel) or DI-RNA-specific RT-PCR (lower panel), and analyzed by agarose gel electrophoresis. The lines correspond to the following cells: 1—mel Il + L-16, 24 h p.i., 2—mel Il + L-16, 48 h p.i., 3—mel Mtp + L-16, 24 h p.i., 4—mel Mtp + L-16, 48 h p.i., 5—mel Ibr + L-16, 24 h p.i., 6—mel Ibr + L-16, 48 h p.i., 7—mel Kor + L-16, 24 h p.i., 8—mel Kor + L-16, 48 h p.i., 9—mel Z + L-16, 24 h p.i., 10—mel Z + L-16, 48 h p.i., 11—input L-16 MV, M—GeneRuler DNA Ladder Mix (Thermo Scientific).
Figure 9
Figure 9
Production of pro- and anti-inflammatory cytokines—TNFα, IL-6, IL-10 and IL-1β release. Cell-free supernatants were collected 48 h after infection with MV or UV-inactivated MV and cytokines levels were determined by ELISA. The data shown are mean results from three independent experiments; error bars indicate standard deviation.
Figure 10
Figure 10
Melanoma cell DNA agarose gel electrophoresis after infection with MV strain L-16. Lines correspond to the following cells: 1—HDF + L-16, 24 h p.i., 2—mel Il + L-16, 24 h p.i., 3—mel Z + L-16, 24 h p.i., 4—HDF + L-16, 48 h p.i., 5—mel Il + L-16, 48 h p.i., 6—mel Z + L-16, 48 h p.i., 7—HDF + L-16, 72 h p.i., 8—mel Il + L-16, 72 h p.i., 9—mel Z + L-16, 72 h p.i., 10—HDF + L-16, 96 h p.i., 11—mel Il + L-16, 96 h p.i., 12—mel Z + L-16, 96 h p.i., M—GeneRuler DNA Ladder Mix (Thermo Scientific).
Figure 11
Figure 11
Cytometric analysis of apoptosis in infected melanoma cells stained with Annexin V/PI and analysed by flow cytometry. a. Uninfected mel Mtp cell line at 48 h incubation; b. MV infected mel Mtp cell line at 24 h post infection; c. MV-infected mel Mtp cell line at 48 h post infection; d. MV infected mel Mtp cell line at 72 h post infection. e. uninfected mel Z cell line at 72 h incubation; f. MV infected mel Z cell line at 72 h post infection; g. mel Ibr cell line at 72 h incubation; h. MV infected mel Ibr cell line at 72 h post infection. ОХ—Annexin V (FITC), OY—PI.
Figure 12
Figure 12
Oncolytic activity of MV strain L-16 against mel Z xenograft tumors in vivo. Mean tumor volume in Balb/c nu/nu mice after three doses of MV L-16 intertumoral injection (n = 4, light grey line) or culture medium (n = 4, dark line). The error bars indicate the standard deviation of the mean for each group of animals.

References

    1. Malishevskaya N.P., Sokolova A.V., Demidov L.V. The incidence of skin melanoma in the Russian Federation and federal districts. Med Counc. 2018;10:161–165. doi: 10.21518/2079-701X-2018-10-161-165. (In Russian) - DOI
    1. Matthews N.H., Li W.-Q., Qureshi A.A., Weinstock M.A., Cho E. Epidemiology of Melanoma. In: Ward W.H., Farma J.M., editors. Cutaneous Melanoma: Epidemiology and Therapy. Codon Publications; Brisbane, Australia: 2017. - PubMed
    1. Lacroix J., Kis Z., Josupeit R., Schlund F., Stroh-Dege A., Frank-Stöhr M., Leuchs B., Schlehofer J.R., Rommelaere J., Dinsart C. Preclinical Testing of an Oncolytic Parvovirus in Ewing Sarcoma: Protoparvovirus H-1 Induces Apoptosis and Lytic Infection In Vitro but Fails to Improve Survival In Vivo. Viruses. 2018;10:302. doi: 10.3390/v10060302. - DOI - PMC - PubMed
    1. Errington F., White C.L., Twigger K.R., Rose A., Scott K., Steele L., Ilett L.J., Prestwich R., Pandha H.S., Coffey M., et al. Inflammatory tumor cell killing by oncolytic reovirus for the treatment of melanoma. Gene Ther. 2008;18:1257–1270. doi: 10.1038/gt.2008.58. - DOI - PMC - PubMed
    1. Murphy M.A., Besmer D.M., Moerdyk-Schauwecker M., Moestl N., Ornelles D., Mukherjee P., Grdzelishvili V.Z. Vesicular Stomatitis Virus as an Oncolytic Agent against Pancreatic Ductal Adenocarcinoma. J. Virol. 2012;86:3073–3087. doi: 10.1128/JVI.05640-11. - DOI - PMC - PubMed

Publication types