. 2020 Feb 4;12(2):344.
doi: 10.3390/cancers12020344.

Early Detection of Hyperprogressive Disease in Non-Small Cell Lung Cancer by Monitoring of Systemic T Cell Dynamics

Affiliations

Early Detection of Hyperprogressive Disease in Non-Small Cell Lung Cancer by Monitoring of Systemic T Cell Dynamics

Hugo Arasanz et al. Cancers (Basel). .

Abstract

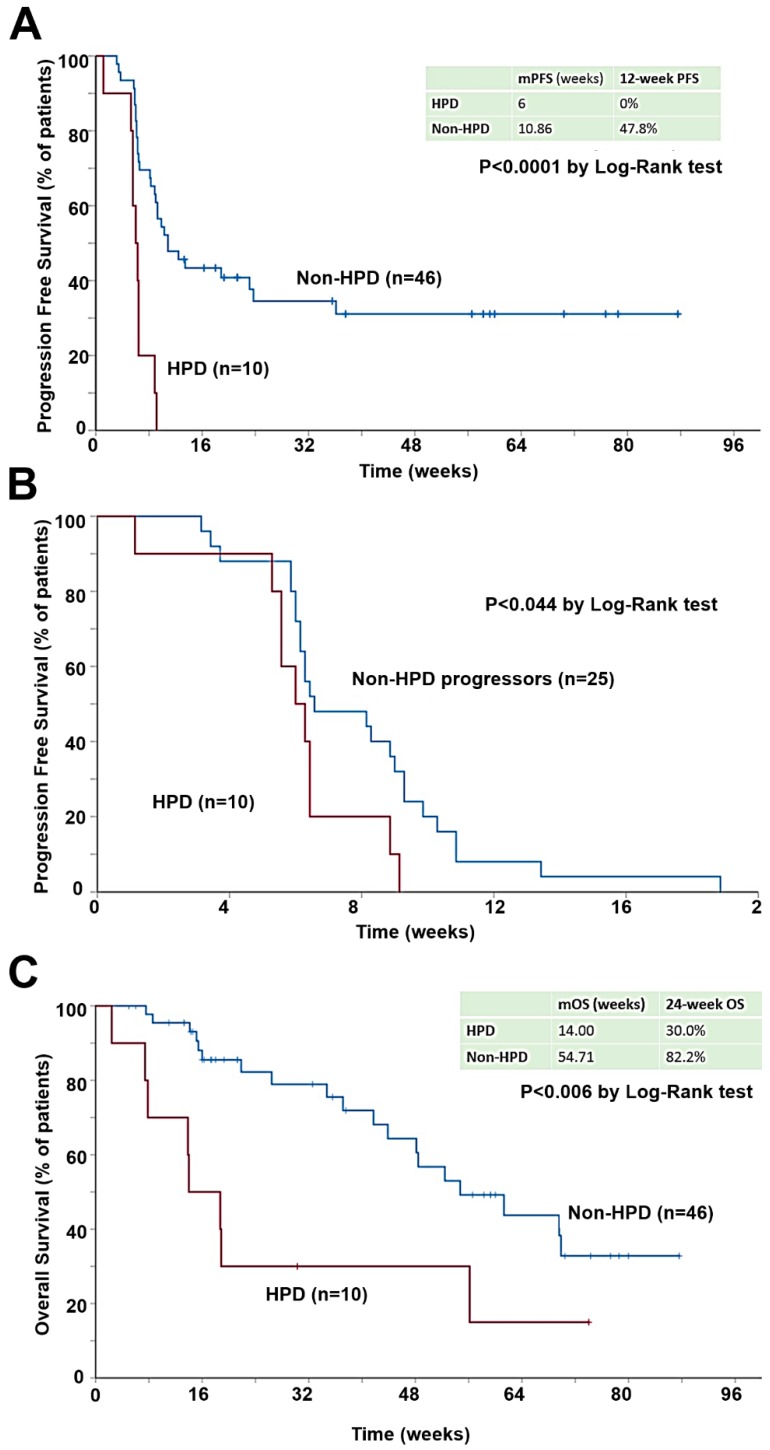
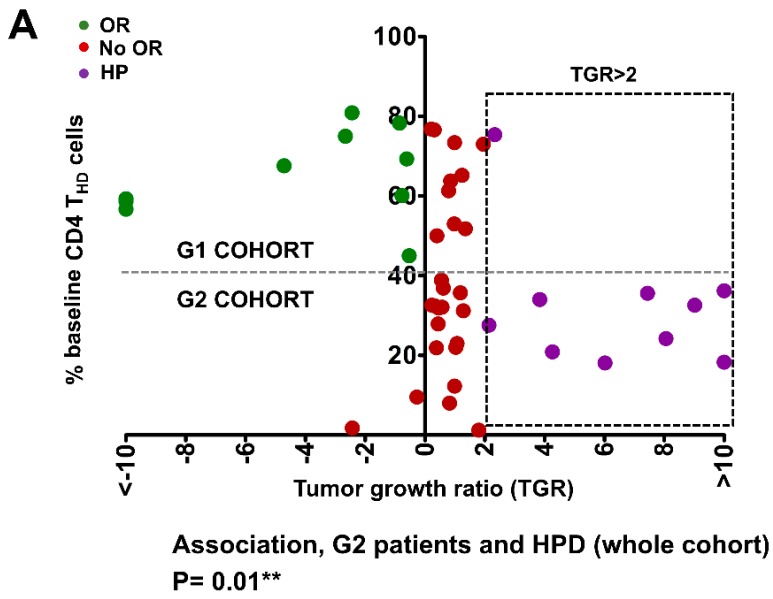
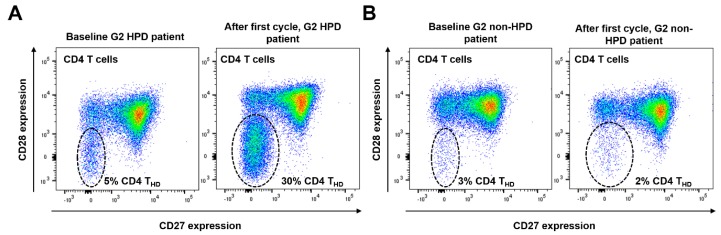
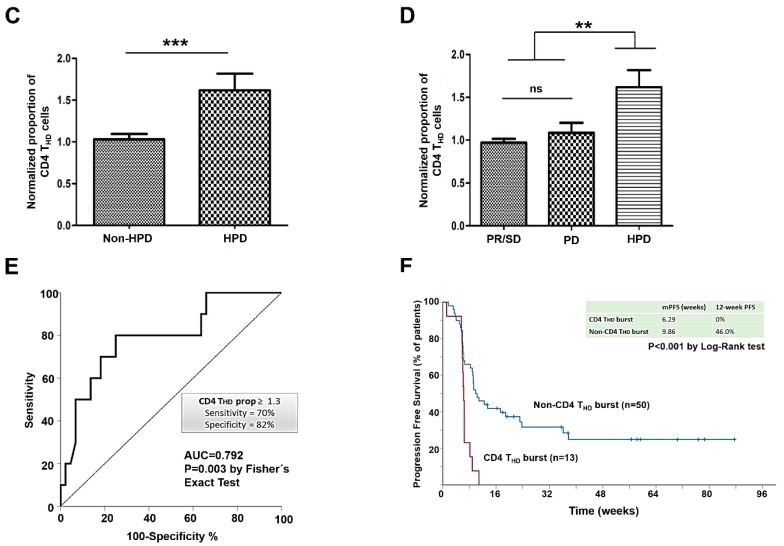
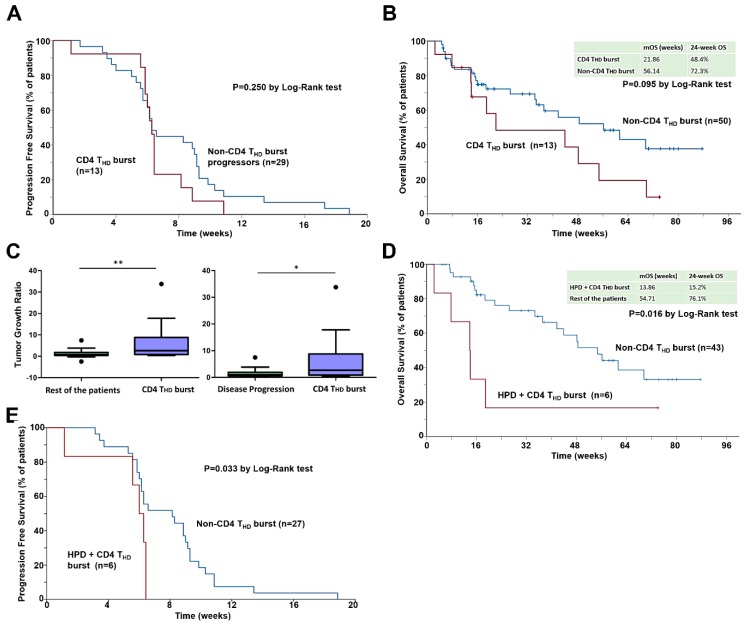
Hyperprogressive disease (HPD) is an adverse outcome of immunotherapy consisting of an acceleration of tumor growth associated with prompt clinical deterioration. The definitions based on radiological evaluation present important technical limitations. No biomarkers have been identified yet. In this study, 70 metastatic NSCLC patients treated with anti-PD-1/PD-L1 immunotherapy after progression to platinum-based therapy were prospectively studied. Samples from peripheral blood were obtained before the first (baseline) and second cycles of treatment. Peripheral blood mononuclear cells (PBMCs) were isolated and differentiation stages of CD4 lymphocytes quantified by flow cytometry and correlated with HPD as identified with radiological criteria. A strong expansion of highly differentiated CD28- CD4 T lymphocytes (CD4 THD) between the first and second cycle of therapy was observed in HPD patients. After normalizing, the proportion of posttreatment/pretreatment CD4 THD was significantly higher in HPD when compared with the rest of patients (median 1.525 vs. 0.990; p = 0.0007), and also when stratifying by HPD, non-HPD progressors, and responders (1.525, 1.000 and 0.9700 respectively; p = 0.0025). A cut-off value of 1.3 identified HPD with 82% specificity and 70% sensitivity. An increase of CD28- CD4 T lymphocytes ≥ 1.3 (CD4 THD burst) was significantly associated with HPD (p = 0.008). The tumor growth ratio (TGR) was significantly higher in patients with expansion of CD4 THD burst compared to the rest of patients (median 2.67 vs. 0.86, p = 0.0049), and also when considering only progressors (median 2.67 vs. 1.03, p = 0.0126). A strong expansion of CD28- CD4 lymphocytes in peripheral blood within the first cycle of therapy is an early differential feature of HPD in NSCLC treated with immune-checkpoint inhibitors. The monitoring of T cell dynamics allows the early detection of this adverse outcome in clinical practice and complements radiological evaluation.

Keywords: NSCLC; hyperprogressive disease; immunotherapy.


Conflict of interest statement

The authors declare no conflict of interest.

Figures

Figure 1
Figure 1
Hyperprogressive disease as defined by TGR associates with worse PFS and OS. (A) Kaplan-Meier plot for PFS in patients with measurable disease by RECIST 1.1 treated with immunotherapy, stratified by HPD at first radiological evaluation. (B) Kaplan-Meier plot for PFS only representing those patients with measurable disease by RECIST 1.1 who did not respond to immunotherapy. (C) Kaplan-Meier plot for OS in patients with measurable disease by RECIST 1.1 treated with immunotherapy, stratified by HPD at first radiological evaluation.
Figure 2
Figure 2
Hyperprogressive disease as defined by TGR associates with G2 baseline CD4 THD profiles. (A) Dot plot of color-coded clinical outcomes of the patients in our cohort represented by their baseline percentage of CD4 THD in peripheral blood and TGR. The square with dotted lines represents patients with TGRs higher than 2, the most commonly used cut-off value to separate progressors from hyperprogressors. The horizontal dotted line separates the G1 cohort (>40% CD4 THD) from the G2 cohort (<40% CD4 THD). The association of HPD with G2 profiles including also responders is shown below by the Fisher’s exact test. OR, objective responses; No OR, no objective responses; HP, hyperprogressors. (B) As in (A) but plotting the baseline percentage of CD8 THD cells. No significant association with HPD is observed. (C) Contingency table representing the incidence of HPD in patients with measurable disease by RECIST 1.1, according to G1 or G2 lymphocyte profile as defined by Zuazo M. The numbers indicate the following: absolute number of patients, row percentage, and 95% confidence interval of each percentage.
Figure 2
Figure 2
Hyperprogressive disease as defined by TGR associates with G2 baseline CD4 THD profiles. (A) Dot plot of color-coded clinical outcomes of the patients in our cohort represented by their baseline percentage of CD4 THD in peripheral blood and TGR. The square with dotted lines represents patients with TGRs higher than 2, the most commonly used cut-off value to separate progressors from hyperprogressors. The horizontal dotted line separates the G1 cohort (>40% CD4 THD) from the G2 cohort (<40% CD4 THD). The association of HPD with G2 profiles including also responders is shown below by the Fisher’s exact test. OR, objective responses; No OR, no objective responses; HP, hyperprogressors. (B) As in (A) but plotting the baseline percentage of CD8 THD cells. No significant association with HPD is observed. (C) Contingency table representing the incidence of HPD in patients with measurable disease by RECIST 1.1, according to G1 or G2 lymphocyte profile as defined by Zuazo M. The numbers indicate the following: absolute number of patients, row percentage, and 95% confidence interval of each percentage.
Figure 3
Figure 3
An expansion of the CD28negative CD4 T cell compartment following the first cycle of immunotherapy correlates with radiological HPD. (A) Example of quantification of CD4 T cells according to CD28 and CD27 expression profiles in a HPD patient before starting immunotherapy (left plot, baseline) and after the first cycle of treatment (right plot); CD4 THD cells are encircled and correspond to doubly CD28/CD27-negative cells. An increase in CD4 THD cells was observed (from 5% to 30%, as indicated). (B) Same as (A) but from a G2 non-HPD progressor. No increase in CD4 THD cells was observed. (C) Bar graph representing the mean and 95% confidence interval of the CD4 THD proportion in patients who presented HPD compared with non-HPD progressors. (D) Bar graph representing mean and 95% confidence interval of the proportion of basal and post-first cycle CD4 THD cells in patients with partial response, stable disease, progressive disease or HPD. (E) ROC analysis of CD4 THD proportion as a function of radiological HPD. (F) Kaplan-Meier plot for PFS in patients with lymphocyte subpopulations quantified before and after the first cycle of immunotherapy, stratified by the detection of CD4 THD burst (≥1.3). PR: partial response. SD: Stable disease. PD: Progressive disease. HPD: Hyperprogressive disease. **; ***, indicate very significant (p < 0.01) and highly significant (p < 0.001) statistical differences respectively.
Figure 3
Figure 3
An expansion of the CD28negative CD4 T cell compartment following the first cycle of immunotherapy correlates with radiological HPD. (A) Example of quantification of CD4 T cells according to CD28 and CD27 expression profiles in a HPD patient before starting immunotherapy (left plot, baseline) and after the first cycle of treatment (right plot); CD4 THD cells are encircled and correspond to doubly CD28/CD27-negative cells. An increase in CD4 THD cells was observed (from 5% to 30%, as indicated). (B) Same as (A) but from a G2 non-HPD progressor. No increase in CD4 THD cells was observed. (C) Bar graph representing the mean and 95% confidence interval of the CD4 THD proportion in patients who presented HPD compared with non-HPD progressors. (D) Bar graph representing mean and 95% confidence interval of the proportion of basal and post-first cycle CD4 THD cells in patients with partial response, stable disease, progressive disease or HPD. (E) ROC analysis of CD4 THD proportion as a function of radiological HPD. (F) Kaplan-Meier plot for PFS in patients with lymphocyte subpopulations quantified before and after the first cycle of immunotherapy, stratified by the detection of CD4 THD burst (≥1.3). PR: partial response. SD: Stable disease. PD: Progressive disease. HPD: Hyperprogressive disease. **; ***, indicate very significant (p < 0.01) and highly significant (p < 0.001) statistical differences respectively.
Figure 4
Figure 4
The CD4 THD burst is associated with HPD, and complements radiological criteria for its diagnosis. (A) Kaplan-Meier plot for PFS only representing patients with processed lymphocyte subpopulations quantified before and after the first cycle of immunotherapy who did not respond to immunotherapy, stratified by the incidence of CD4 THD burst (≥1.3). (B) Kaplan-Meier plot for OS in patients with lymphocyte subpopulations quantified before and after the first cycle of immunotherapy, stratified by detection of CD4 THD burst (≥1.3). (C) Left graph, box and whiskers plot (Tukey) representing median TGR of patients with CD4 THD burst compared to the rest of patients. Box depicts interquartile range, whiskers add up 1.5 interquartile range. Outliers are represented by dots. Right graph, same as left but comparing median TGR of patients with CD4 THD burst compared to the patients that presented progressive disease as best response. (D) Kaplan-Meier plot for OS in patients with measurable disease by RECIST 1.1 and lymphocyte subpopulations quantified before and after the first cycle of immunotherapy, stratified by the presence of both HPD by TGR and the detection of CD4 THD burst (≥1.3). (E) Kaplan-Meier plot for PFS representing patients with measurable disease by RECIST 1.1 and lymphocyte subpopulations quantified before and after the first cycle of immunotherapy, who presented progressive disease as best response, stratified by the presence of both HPD by TGR and the detection of CD4 THD burst (≥1.3). *, **, indicate significant (p < 0.05) and very significant (p < 0.01) statistical differences.

References

    1. Champiat S., Dercle L., Ammari S., Massard C., Hollebecque A., Postel-Vinay S., Chaput N., Eggermont A., Marabelle A., Soria J.C., et al. Hyperprogressive Disease Is a New Pattern of Progression in Cancer Patients Treated by Anti-PD-1/PD-L1. Clin. Cancer Res. 2017;23:1920–1928. doi: 10.1158/1078-0432.CCR-16-1741. - DOI - PubMed
    1. Saada-Bouzid E., Defaucheux C., Karabajakian A., Coloma V.P., Servois V., Paoletti X., Even C., Fayette J., Guigay J., Loirat D., et al. Hyperprogression during anti-PD-1/PD-L1 therapy in patients with recurrent and/or metastatic head and neck squamous cell carcinoma. Ann. Oncol. 2017;28:1605–1611. doi: 10.1093/annonc/mdx178. - DOI - PubMed
    1. Champiat S., Ferrara R., Massard C., Besse B., Marabelle A., Soria J.C., Ferte C. Hyperprogressive disease: Recognizing a novel pattern to improve patient management. Nat. Rev. Clin. Oncol. 2018 doi: 10.1038/s41571-018-0111-2. - DOI - PubMed
    1. Lo Russo G., Moro M., Sommariva M., Cancila V., Boeri M., Centonze G., Ferro S., Ganzinelli M., Gasparini P., Huber V., et al. Antibody-Fc/FcR Interaction on Macrophages as a Mechanism for Hyperprogressive Disease in Non-small Cell Lung Cancer Subsequent to PD-1/PD-L1 Blockade. Clin. Cancer Res. 2019;25:989–999. doi: 10.1158/1078-0432.CCR-18-1390. - DOI - PubMed
    1. Kamada T., Togashi Y., Tay C., Ha D., Sasaki A., Nakamura Y., Sato E., Fukuoka S., Tada Y., Tanaka A., et al. PD-1(+) regulatory T cells amplified by PD-1 blockade promote hyperprogression of cancer. Proc. Natl. Acad. Sci. USA. 2019;116:9999–10008. doi: 10.1073/pnas.1822001116. - DOI - PMC - PubMed