Review
. 2020 Feb 4;21(3):1020.
doi: 10.3390/ijms21031020.

Neuroimaging Biomarkers in SCA2 Gene Carriers

Affiliations
Review

Neuroimaging Biomarkers in SCA2 Gene Carriers

Mario Mascalchi et al. Int J Mol Sci. .

Abstract

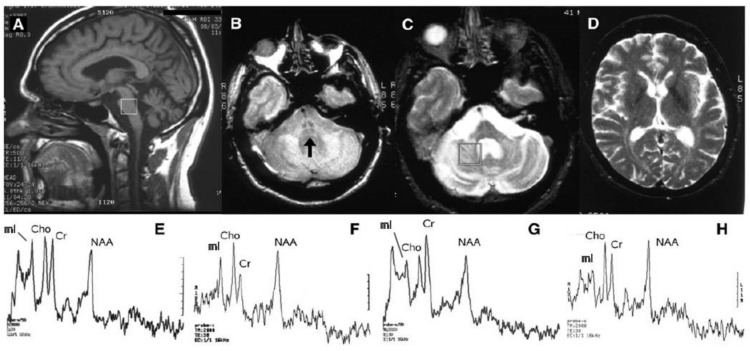
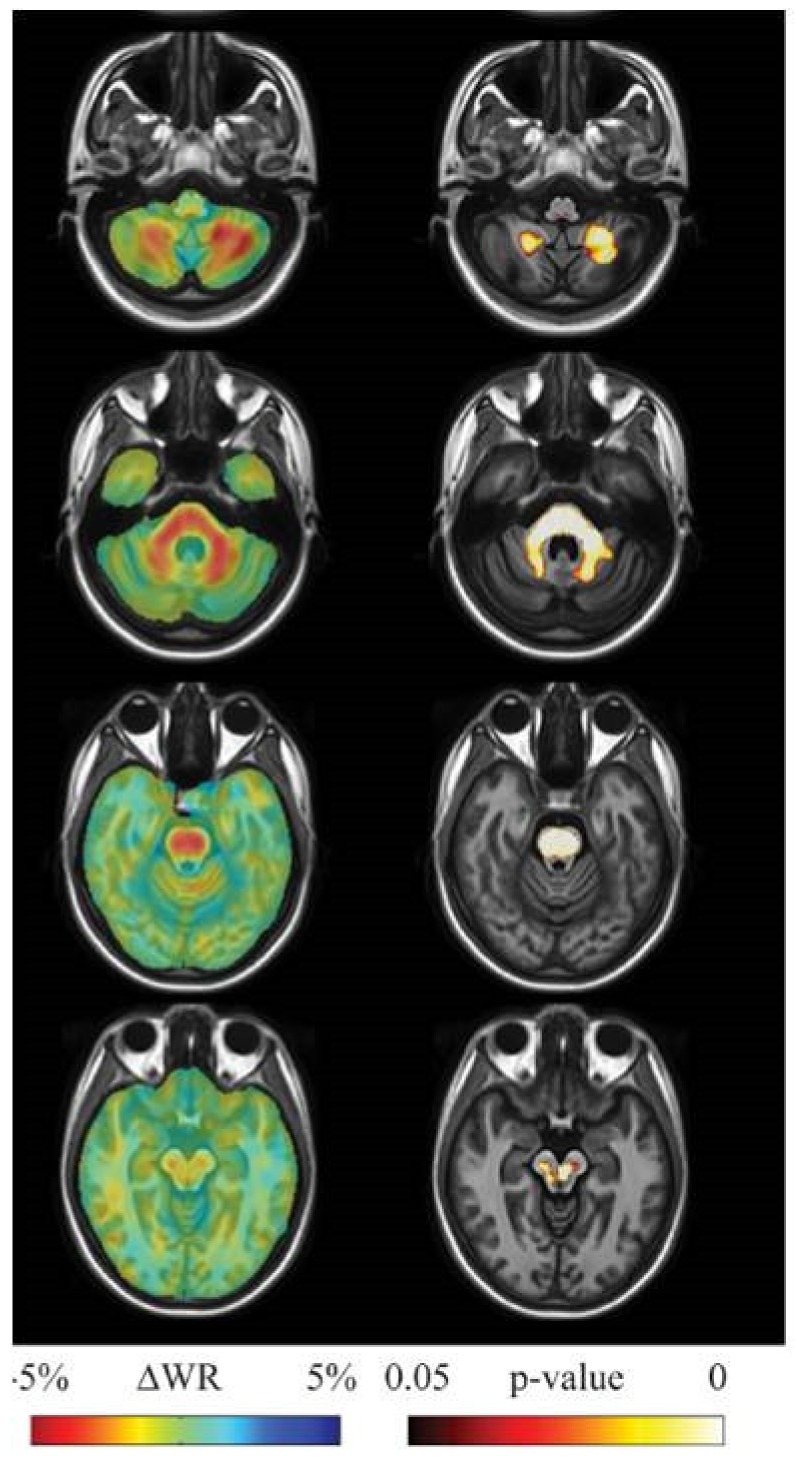
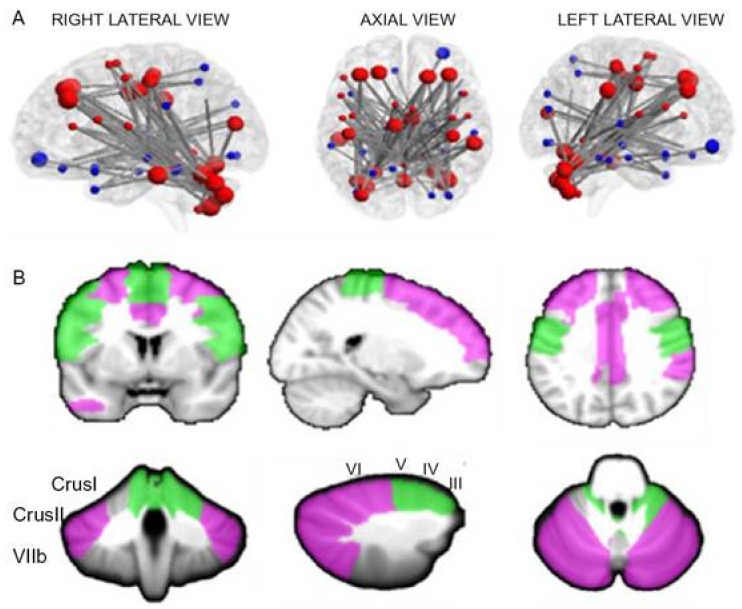
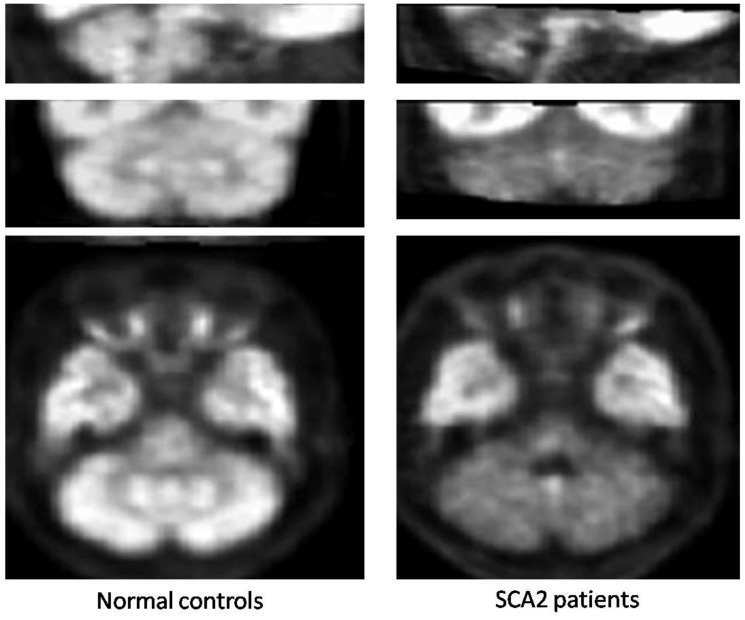
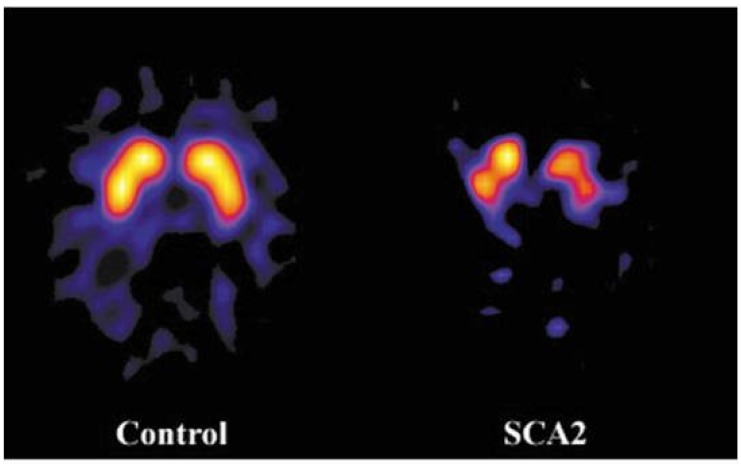
A variety of Magnetic Resonance (MR) and nuclear medicine (NM) techniques have been used in symptomatic and presymptomatic SCA2 gene carriers to explore,in vivo, the physiopathological biomarkers of the neurological dysfunctions characterizing the associated progressive disease that presents with a cerebellar syndrome, or less frequently, with a levodopa-responsive parkinsonian syndrome. Morphometry performed on T1-weighted images and diffusion MR imaging enable structural and microstructural evaluation of the brain in presymptomatic and symptomatic SCA2 gene carriers, in whom they show the typical pattern of olivopontocerebellar atrophy observed at neuropathological examination. Proton MR spectroscopy reveals, in the pons and cerebellum of SCA2 gene carriers,a more pronounced degree of abnormal neurochemical profile compared to other spinocerebellar ataxias with decreased NAA/Cr and Cho/Cr, increased mi/Cr ratios, and decreased NAA and increased mI concentrations. These neurochemical abnormalities are detectable also in presymtomatic gene carriers. Resting state functional MRI (rsfMRI) demonstrates decreased functional connectivity within the cerebellum and of the cerebellum with fronto-parietal cortices and basal ganglia in symptomatic SCA2 subjects. 18F-fluorodeoxyglucose Positron Emission Tomography (PET) shows a symmetric decrease of the glucose uptake in the cerebellar cortex, the dentate nucleus, the brainstem and the parahippocampal cortex. Single photon emission tomography and PET using several radiotracers have revealed almost symmetric nigrostriatal dopaminergic dysfunction irrespective of clinical signs of parkinsonism which are already present in presymtomatic gene carriers. Longitudinal small size studies have proven that morphometry and diffusion MR imaging can track neurodegeneration in SCA2, and hence serve as progression biomarkers. So far, such a capability has not been reported for proton MR spectroscopy, rsfMRI and NM techniques. A search for the best surrogate marker for future clinical trials represents the current challenge for the neuroimaging community.

Keywords: Key-words: spinocerebellar ataxia type 2; brainstem; cerebellum; magnetic resonance; nuclear medicine.


Conflict of interest statement

The authors declare no conflict of interest

Figures

Figure 1
Figure 1
MR imaging and proton MR spectroscopy in a symptomatic 41-year-old man with SCA2. Sagittal T1 weighted (A), axial proton density (B) and T2 weighted (C) images show a pattern consistent with olivopontocerebellar atrophy with evidence of the “cross sign” (arrow) in (B). The T2 signal in the basal ganglia (D) is normal. Proton MR spectroscopy (STEAM TR 2000 ms TE 30 ms) of 8 mL single voxels placed in the basis pontis (white square in A) of the SCA2 patient (E) and of a healthy control (F), and in the deep right cerebellar hemisphere (white square in C) of the SCA2 patient (G) and of the healthy control (H), show lower NAA/Cr, Cho/Cr and NAA/mI ratios in the SCA2 patient in both locations. Modified and reproduced with permission fromMascalchi M. and Vella A.: Magnetic resonance and nuclear medicine imaging in ataxias.Handb Clin Neurol 103: 85–110, 2012.
Figure 2
Figure 2
(A,B).Results of a meta-analysis of 5 VBM studies in 65 SCA2 gene carriers and 124 healthy controls. Panel A shows atrophy (in red) of the gray matter in bilateral cerebellar hemispheres, cerebellar vermis, the right fusiform gyrus, right parahippocampal gyrus and the right lingual gyrus. Panel B shows the atrophy (in red) of the white matter in bilateral cerebellar hemispheres, cerebellar vermis, middle cerebellar peduncles, pons and bilateral cortico-spinal projections. Reproduced from Han Q, Yang J, Xiong H and Shang H: Voxel-based meta-analysis of gray and white matter volume abnormalities in spinocerebellar ataxia type 2. Brain Behavior 8: e01099, 2018.
Figure 3
Figure 3
Volumetry in preclinical and manifest SCA2 gene carriers. The volumes of the brainstem (ii) comprising the mesencephalon (blue), pons (yellow) and medulla oblongata (orange), and the cerebellum (iii) (green), both normalized to the total intracranial volume (TICV) (i) (left panel), are significantly (** = p < 0.0001 and * = p < 0.05) lower in manifest and preclinical SCA2 gene carriers than in controls (right panel). Modified fromReetz K., Rodríguez-Labrada R., Dogan I, Mirzazade S., Romanzetti S., Schulz J.B., Cruz-Rivas E.M., Alvarez-Cuesta J.A., Aguilera Rodríguez R., Gonzalez Zaldivar Y., et al.: Brain atrophy measures in preclinical and manifest spinocerebellar ataxia type 2. Ann Clin Transl Neurol 5:128–137, 2018.
Figure 4
Figure 4
(AT). Tract-basedspatial statistical analysis of diffusion tensor imaging data in 10 SCA2 patients vs. 10 healthy controls. Maps show in red the clusters of significantly reduced fractional anisotropy in white matter tracts in the SCA2 patients. These include the inferior (B,C), middle (C,D) and superior (E,F) cerebellar peduncle, the cerebellar white matter (C,D,E,F), the medial and lateral lemnisci and the spinothalamic tracts (D,E,F), the transverse pontine fibres (D,E), the corticospinal tracts at the level of the internal capsule (J,K,L), cerebral peduncles (G,H,I), basis pontis (C,D) and bulbar pyramis (A,B), the corpus callosum (N,O,P,Q), the right inferior longitudinal fasciculus (I,J) and the inferior fronto-occipital fasciculus (I,J). Reproduced with permission from Della Nave R., Ginestroni A., Tessa C., Salvatore E., De Grandis D, Plasmati R, Salvi F, De Michele G, Dotti MT, Piacentini S, et al.: Brain white matter damage in SCA1 and SCA2. An in vivo study using voxel-based morphometry, histogram analysis of mean diffusivity and tract-based spatial statistics. NeuroImage 43: 10–19, 2008.
Figure 5
Figure 5
Results of longitudinal between group (10 SCA2 vs. 16 healthy controls, each examined with a mean interval of 3.3 years between initial and follow-up MRI) tensor-based morphometry analysis. Left panel: sample of axial views of the difference in average longitudinal warp rate (WR) maps between SCA2 patients and healthy controls, where red indicates local thinning and blue indicates local enlargement. Right panel: voxel-wise threshold-free cluster enhancement corrected p-value maps at the same levels, testing the null hypothesis of zero differences in WR between SCA2 patients and healthy controls. Highlighted clusters indicate significantly (p<0.05) accelerated volume loss in SCA2 patients when compared to healthy controls. SCA2 patients exhibit significantly accelerated volume loss in the midbrain (substantia nigra and medial lemniscus, bilaterally, right lateral lemniscus and central region corresponding to decussation of the superior cerebellar peduncles), the entire basis pontis, the middle cerebellar peduncles and posterior medulla corresponding to the gracilis and cuneatus tracts and nuclei. The cerebellum shows accelerated loss of the white matter in the hemispheric and peridentate regions and of the gray matter in the cerebellar cortex of the inferior portions of the cerebellar hemisphers. Reproduced from Mascalchi M, Diciotti S, Giannelli M, Ginestroni A, Soricelli A, Nicolai E, Aiello M, Tessa C, Galli L, Dotti MT, et al.: Progression of brain atrophy in SCA2. A longitudinal TBM study.PLoS One25; 9(2):e89410, 2014.
Figure 6
Figure 6
(A,B). Panel A shows the network of significantly decreased functional connectivity in 9 SCA2 patients compared to 33 healthy controls as assessed by network-based statistics analysis. The regions of the cerebello-cortical (red) and cortico-cortical (blue) modules are shown in different colors. Bigger nodes correspond to cerebellar and cortical regions relevant to cognition and emotion; smaller nodes correspond to cerebellar and cortical regions relevant to motor control. Panel B shows the anatomical representations of cognitive (violet) and motor (green) nodes in the cerebellum and cerebral cortex showing underconnectivity between each other. Reproduced from Olivito G, Cercignani M, Lupo M, Iacobacci C, Clausi S, Romano S, Masciullo M, Molinari M, Bozzali M, Leggio M:. Neural substrates of motor and cognitive dysfunctions in SCA2 patients: A network-based statistics analysis. NeuroImage Clin 14:719–725, 2017.
Figure 7
Figure 7
18F-fluorodeoxyglucose positron emission tomography in SCA2.Representative sagittal (top), coronal (mid) and axial (bottom) images of spatially normalized ratios of cerebellar to cerebral 18F-fluorodeoxyglucose uptake using study-specific templates in 89 normal controls (left panels) and 9 patients with SCA2 (right panels) show diffusely decreased hypometabolism in the cerebellar cortex and dentate nuclei (mid and bottom images). Note in the SCA2 patients, the decreased tracer uptake in the basis pontis and medulla oblongata as well (top and bottom images). Modified from Oh M, Kim JS, Oh JS, Lee CS, Chung SJ: Different subregional metabolism patterns in patients with cerebellar ataxia by 18F-fluorodeoxyglucose positron emission tomography. PLoS One 12: e0173275, 2017.
Figure 8
Figure 8
Axial [123I]FP-CIT single photon emission computed tomography scans at the level of the basal ganglia show marked and uniform reduction of the dopamine active transporter (DAT)tracer uptake in a symptomatic SCA2 gene carrier without parkinsonism (right) compared to a control subject (left).Modified and reproduced with permission from Varrone A, Salvatore E, De Michele G, Barone P, Sansone V, Pellecchia MT, Castaldo I, Coppola G, Brunetti A, Salvatore M, et al.: Reduced striatal [123 I]FP-CIT binding in SCA2 patients without parkinsonism. Ann Neurol 55: 426–430, 2004.

References

    1. Stoyas C.A., La Spada A.R. The CAG-polyglutamine repeat diseases: A clinical, molecular, genetic, and pathophysiologic nosology. Handb. Clin. Neurol. 2018;147:143–170. - PubMed
    1. Lastres-Becker I., Rub U., Auburg G. Spinocerebellar Ataxia 2 (SCA2) Cerebellum. 2008;7:115–124. doi: 10.1007/s12311-008-0019-y. - DOI - PubMed
    1. Ishida C., Komai K., Yonezawa K., Sakajiri K., Nitta E., Kawashima A., Yamada M. An autopsy case of an aged patient with spinocerebellar ataxia type 2. Neuropathology. 2011;31:510–518. doi: 10.1111/j.1440-1789.2010.01176.x. - DOI - PubMed
    1. Rub U., Schols L., Paulson H., Auburger G., Kermer P., Jen J.C., Seidel K., Korf H.W., Deller T. Clinical features, neurogenetics and neuropathology of the polyglutamine spinocerebellar ataxias type 1, 2, 3, 6 and 7. Progr. Neurobiol. 2013;104:38–66. doi: 10.1016/j.pneurobio.2013.01.001. - DOI - PubMed
    1. Koeppen A. The neuropathology of the adult cerebellum. Hand. Clin. Neurol. 2018;154:129–149. - PMC - PubMed