

Is Sensible Heat Flux Useful for the Assessment of Thermal Vulnerability in Seoul (Korea)?
- PMID: 32033178
- PMCID: PMC7037179
- DOI: 10.3390/ijerph17030963
Is Sensible Heat Flux Useful for the Assessment of Thermal Vulnerability in Seoul (Korea)?
Abstract
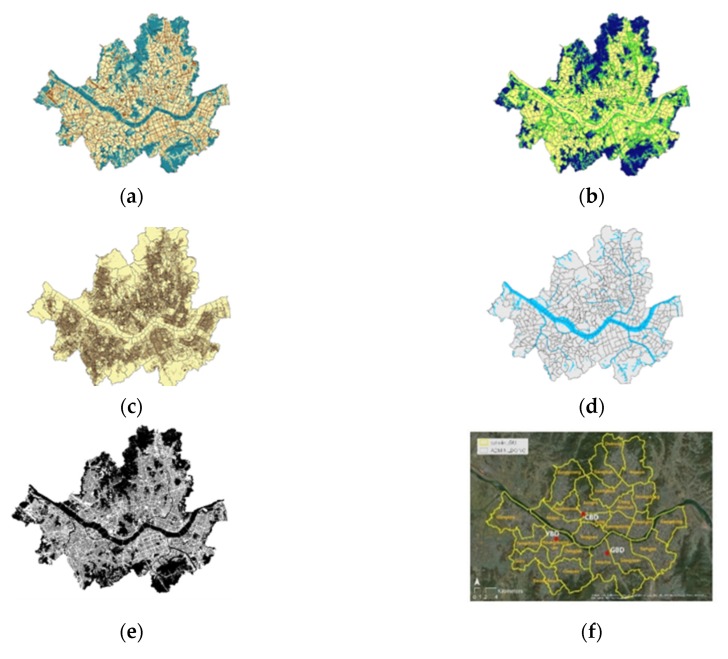
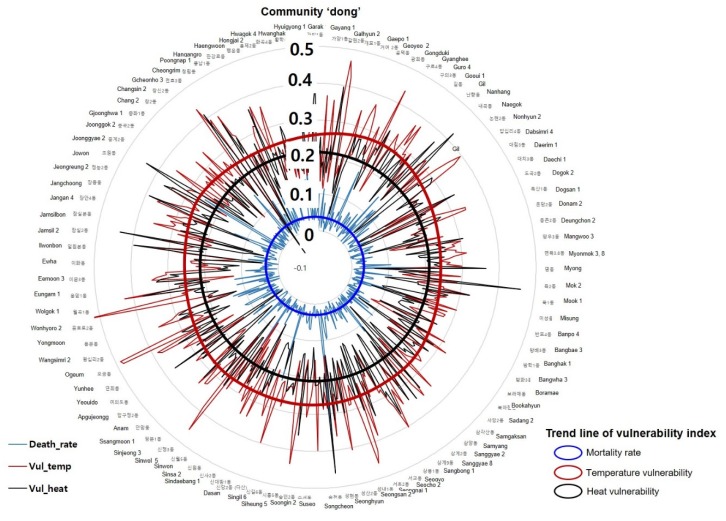
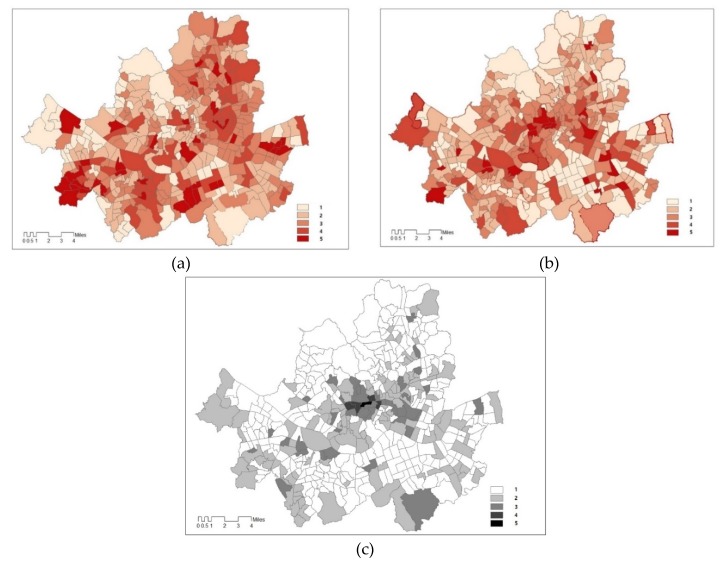
Climate change has led to increases in global temperatures, raising concerns regarding the threat of lethal heat waves and deterioration of the thermal environment. In the present study, we adopted two methods for spatial modelling of the thermal environment based on sensible heat and temperature. A vulnerability map reflecting daytime temperature was derived to plot thermal vulnerability based on sensible heat and climate change exposure factors. The correlation (0.73) between spatial distribution of sensible heat vulnerability and mortality rate was significantly greater than that (0.30) between the spatial distribution of temperature vulnerability and mortality rate. These findings indicate that deriving thermally vulnerable areas based on sensible heat are more objective than thermally vulnerable areas based on existing temperatures. Our findings support the notion that the distribution of sensible heat vulnerability at the community level is useful for evaluating the thermal environment in specific neighbourhoods. Thus, our results may aid in establishing spatial planning standards to improve environmental sustainability in a metropolitan community.
Keywords: health; heat vulnerability index; heat-related mortality rate; sensible heat flux; sensible heat vulnerability; thermal comfort and health; thermal environment; urban heat island effect.
Conflict of interest statement
The authors declare no conflicts of interest. The funding bodies had no role in the design of the study; in the collection, analyses, and interpretation of data; in the writing of the manuscript; or in the decision to publish the results.
Figures
Similar articles
-
Quantification and evaluation of intra-urban heat-stress variability in Seoul, Korea.Int J Biometeorol. 2019 Jan;63(1):1-12. doi: 10.1007/s00484-018-1631-2. Epub 2018 Nov 20. Int J Biometeorol. 2019. PMID: 30460432
-
A Spatial Framework to Map Heat Health Risks at Multiple Scales.Int J Environ Res Public Health. 2015 Dec 18;12(12):16110-23. doi: 10.3390/ijerph121215046. Int J Environ Res Public Health. 2015. PMID: 26694445 Free PMC article.
-
Urban heat vulnerability: A dynamic assessment using multi-source data in coastal metropolis of Southeast China.Front Public Health. 2022 Oct 20;10:989963. doi: 10.3389/fpubh.2022.989963. eCollection 2022. Front Public Health. 2022. PMID: 36339225 Free PMC article.
-
Effect modification of individual- and regional-scale characteristics on heat wave-related mortality rates between 2009 and 2012 in Seoul, South Korea.Sci Total Environ. 2017 Oct 1;595:141-148. doi: 10.1016/j.scitotenv.2017.03.248. Epub 2017 Apr 3. Sci Total Environ. 2017. PMID: 28384570 Review.
-
Mapping Heat Vulnerability and Heat Risk for Neighborhood Health Risk Management in Urban Environment? Challenges and Opportunities.Curr Environ Health Rep. 2025 Feb 24;12(1):14. doi: 10.1007/s40572-025-00478-7. Curr Environ Health Rep. 2025. PMID: 39992351 Review.
References
-
- Joel E. Cohen Human Population: The Next Half Century. Science (80-.) 2003;302:1172–1175. - PubMed
-
- Chen H., Ooka R., Harayama K., Kato S., Li X. Study on outdoor thermal environment of apartment block in Shenzhen, China with coupled simulation of convection, radiation and conduction. Energy Build. 2004;36:1247–1258. doi: 10.1016/j.enbuild.2003.07.003. - DOI
-
- Niyogi D., Chen F., Yang L., Ni G., Tewari M., Tian F., Aliaga D. Contrasting impacts of urban forms on the future thermal environment: Example of Beijing metropolitan area. Environ. Res. Lett. 2016;11:034018.
-
- Baker L.A., Brazel A.J., Selover N., Martin C., McIntyre N., Steiner F.R., Nelson A., Musacchio L. Urbanization and warming of Phoenix (Arizona, USA): Impacts, feedbacks and mitigation. Urban Ecosyst. 2002;6:183–203. doi: 10.1023/A:1026101528700. - DOI
Publication types
MeSH terms
LinkOut - more resources
Full Text Sources
Medical
