. 2020 Feb 4;10(2):236.
doi: 10.3390/biom10020236.

Permanent Photodynamic Activation of the Cholecystokinin 2 Receptor

Affiliations

Permanent Photodynamic Activation of the Cholecystokinin 2 Receptor

Wen Zhu Tang et al. Biomolecules. .

Abstract

The cholecystokinin 2 receptor (CCK2R) is expressed in the central nervous system and peripheral tissues, playing an important role in higher nervous and gastrointestinal functions, pain sensation, and cancer growth. CCK2R is reversibly activated by cholecystokinin or gastrin, but whether it can be activated permanently is not known. In this work, we found that CCK2R expressed ectopically in CHO-K1 cells was permanently activated in the dark by sulfonated aluminum phthalocyanine (SALPC / AlPcS4, 10-1,000 nM), as monitored by Fura-2 fluorescent calcium imaging. Permanent CCK2R activation was also observed with AlPcS2, but not PcS4. CCK2R previously exposed to SALPC (3 and 10 nM) was sensitized by subsequent light irradiation (> 580 nm, 31.5 mW·cm-2). After the genetically encoded protein photosensitizer mini singlet oxygen generator (miniSOG) was fused to the N-terminus of CCK2R and expressed in CHO-K1 cells, light irradiation (450 nm, 85 mW·cm-2) activated in-frame CCK2R (miniSOG-CCK2R), permanently triggering persistent calcium oscillations blocked by the CCK2R antagonist YM 022 (30 nM). From these data, it is concluded that SALPC is a long-lasting CCK2R agonist in the dark, and CCK2R is photogenetically activated permanently with miniSOG as photosensitizer. These properties of SALPC and CCK2R could be used to study CCK2R physiology and possibly for pain and cancer therapies.

Keywords: CCK2R; SALPC; calcium oscillations; miniSOG; photodynamic action.


Conflict of interest statement

The authors declare no conflicts of interest. The funders had no role in the design of the study; in the collection, analyses, or interpretation of data; in the writing of the manuscript, or in the decision to publish the results.

Figures
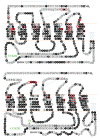
Figure A1
Figure A1
Plasma membrane topology of hCCK1R (upper panel) and hCCK2R (lower panel). Black circles filled with white letters indicate identical residues, gray circles indicate homologous residues. The dashed lines indicate disulfide bonds. Residues essential for agonist binding or CCK2R activation are in red boxes [69]. Blue letters indicate residues that play a key role in receptor activation and readily oxidized by 1O2 [70]. The green arrow in the lower panel indicates a site where a sequence of 69 residues is inserted due to a mis-spliced intron 4 [79].
Figure 1
Figure 1
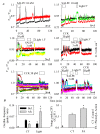
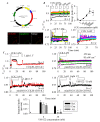
Ectopic expression of cholecystokinin 2 receptors (CCK2R) in CHO-K1 cells. (A) CHO-K1 cells were transfected with plasmid pCCK2R (Aa), and 48 h after transfection, CCK2R-CHO-K1 cells were fixed and attached to coverslips, incubated sequentially with primary goat anti-CCK2R antibody and TRITC-conjugated donkey antigoat secondary antibody (red), and counterstained with nuclear dye (Hoechst 33342, blue) before confocal imaging (Ac). Shown here are fluorescent and merged brightfield images. The controls (with only secondary antibody) done in CCK2R-CHO-K1 cells did not show any fluorescence (Ab). Confocal images were taken in a Zeiss LSM 510 META (objective 63×/1.40 oil) with λex: TRITC/543 nm and Hoechst 33342/405 nm. Scale bars 10 μm. (B) CCK2R-CHO-K1 cells loaded with Fura-2 AM were attached to coverslips forming the bottom part of a Sykes–Moore perfusion chamber, perifused, and exposed to CCK at 1 (Ba), 3 (Bb), 10 (Bc), 30 (Bd), 100 (Be), and 300 pM (Bf) as indicated by the horizontal bars. (Bg) CCK2R-CHO-K1 cells were stimulated sequentially with CCK at 1, 3, 10, 30, 100, and 300 pM. (Bh) A quantitative analysis was performed, and the calcium peak areas above the baseline in (Ba–Bf) were calculated (from 10–30 min, black curve). The calcium peak areas above the baseline in (Bg) were calculated for 10 min periods (10–20, 30–40, 50–60, 70–80, 90–100, and 110–120 min, red curve). (C) CCK2R-CHO-K1 cells loaded with Fura-2 AM were attached to the coverslip bottoms of Sykes–Moore perfusion chambers, perifused, and exposed to CCK 30 pM and YM 022 at 0 (Ca), 3 (Cb), 10 (Cc), and 30 nM (Cd), as indicated. (Ce) A quantitative analysis was done for the original tracings shown in (Ca–Cd); the number of calcium peaks per 10 min before, during, and after perfusion of YM 022 is presented. Student’s T-test was performed, statistically significant difference is indicated by an asterisk (*) at p < 0.05. Representative calcium tracings from N identical experiments (N = 3–4) are shown in (BaBg, CaCd).
Figure 2
Figure 2
Phthalocyanine molecules SALPC (AlPcS4) and AlPcS2, but not PcS4 activated CCK2R in the dark to trigger calcium oscillations in CCK2R-CHO-K1 cells. CCK1R-CHO-K1 (a), CCK2R-CHO-K1 (bo), and CHO-K1 (p) cells loaded with Fura-2 AM were attached to coverslips forming the bottom part of Sykes–Moore chambers and perifused. CCK 30 pM and SALPC 2 μM (a), SALPC 3 nM (b), 10 nM (c), 30 nM (d), 100 nM (e), 300 nM (f), or 1000 nM (g); CCK 3 nM (h); PcS4 1 μM (i); PcS4 10 μM (j); AlPcS2 1 nM (k); AlPcS2 10 nM (l); AlPcS2 100 nM (m); AlPcS2 1000 nM (n); or AlPcS2 10,000 nM (o) plus CCK 3 nM (io), or SALPC 1 µM (p) were added as indicated by the horizontal bars. Note the lack of any effect of SALPC 1 µM on parental CHO-K1 cells not transfected with CCK2R (p). Quantitative analysis was done for the experiments shown in (bo), and the calculated peak area above baseline is presented (q). Representative calcium tracings from one of N identical experiments (N = 3–4) are shown in (ap).
Figure 3
Figure 3
SALPC photodynamic sensitization of CCK2R in CCK2R-CHO-K1 cells. CCK2R-CHO-K1 cells loaded with Fura-2 AM were attached and perifused. CCK 30 pM and SALPC 3 or 10 nM and red light irradiation (λ > 580 nm, 31.5 mW·cm−2) were applied as indicated by the horizontal bars. (Aa) SALPC 10 nM, no light. (Ab) SALPC 10 nM, red light (>580 nm, 31.5 mW·cm−2, 5 min). (Ac) CCK 30 pM, SALPC 3 nM, red light (λ > 580 nm, 31.5 mW·cm−2, 90 s). (Ad) CCK 30 pM, SALPC 3 nM, red-light irradiation (λ > 580 nm, 31.5 mW·cm−2, 5 min). (Ae) CCK 30 pM. (Af) CCK 30 pM, SALPC 3 nM, red-light irradiation (λ > 580 nm, 31.5 mW·cm−2, 5 min), CCK 30 pM. (Ba) The number of calcium peaks per unit time (calcium oscillation frequency) before illumination (5–55 min, Bef.), after illumination (60–110 min, Aft.), or during corresponding time periods without illumination was quantified. (Bb) The ratio of the calculated peak area above baseline (S2/S1 of CCK stimulation) in (Ae,Af) is presented. Student’s t-test was done, statistically significant difference is indicated by an asterisk (*) at p < 0.05. Representative calcium tracings from one of N identical experiments (N = 3–4) are shown in (AaAf).
Figure 4
Figure 4
The miniSOG photodynamic activation of CCK2R in CCK2R-CHO-K1 cells. (A) CHO-K1 cells were transfected with plasmid pminiSOG-CCK2R (Aa). Twenty four (24) h after transfection, miniSOG-CCK2R-CHO-K1 cells were fixed and incubated sequentially with primary goat anti-CCK2R antibody and TRITC-conjugated donkey antigoat secondary antibody (red), before confocal imaging done (Ab). Fluorescent and merged brightfield images are shown. Confocal images were taken on a Zeiss LSM 510 META (objective 63×/1.40 oil) with λex TRITC/543 nm and λex 488 nm. Scale bars are 10 μm. (B) Here, miniSOG-CCK2R-CHO-K1 or CCK2R-CHO-K1 cells loaded with Fura-2 AM were attached to coverslips of Sykes–Moore perfusion chambers and perifused. CCK at 3, 30, 300, 3000, or 30,000 pM, blue-light irradiation (450 nm, 85 mW·cm−2), and YM 022/30 nM were applied as indicated by the horizontal bars. (Ba) CCK at 3, 30, 300, 3000, or 30,000 pM. (Bb) A quantitative analysis was done for the experiments shown in (Ba): the calcium peak areas above baseline were calculated and plotted in terms of CCK stimulation per 10 min (5–15, 25–35, 45–55, 65–75, and 85–95 min). (Bc) Tandem doses of CCK 3 nM. (Bd) Continuous CCK at 3 nM (1 h); (C) miniSOG photodynamic activation of CCK2R. (Ca) CCK 3 nM and blue-light irradiation (450 nm, 85 mW·cm−2, 90 s) in CCK2R-CHO-K1 cells. (CbCd) CCK 3 nM (Cb), CCK 3 nM, and blue-light irradiation (450 nm, 85 mW·cm−2, 90 s) in miniSOG-CCK2R-CHO-K1 cells (Cc). CCK 3 nM, blue-light irradiation (450 nm, 85 mW·cm−2, 90 s), and YM 022/30 nM in miniSOG-CCK2R-CHO-K1 cells (Cd). (Ce) Quantitative analysis was performed for the calcium tracings shown in (Cc,Cd), calcium peak area above the baseline per unit time before, during, and after perfusion with YM 022 was calculated. Student’s t-test was done, and statistically significant difference is indicated by an asterisk (*) at p < 0.05. Representative calcium tracings from one of N identical experiments (N = 3–8) are shown in (Ba,Bc,Bd,CaCd).
Figure 5
Figure 5
Comparisons of TM3 in CCK1R, CCK2R, M3R, and TRH1R. The TM3 sequences of CCK1R and CCK2R are from Reference [70], and the sequences of M3R and TRH1R are from the National Library of Medicine database (https://www.ncbi.nlm.nih.gov/pubmed) (NP_001334645.1 and NP_003292.1, respectively). M3R: M3 acetylcholine receptor; TRH1R: thyrotropin releasing hormone receptor 1; TM3, transmembrane domain 3; ECL1: extracellular loop 1; ICL2: intracellular loop 2.
Figure 6
Figure 6
SALPC in the dark and miniSOG photodynamic action permanently activated CCK2R. (1) SALPC in the dark as an agonist for CCK2R to trigger persistent calcium oscillations in CCK2R-CHO-K1 cells. (2) The miniSOG photodynamic activation of CCK2R (miniSOG-CCK2R) elicited persistent calcium oscillations in miniSOG-CCK2R-CHO-K1 cells. Gq, G protein; PLC, phospholipase C; IP3R, IP3 receptor/channel complex; ER, endoplasmic reticulum. SALPC irradiated with light > 580 nm and miniSOG at 450 nm. 1O2 was produced in photodynamic action with miniSOG.

Similar articles

Cited by

References

    1. Noble F., Roques B.P. CCK-B receptor: Chemistry, molecular biology, biochemistry and pharmacology. Prog. Neurobiol. 1999;58:349–379. doi: 10.1016/S0301-0082(98)00090-2. - DOI - PubMed
    1. Sherrin T., Heng K.Y.C., Zhu Y.Z., Tang Y.M., Lau G., Tan C.H. Cholecystokinin-B receptor gene expression in cerebellum, pre-frontal cortex and cingulate gyrus and its association with suicide. Neurosci. Lett. 2004;357:107–110. doi: 10.1016/j.neulet.2003.11.072. - DOI - PubMed
    1. Rehfeld J.F., Friis-Hansen L., Goetze J.P., Hansen T.V.O. The biology of cholecystokinin and gastrin peptides. Curr. Top. Med. Chem. 2007;7:1154–1165. doi: 10.2174/156802607780960483. - DOI - PubMed
    1. Tang N., Zhang X., Wang S., Qi J., Tian Z., Wang B., Chen H., Wu Y., Wang M., Xu S., et al. UCN3 suppresses food intake in coordination with CCK and the CCK2R in Siberian sturgeon (Acipenser baerii) Comp. Biochem. Physiol. Part A Mol. Integr. Physiol. 2019;234:106–113. doi: 10.1016/j.cbpa.2019.04.022. - DOI - PubMed
    1. Hernandez-Gómez A.M., Aguilar-Roblero R., De La Mora M.P. Role of cholecystokinin-A and cholecystokinin-B receptors in anxiety. Amino Acids. 2002;23:283–290. doi: 10.1007/s00726-001-0139-x. - DOI - PubMed

Publication types

LinkOut - more resources