. 2020 Feb 5;17(3):1005.
doi: 10.3390/ijerph17031005.

Exposure of CuO Nanoparticles Contributes to Cellular Apoptosis, Redox Stress, and Alzheimer's Aβ Amyloidosis

Affiliations

Exposure of CuO Nanoparticles Contributes to Cellular Apoptosis, Redox Stress, and Alzheimer's Aβ Amyloidosis

Ying Shi et al. Int J Environ Res Public Health. .

Abstract

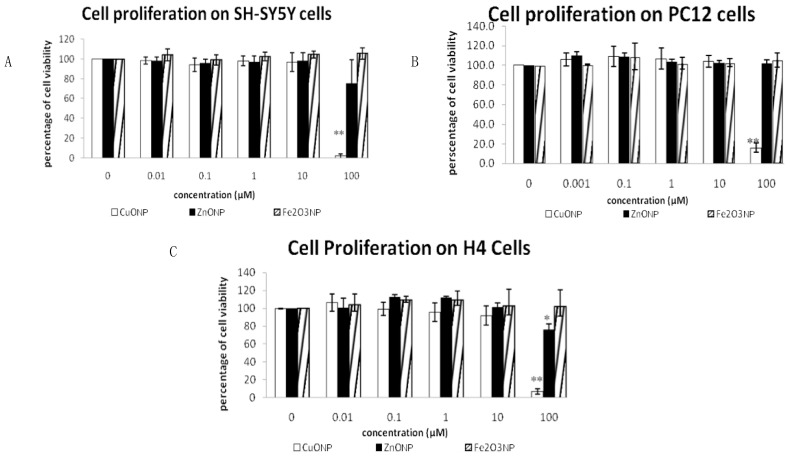
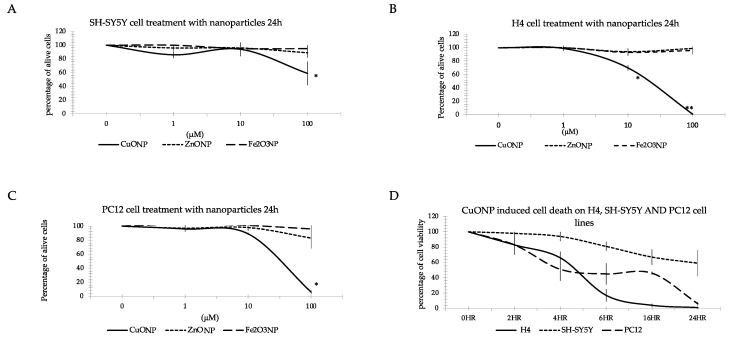
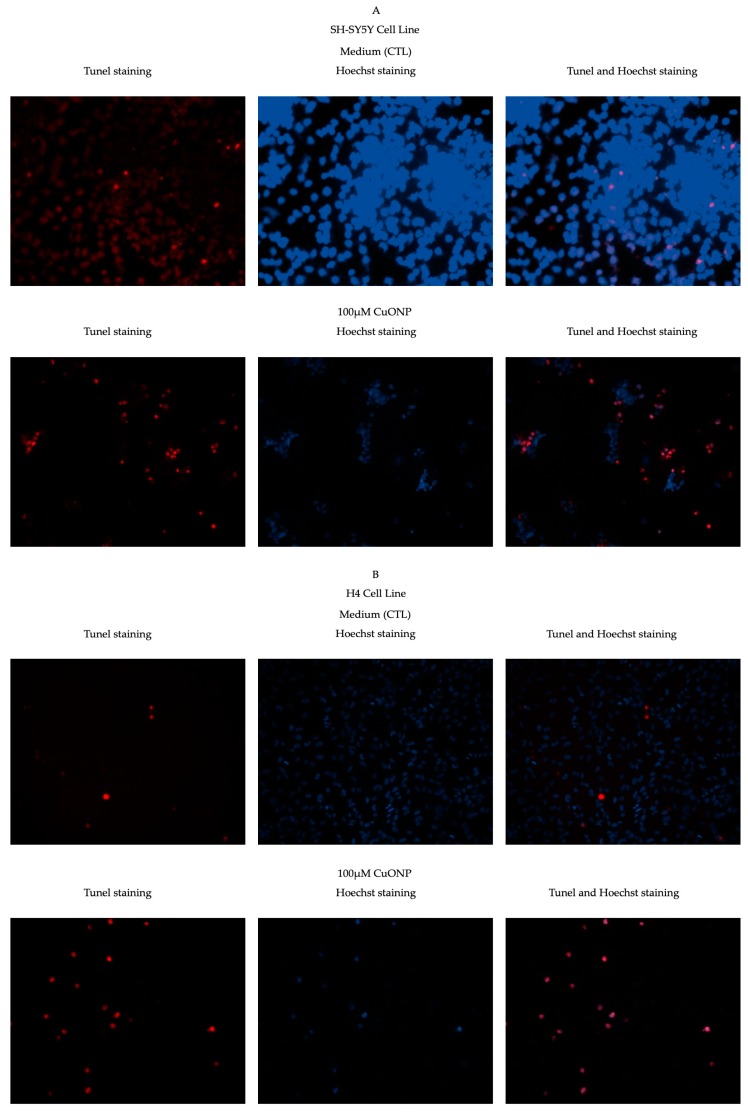
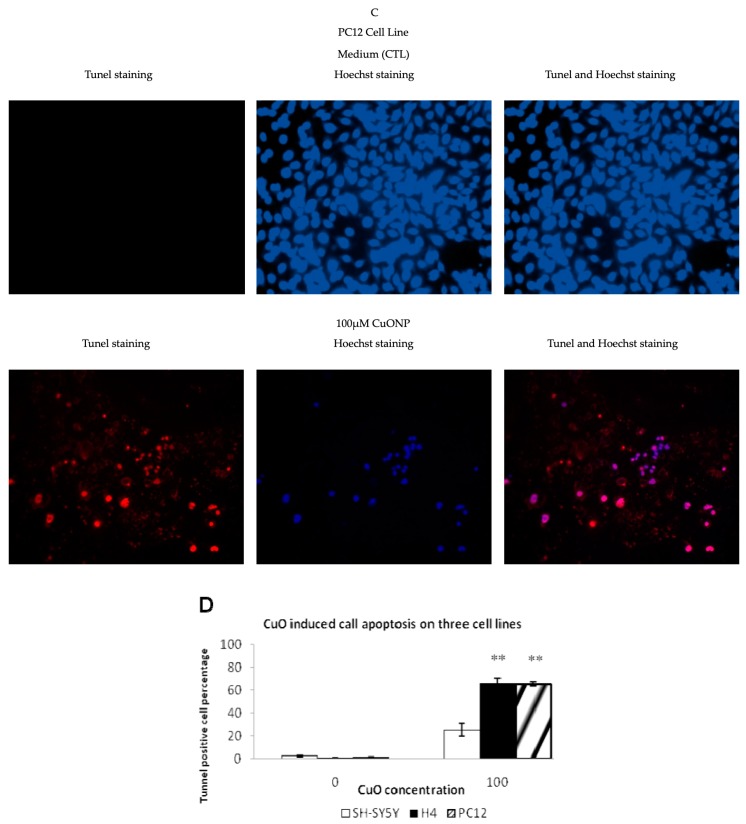
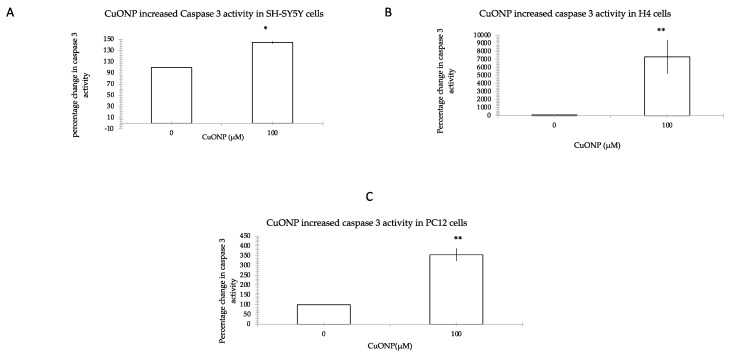
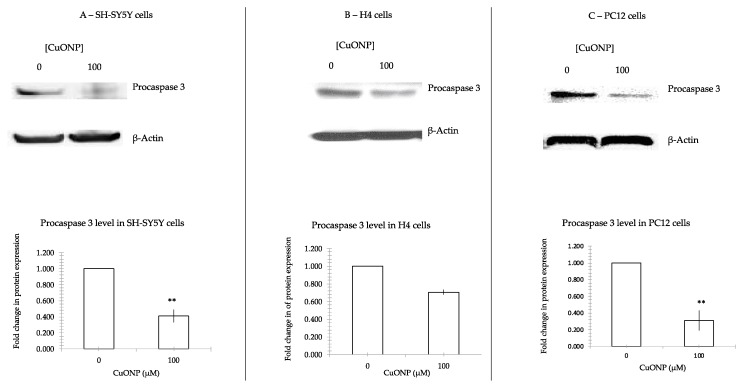
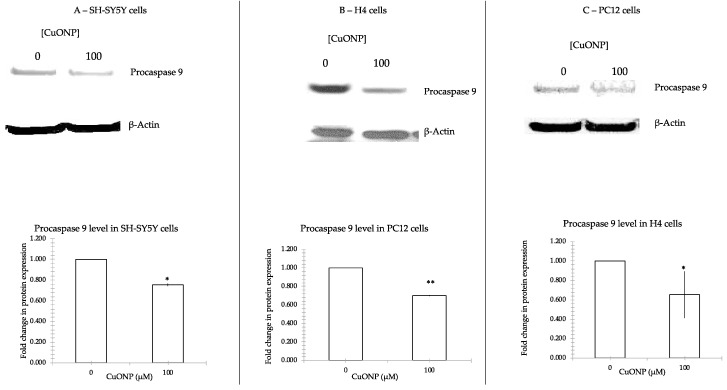
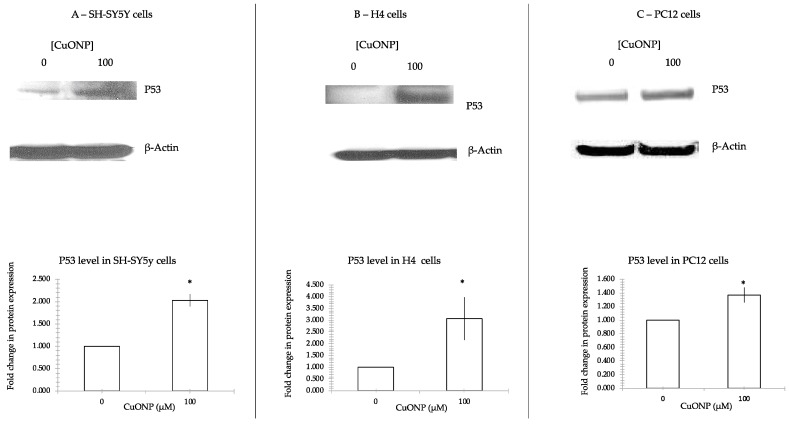
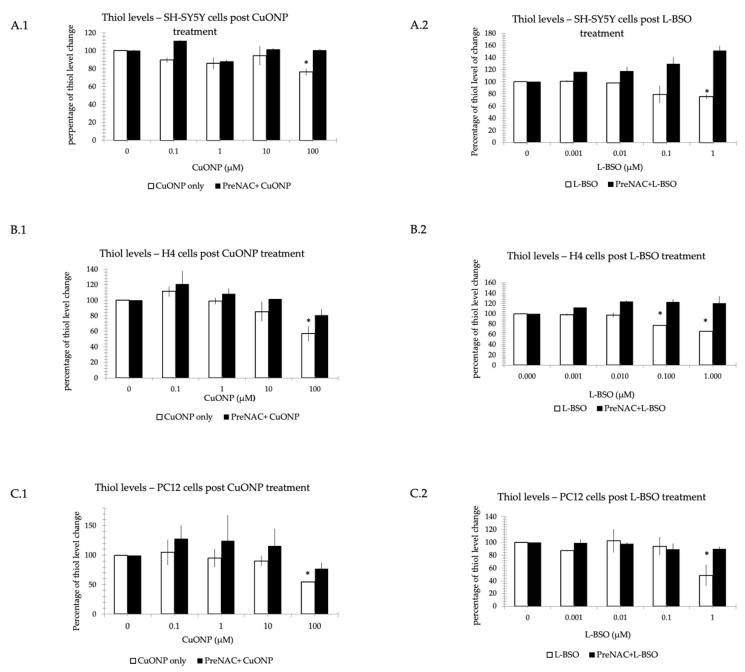
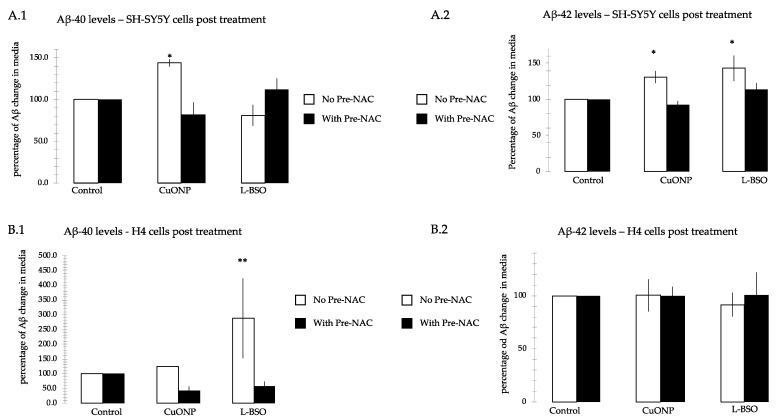
Fe2O3, CuO and ZnO nanoparticles (NP) have found various industrial and biomedical applications. However, there are growing concerns among the general public and regulators about their potential environmental and health impacts as their physio-chemical interaction with biological systems and toxic responses of the latter are complex and not well understood. Herein we first reported that human SH-SY5Y and H4 cells and rat PC12 cell lines displayed concentration-dependent neurotoxic responses to insults of CuO nanoparticles (CuONP), but not to Fe2O3 nanoparticles (Fe2O3NP) or ZnO nanoparticles (ZnONP). This study provides evidence that CuONP induces neuronal cell apoptosis, discerns a likely p53-dependent apoptosis pathway and builds out the relationship between nanoparticles and Alzheimer's disease (AD) through the involvement of reactive oxygen species (ROS) and increased Aβ levels in SH-SY5Y and H4 cells. Our results implicate that exposure to CuONP may be an environmental risk factor for AD. For public health concerns, regulation for environmental or occupational exposure of CuONP are thus warranted given AD has already become a pandemic.

Keywords: Alzheimer’s disease; Aβ; apoptosis; engineered nanomaterials; nanoparticles; reactive oxygen species.


Conflict of interest statement

The authors declare no conflict of interest.

Figures

Figure 1
Figure 1
MTS assay. Effects of three nanoparticle in three cell lines: SH-SY5Y (A), H4 (B) and PC12 (C). Cells were plated in 96-well plate. The medium and fresh compound solutions were added after 24 h plating. After treated 48 h, cell viability was assessed by the MTS assay kit. Data are expressed as percentage of viable cells (mean ± SEM of three separate experiments, each experiment was performed in triplicate). * p < 0.05, ** p < 0.01.
Figure 2
Figure 2
Trypan Blue staining. Effects of three nanoparticles in three cell lines: SH-SY5Y (A), H4 (B), and PC12 (C). Cells were plated in 24-well plate. The medium and fresh compound solutions were added after 24 h plating. After treated with the three NPs of CuONP, ZnONP and Fe2O3NP by the designed time, cells were harvested and resuspended it with medium and 0.4% Trypan Blue with a ratio of 1:2. We counted living cells by under microscope and compared with the control. Data are expressed as percentage of viable cells (mean ± SEM of three separate experiments, each performed in triplicate). * p < 0.05, ** p < 0.01.
Figure 3
Figure 3
TdT-mediated dUTP nick-end labeling (TUNEL) staining. CuONP induced cell apoptosis in three cell lines: SH-SY5Y (A), H4 (B), and PC12 (C). Panel left: TUNEL staining, middle: Hoechst staining, and right: combination of TUNEL and Hoechst staining. Cells were plated in 8-chamber slides. The medium and fresh compound solutions were added after 24 h plating. After treatment with CuONP for 24 h, cells were fixed, permeabilized, and then incubated with terminal deoxynuceotydyl transferase. For total cell counting, cells were stained by Hoechst. Pictures were taken with a fluorescent microscope and numbers of TUNEL-positive cells were counted; (D) percentage of TUNEL positive cells in total cells in the three cell lines. ** p < 0.01.
Figure 3
Figure 3
TdT-mediated dUTP nick-end labeling (TUNEL) staining. CuONP induced cell apoptosis in three cell lines: SH-SY5Y (A), H4 (B), and PC12 (C). Panel left: TUNEL staining, middle: Hoechst staining, and right: combination of TUNEL and Hoechst staining. Cells were plated in 8-chamber slides. The medium and fresh compound solutions were added after 24 h plating. After treatment with CuONP for 24 h, cells were fixed, permeabilized, and then incubated with terminal deoxynuceotydyl transferase. For total cell counting, cells were stained by Hoechst. Pictures were taken with a fluorescent microscope and numbers of TUNEL-positive cells were counted; (D) percentage of TUNEL positive cells in total cells in the three cell lines. ** p < 0.01.
Figure 4
Figure 4
Caspase 3 activity assay. CuONP induced cell apoptosis by activating caspase 3 in three cell lines: SH-SY5Y (A), H4 (B), and PC12 (C). After treatment with CuONP, cells were harvested by assay buffer. Then, 2.0 × 10⁶ cells were lysed using assay. The caspase 3 fluorometric substrate (Ac-Asp-Glu-Val-Asp-AMC) was added to the lysate. We measured the fluorescence of the cleavage product over time at room temperature for 1 h and 30 min. Maximal enzyme activity (Vmax) was calculated and expressed as relative fluorescence units/second. Comparison with the control, percentage of increasing caspase 3 activity was calculated. * p < 0.05, ** p < 0.01.
Figure 5
Figure 5
Procaspase 3 protein expression. CuONP activates cell apoptosis pathway by auto-cleaving procaspase 3 into active caspase 3. We incubated CuONP of 100 μM with three lines of cells: SH-SY5Y (A), H4 (B), and PC12 (C). Cells were plated in 60 mm dish and treated with CuONP for 6 h in H4 and PC12 cells, and 16 h in SH-SY5Y cells. Cells were subjected to lyses in a RIPA buffer. The same amount of protein was run in 4%–12% Tris-Bis gel electro-transferred to nitrocellulose membrane. After being washed with PBST, the membranes were incubated with the first antibody 1:200 overnight and the secondary antibody 1:5000 for 2 h and developed a film by detection kit. The membranes were stripped by stripped buffer and re-incubated with first antibody actin to control the protein amounts. The films were scanned, and densities were analyzed by NIH ImageJ software. ** p < 0.01.
Figure 6
Figure 6
Procaspase 9 protein expression. CuONP activates cell apoptosis pathway by auto-cleaving procaspase 9 into active caspase 9. We incubated CuONP 100 μM with three cell lines: SH-SY5Y (A), H4 (B), and PC12 (C). The same amount of protein was run in 4%–12% Tris-Bis gel and electro-transferred. The membranes were incubated with the first antibody 1:200 overnight and the secondary antibody 1:5000 for 2 h and developed a film by detection kit. The membranes were stripped by stripped buffer and re-incubated with the first antibody β-Actin as a control for the protein loading. The films were scanned and densities were analyzed by NIH ImageJ software (NIH, Bethesda, MD, USA). * p < 0.05, ** p < 0.01.
Figure 7
Figure 7
p53 protein expression. CuONP activated p53 and induced cell apoptosis. We incubated CuONP at 100μM with three cell lines: SH-SY5Y (A), H4 (B), and PC12 (C). Cells were plated in 60 mm dish and treated with CuONP for 6 h in H4 and PC12 cells, and 16 h in SH-SY5Y cells. Cells were subjected to lyses in a RIPA buffer. The same amount of protein was run in 4%–12% Tris-Bis gel electro-transferred to nitrocellulose membrane. After washing with PBST, the membranes were incubated with the first antibody p53 1:1000 overnight and the secondary antibody 1:5000 for 2 h and developed a film by detection kit. The membranes were stripped by stripping buffer and re-incubated with the first antibody β-Actin as control for the protein loading. After incubation with enhanced chemiluminescence (ECL) solution, membranes were imaged and densities were analyzed by NIH ImageJ software. * p < 0.05.
Figure 8
Figure 8
Thiol level reduction assay. Nanoparticles reduced thiol level. We incubated CuONP (CuONP: 0.1 to 100 μM or L-BSO: 0.001 to 1 μM) with three cell lines: SH-SY5Y (A), H4 (B), and PC12 (C): A.1, B.1, C.1 cells were treated by CuONP, and L-BSO was incubated with cells showed on A.2, B.2, C.2. Cells were treated by n-acetyl cysteine (NAC) 5 mM for 1 h, then were added into CuO or L-BSO of different concentrations separately. Cells were plated into 6-well plate and treated with CuONP or L-BSO: 6 h on H4 and PC12 cells, and 16 h on SH-SY5Y cells. Then, 2 × 10⁵ was harvested and washed with PBS twice. Cells were subjected to lyses in 200 μL lysis buffer. Mixture dye and cell lysates were added into 96-well black plate. The plate was read immediately with excitation at 485 nm and emission at 538 nm. The percentage of fluorescent changes were calculated. * p < 0.05.
Figure 9
Figure 9
Aβ40 and Aβ42 ELISA. We measured Aβ40 and Aβ42 levels in cell media after treatment with CuONP at 100 μM and L-BSO at 1 μM, and they were also measured when cells were pretreated with NAC for 1 h, followed by treatment of CuONP and L-BSO, respectively. Measurements were taken of SY5Y(A) levels for Aβ40 (A.1) and Aβ42 (A.2) and of H4 levels for Aβ40 (B.1) and Aβ42 (B.2). Aβ40 and Aβ42 levels were increased by treatment with CuONP, and only Aβ42 was increased by treatment with L-BSO on SH-SY5Y cells; Aβ40 level was increased by treatment with CuONP and L-BSO, but not Aβ42. Cells were plated into 6-well plate and treated with CuONP or L-BSO in 1.5 mL media: 6 h on H4 cells, and 16 h on SH-SY5Y cells. Media were harvested and spun down. The supernatants were saved for ELISA assay. For assay, samples were mixed with antibody according to the protocol and incubated overnight. Substrates were added into the plate and read with luminescent reader. The percentage of fluorescent changes were calculated. * p < 0.05, ** p < 0.01.

Similar articles

Cited by

References

    1. ASTM E2456-06, Standard Terminology Relating to Nanotechnology. [(accessed on 23 January 2020)]; Available online: https://statnano.com/standard/astm/1121.
    1. Stone V., Johnston H., Clift M.J.D. Air pollution, ultrafine and nanoparticle toxicology: Cellular and molecular interactions. IEEE Trans. NanoBioscience. 2007;6:331–340. doi: 10.1109/TNB.2007.909005. - DOI - PubMed
    1. Quintana A., Raczka E., Piehler L., Lee I., Myc A., Majoros I., Patri A.K., Thomas T., Mule J., Baker J.R., Jr. Design and function of a dendrimer-based therapeutic nanodevice targeted to tumor cells through thefolate receptor. Pharm. Res. 2002;19:1310–1316. doi: 10.1023/A:1020398624602. - DOI - PubMed
    1. McNeil S.E. Nanotechnology for the biologist. J. Leukoc. Boil. 2005;78:585–594. doi: 10.1189/jlb.0205074. - DOI - PubMed
    1. Morawski A.M., Winter P.M., Crowder K.C., Caruthers S.D., Fuhrhop R.W., Scott M.J., Robertson J.D., Abendschein D.R., Lanza G.M., Wickline S.A. Targeted nanoparticles for quantitative imaging of sparse molecular epitopes with MRI. Magn. Reson. Med. 2004;51:480–486. doi: 10.1002/mrm.20010. - DOI - PubMed

Publication types