. 2020 Feb 7;13(1):12.
doi: 10.1186/s13045-019-0841-3.

MiR-612 regulates invadopodia of hepatocellular carcinoma by HADHA-mediated lipid reprogramming

Affiliations

MiR-612 regulates invadopodia of hepatocellular carcinoma by HADHA-mediated lipid reprogramming

Yang Liu et al. J Hematol Oncol. .

Erratum in

Abstract

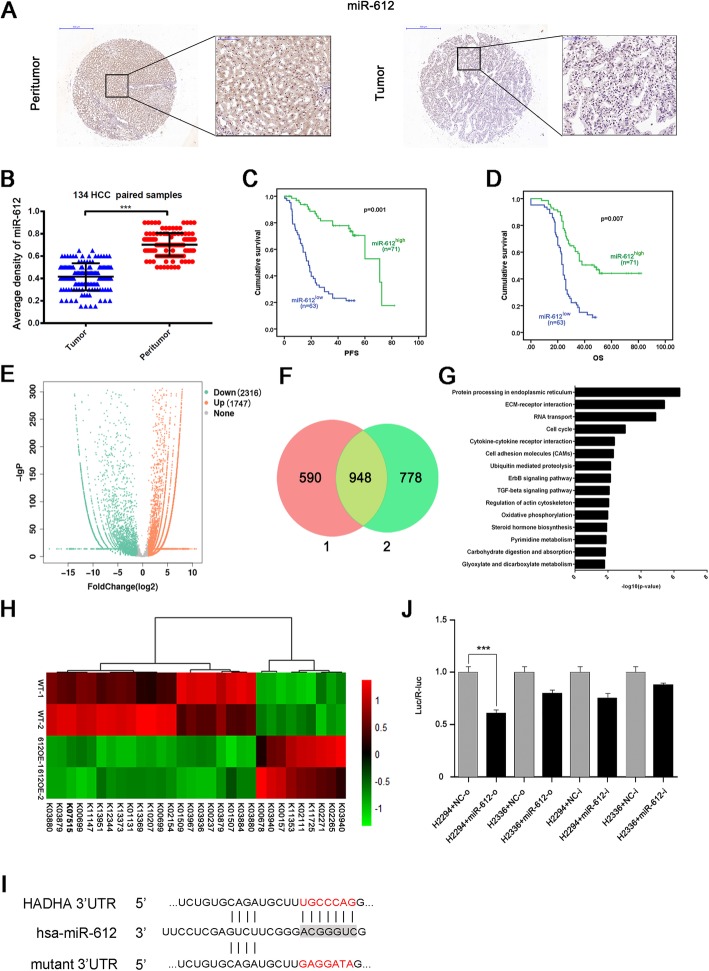
Background: MicroRNA-612 (miR-612) has been proven to suppress EMT, stemness, and tumor metastasis of hepatocellular carcinoma (HCC) via PI3K/AKT2 and Sp1/Nanog signaling. However, its biological roles on HCC progression are far from elucidated.

Methods: We found direct downstream target of miR-612, hadha by RNA immunoprecipitation and sequencing. To explore its biological characteristic, potential molecular mechanism, and clinical relevance in HCC patients, we performed several in-vitro and in-vivo models, as well as human tissue chip.

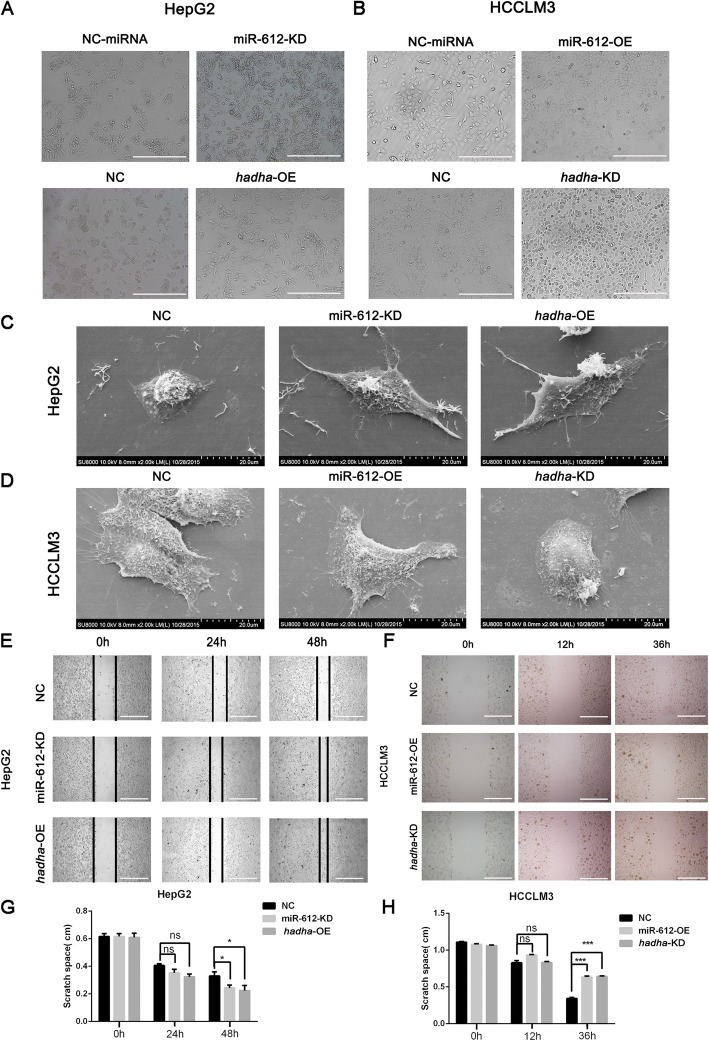
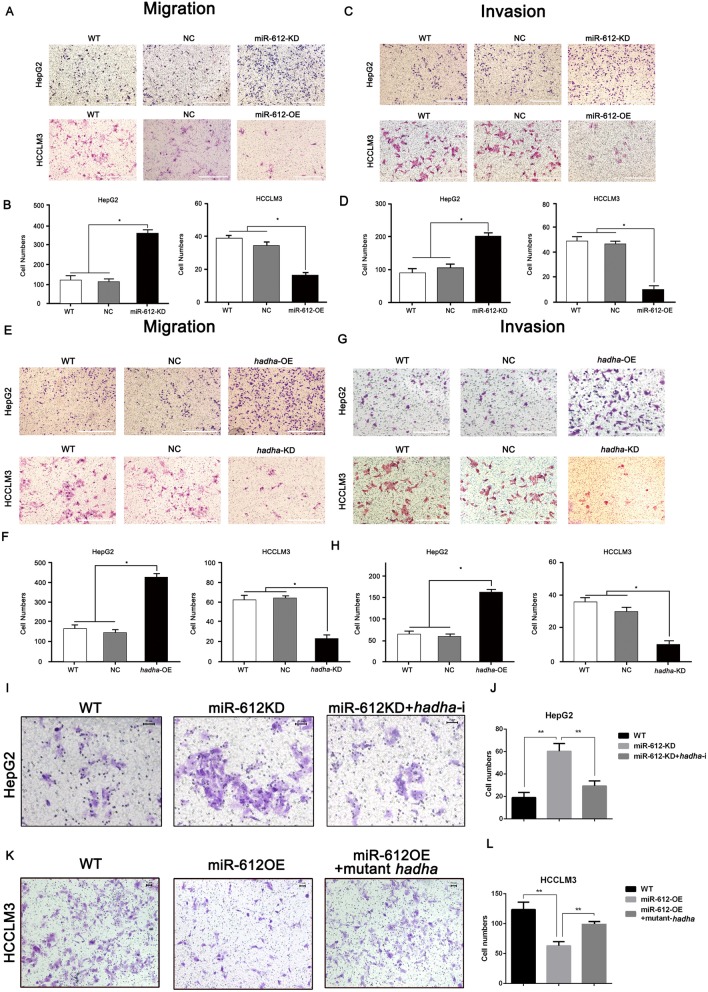
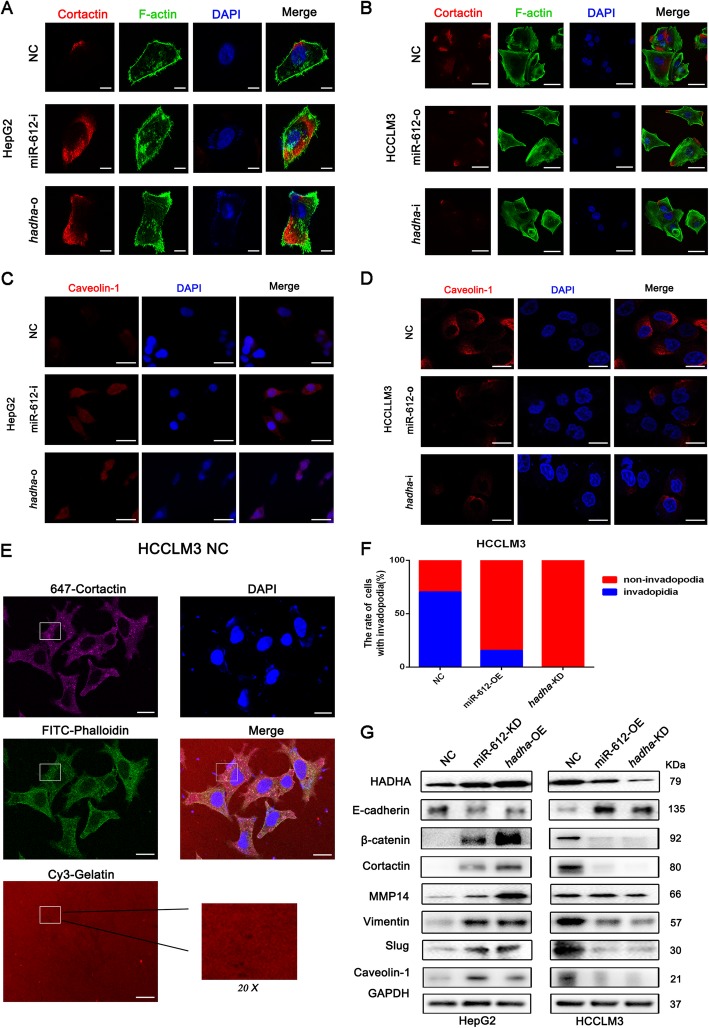
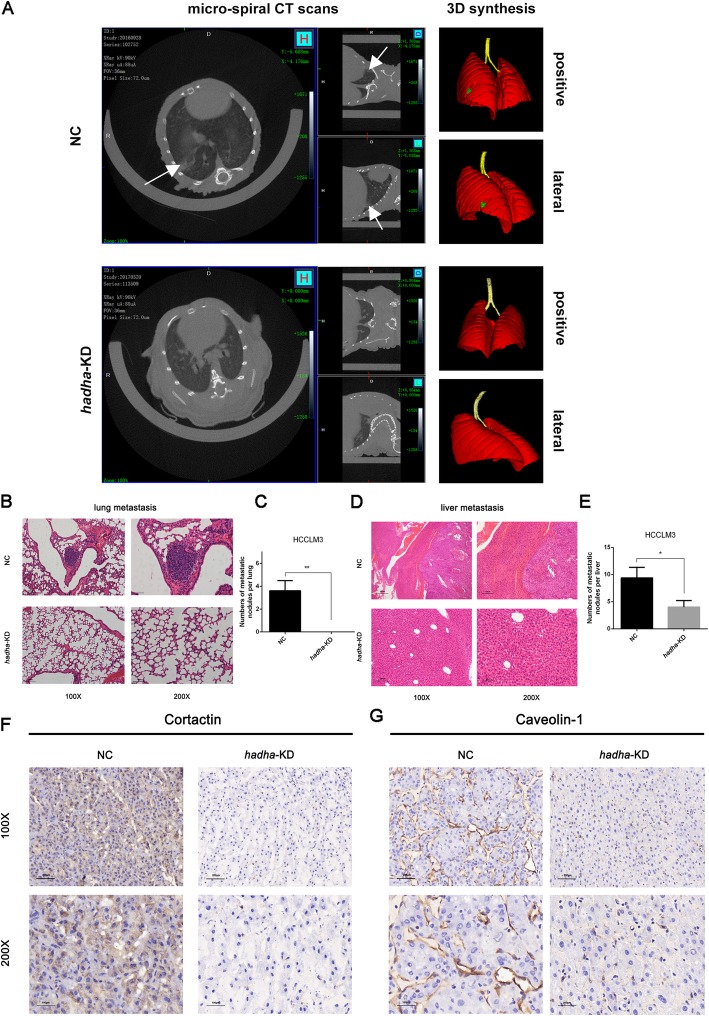
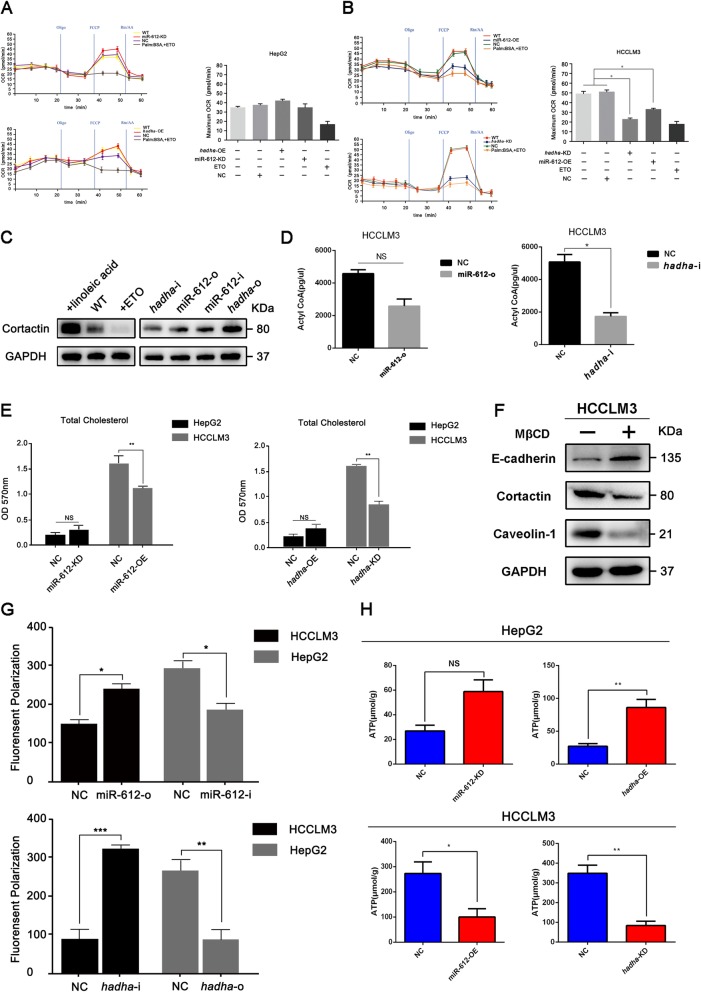
Results: Ectopic expression of miR-612 could partially reverse the level of HADHA, then suppress function of pseudopods, and diminish metastatic and invasive potential of HCC by lipid reprogramming. In detail, miR-612 might reduce invadopodia formation via HADHA-mediated cell membrane cholesterol alteration and accompanied with the inhibition of Wnt/β-catenin regulated EMT occurrence. Our results showed that the maximum oxygen consumption rates (OCR) of HCCLM3miR-612-OE and HCCLM3hadha-KD cells were decreased nearly by 40% and 60% of their counterparts (p < 0.05). The levels of acetyl CoA were significantly decreased, about 1/3 (p > 0.05) or 1/2 (p < 0.05) of their controls, in exogenous miR-612 or hadha-shRNA transfected HCCLM3 cell lines. Besides, overexpression of hadha cell lines had a high expression level of total cholesterol, especially 27-hydroxycholesterol (p < 0.005). SREBP2 protein expression level as well as its downstream targets, HMGCS1, HMGCR, MVD, SQLE were all deregulated by HADHA. Meanwhile, the ATP levels were reduced to 1/2 and 1/4 in HCCLM3miR-612-OE (p < 0.05) and HCCLM3hadha-KD (p < 0.01) respectively. Moreover, patients with low miR-612 levels and high HADHA levels had a poor prognosis with shorter overall survival.

Conclusion: miR-612 can suppress the formation of invadopodia, EMT, and HCC metastasis and by HADHA-mediated lipid programming, which may provide a new insight of miR-612 on tumor metastasis and progression.

Keywords: Hepatocellular carcinoma; Invadopodia; Metastasis; miR-612; β-Oxidation.


Conflict of interest statement

The authors declare that they have no competing interests.

Figures

Fig. 1
Fig. 1
MiR-612 and hadha, its new target, in HCC. a, b Representative images with high and low expressed level of miR-612 in HCC and their paired adjacent tissues in immunohistochemistry. Bars: (left) magnification × 100, (right) magnification × 400. c, d Kaplan–Meier analysis of PFS and OS in HCC patients using SPSS 22.0. e Volcano map of the differential expressed genes (Ordinate: statistical significance of changes in expression; abscissa: multiple changes in the differential genes. Orange represents upregulated genes and downregulated ones in green). f Repeated downregulated genes in two independent RNA-seqs. g KEGG pathway analysis (Ordinate: the KEGG signal path; abscissa: p value). h Gene profiles related to lipid metabolism, including hadha. i Schematic diagram of the dual luciferase reporter vector of miRNA target. j Luciferase activity in 293T cells. H2294:pMIR-REPORT hadha WT 3′-UTR; H2336:pMIR-REPORT hadha mut 3′-UTR. Statistical analysis by Student’s t test. (***p < 0.001). Data are mean ± SEM of three independent experiments
Fig. 2
Fig. 2
Morphology and mobility of HCC regulated by miR-612 and hadha. a, b Morphological changes of HepG2 and HCCLM3 infected with indicated lentivirus in microscope. Scale bars, 200 μm. c, d Morphological changes of HepG2 and HCCLM3 infected with indicated lentivirus in electron microscopy. e, g Wound healing of HepG2 infected with miR-612-KD or hadha-OE lentivirus. Scale bars, 200 μm. f, h Wound healing of HCCLM3 infected with miR-612-OE and hadha-KD lentivirus. Scale bars, 200 μm. (ns: not significant; *p < 0.05; ***p < 0.001). Data are mean ± SEM of three independent experiments
Fig. 3
Fig. 3
MiR-612 suppresses invasion and migration of HCC by targeting hadha. a, b Cell migration abilities and statistic results of HepG2miR-612-KD and HCCLM3miR-612-OE cells. Scale bars, 200 μm. c, d Cell invasion abilities and statistic results of HepG2miR-612-KD and HCCLM3miR-612-OE cells. Scale bars, 200 μm. e, f Cell migration abilities and statistic results of HepG2hadha-OE and HCCLM3hadha-KD cells. Scale bars, 200 μm. g, h Cell invasion abilities and statistic results of HepG2hadha-OE and HCCLM3hadha-KD cells. Cell migration abilities and statistic results of HepG2miR-612-KD cells after hadha was knocked down. Scale bars, 200 μm. i, j Cell migration abilities and statistic results of HCCLM3 miR-612-OE cells after HADHA was rescued. Scale bars, 50 μm. k, l Cells (*p < 0.05; **p < 0.01). Data are mean ± SEM of three independent experiments. Scale bars, 50 μm
Fig. 4
Fig. 4
MiR-612 restrains HCC invadopodia by HADHA. a, c Expression of invasive pseudopodia-related proteins, Cortactin, F-actin, and Caveolin-1, in HepG2 cells with indicated treatments. a Scale bars, 5 μm. c Scale bars, 30 μm (b, d) Expression of invasive pseudopodia-related proteins, Cortactin, F-actin and Caveolin-1, in HCCLM3 cells with indicated treatments. b Scale bars, 50 μm. d Scale bars, 15 μm. e, f The number and statistic results of invasive pseudopods of HCCLM3 cells. Scale bars, 15 μm. g EMT and invadopodia biomarkers in HepG2 and HCCLM3 cells with indicated treatments analyzed by Western blots
Fig. 5
Fig. 5
HADHA promotes metastasis of HCC in vivo. a Metastatic foci in lung were imaged by micro-spiral CT scans using 3D synthesis. b, c Metastatic foci in lung and their statistic results of indicated HCCLM3 orthotopic xenografts (HCCLM3hadha-KD or HCCLM3NC) in H-E staining. d, e Metastatic foci in liver and their statistic results of indicated HCCLM3 orthotopic xenografts in H-E staining. Bars: (left) magnification × 100, scale bars, 200 μm. (right) magnification × 200, scale bars, 100 μm. f, g The levels of Cortactin and Caveolin-1 in liver orthotopic xenografts using IHC analyses. Bars: (up) magnification× 100, scale bars, 200 μm. (down) magnification × 200. scale bars, 100 μm. (*p < 0.05; **p < 0.01)
Fig. 6
Fig. 6
HADHA promotes β-oxidation of fatty acids in HCC. a OCR, the activities of β-oxidation, in HepG2 cells treated with 100 μM ETO, as well as in HepG2miR-612-KD, HepG2hadha-OE, and HepG2NC cells. b OCR, the activities of β-oxidation, in HCCLM3 cells treated with 100 μM ETO, as well as in HCCLM3miR-612-OE, HCCLM3hadha-KD, and HCCLM3NC cells. c The protein levels of Cortactin in HCCLM3 cells treated with 100 μM ETO or 100 mM linoleic acid, as well as in HCCLM3miR-612-o, HCCLM3miR-612-i, HCCLM3hadha-o, and HCCLM3hadha-i cells. d The intracellular levels of acetyl CoA in HCCLM3miR-612-o, HCCLM3hadha-i, and HCCLM3NC cells. e The cellular levels of cholesterol in HepG2miR-612-KD, HCCLM3miR-612-OE, HepG2hadha-OE, and HCCLM3hadha-KD cells. f The protein levels of Cortactin, Caveolin-1, E-cadherin, and GAPDH in HCCLM3 cells treated with or without 1 mM MβCD. g Fluorescence intensity in HepG2miR-612-i, HCCLM3miR-612-o, HepG2hadha-o, and HCCLM3hadha-i cells detected by fluorescence spectrophotometer (Ex/Em = 360/460 nm). Fluorescence polarization is calculated by the formula (h) The levels of ATP in HepG2miR-612-KD, HCCLM3miR-612-OE, HepG2hadha-OE, and HCCLM3hadha-KD cells analyzed by spectrophotometer (λ = 636 nm). (NS: no significance; *p < 0.05; **p < 0.01; ***p < 0.001). Data are mean ± SEM of three independent experiments
Fig. 7
Fig. 7
Clinical significance of HADHA in HCC patients. a The cholesterol and 27-hydroxycholesterol of HepG2 and HCCLM3 cells relative quantification based on liquid chromatography mass spectrometry (LC-MS)/MS system. (NS: no significance; **p < 0.01; ***p < 0.001). b Immunoblotting of proteins involved in cholesterol-biosynthesis pathway in HepG2hadha-OE, HCCLM3hadha-KD cell, and their negative control cells. (Cells treated with negative control lentivirus). c Negative correlation between miR-612 and hadha mRNA in 15 HCC and their adjacent normal tissues. d Representative images of negative and positive HADHA staining in tumor and peritumor tissue from one HCC patient. Bars: (left) magnification × 100, scale bars, 500 μm (right) magnification × 400, scale bars, 50 μm. e The average densities of HADHA in 134 HCC and their paired normal tissues. f, g Kaplan-Meier analyses of PFS and OS in HCC patients using SPSS 22.0. h Hypothesis diagram of lipid reprogramming in HCC cells modulated by miR-612/HADHA/cholesterol axis

References

    1. Siegel RL, Miller KD, Jemal A. Cancer statistics, 2018. CA Cancer J Clin. 2018;68:7–30. doi: 10.3322/caac.21442. - DOI - PubMed
    1. Forner A, Llovet JM, Bruix J. Hepatocellular carcinoma. Lancet. 2012;379:1245–1255. doi: 10.1016/S0140-6736(11)61347-0. - DOI - PubMed
    1. Vander Heiden MG, Cantley LC, Thompson CB. Understanding the Warburg effect: the metabolic requirements of cell proliferation. Science. 2009;324:1029–1033. doi: 10.1126/science.1160809. - DOI - PMC - PubMed
    1. Perez-Escuredo J, Dadhich RK, Dhup S, Cacace A, Van Hee VF, De Saedeleer CJ, Sboarina M, Rodriguez F, Fontenille MJ, Brisson L, et al. Lactate promotes glutamine uptake and metabolism in oxidative cancer cells. Cell Cycle. 2016;15:72–83. doi: 10.1080/15384101.2015.1120930. - DOI - PMC - PubMed
    1. Mancini R, Noto A, Pisanu ME, De Vitis C, Maugeri-Sacca M, Ciliberto G. Metabolic features of cancer stem cells: the emerging role of lipid metabolism. Oncogene. 2018;37:2367–2378. doi: 10.1038/s41388-018-0141-3. - DOI - PubMed

Publication types

MeSH terms

Substances