. 2020 Feb 7;11(1):13.
doi: 10.1186/s13229-020-0318-9.

Transcriptomics of Gabra4 knockout mice reveals common NMDAR pathways underlying autism, memory, and epilepsy

Affiliations

Transcriptomics of Gabra4 knockout mice reveals common NMDAR pathways underlying autism, memory, and epilepsy

Cuixia Fan et al. Mol Autism. .

Abstract

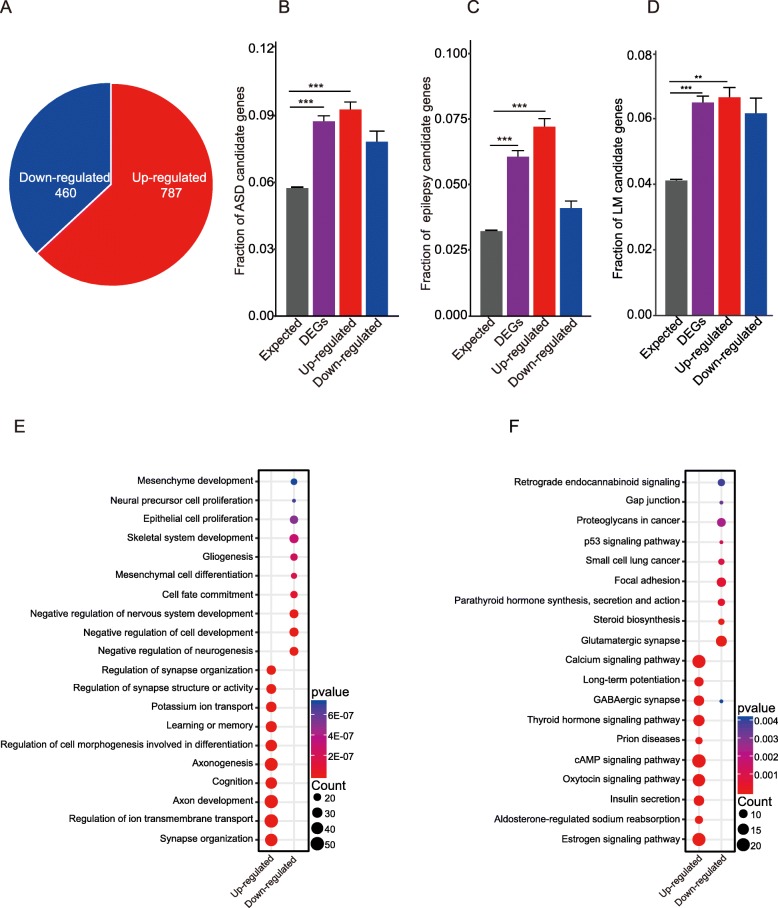
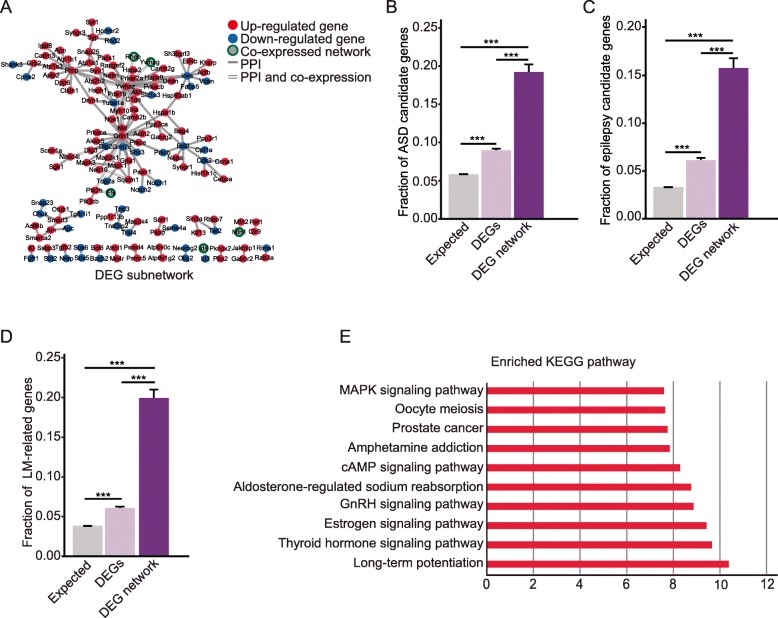
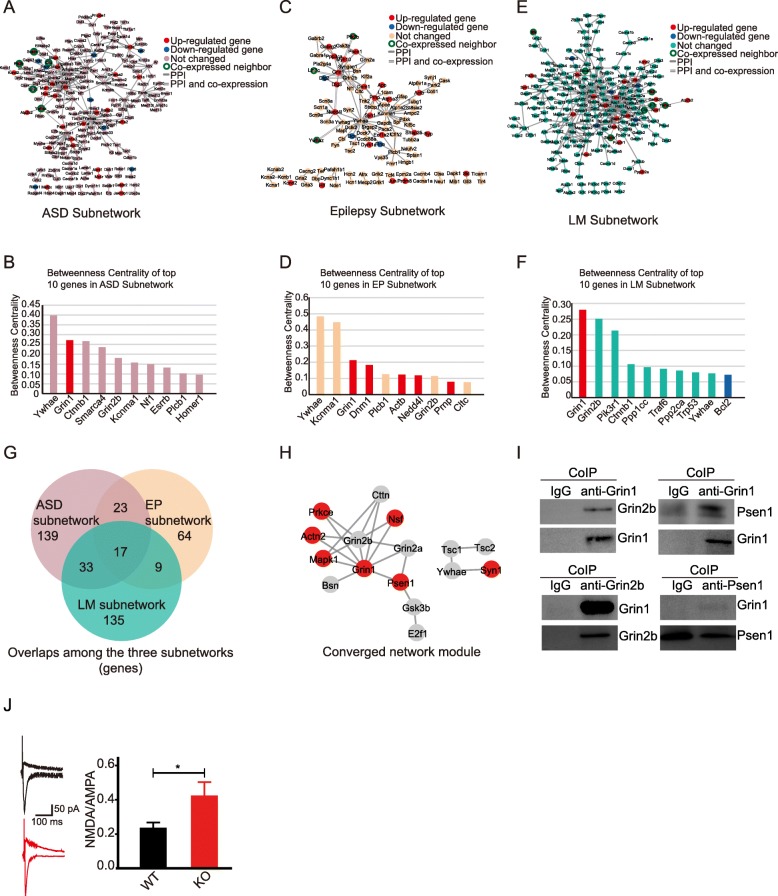
Autism spectrum disorder (ASD) is a neuronal developmental disorder with impaired social interaction and communication, often with abnormal intelligence and comorbidity with epilepsy. Disturbances in synaptic transmission, including the GABAergic, glutamatergic, and serotonergic systems, are known to be involved in the pathogenesis of this disorder, yet we do not know if there is a common molecular mechanism. As mutations in the GABAergic receptor subunit gene GABRA4 are reported in patients with ASD, we eliminated the Gabra4 gene in mice and found that the Gabra4 knockout mice showed autistic-like behavior, enhanced spatial memory, and attenuated susceptibility to pentylenetetrazol-induced seizures, a constellation of symptoms resembling human high-functioning autism. To search for potential molecular pathways involved in these phenotypes, we performed a hippocampal transcriptome profiling, constructed a hippocampal interactome network, and revealed an upregulation of the NMDAR system at the center of the converged pathways underlying high-functioning autism-like and anti-epilepsy phenotypes.

Keywords: Autism; Epilepsy; Gabra4; Interactome; NMDARs; Transcriptome.


Conflict of interest statement

The authors declare that they have no competing interests.

Figures

Fig. 1
Fig. 1
Autistic-like behaviors, enhanced learning/memory and attenuated susceptibility to pentylenetetrazol (PTZ) in Gabra4−/− mice. a Both WT and Gabra4−/− mice showed significant preference for stranger mice over objects (***p < 0.0001, **p = 0.0147. n = 16 for WT, and n = 8 for Gabra4−/− mice, Student’s t test). b WT mice showed significant preference to novel mice over familiar mice (*p = 0.0042. n = 16 for WT, Student’s t test), but Gabra4−/− mice did not show such preference (ns, n = 8, Student’s t test). c Compared to WT mice, Gabra4−/− mice stayed the same time in both closed and open arms during the 5-min elevated plus maze test (n = 9 for WT, and n = 8 for Gabra4−/− mice, ns no significance, Student’s t test). dGabra4−/− mice spent more time to self-grooming than WT (*p = 0.0326, n = 10 for WT, and n = 9 for Gabra4−/− mice, Student’s t test). eGabra4−/− mice showed increased spontaneous alternation during Y maze test (*p = 0.0187, n = 12 for WT, and n = 9 for Gabra4−/− mice, Student’s t test). f Escape latency of Gabra4−/− mice in the Morris water maze (***p < 0.0001, n = 12 for WT mice, n = 16 for Gabra4−/− mice. Two-way ANOVA test). g Number of platform crossings during probe trial in Morris water maze (**p = 0.0013, n = 12 for WT mice, n = 16 for Gabra4−/− mice, Student’s t test). h Susceptibility to pentylenetetrazol in mice (In the test for 60 mg/kg PTZ, p = 0.0114, two-way ANOVA test)
Fig. 2
Fig. 2
Hippocampal transcriptome sequencing analysis and functional annotation of differentially expressed genes. a Pie chart shows 787 up-regulated genes and 460 downregulated in Gabra4 knockout mice (n = 3 samples per genotype). bd Autism spectrum disorder (b), epilepsy (c), and learning/memory (d) candidate genes are enriched in Gabra4−/− differential expression genes. ***p < 0.0001, Fisher’s exact test; Error bars represent the standard error of the fraction, estimated using bootstrapping method with 100 resamplings. e, f The top enriched biological processes of GO terms (e) and KEGG pathways (f) with upregulated genes and down-regulated genes. The enrichment analysis was performed using DAVID bioinformatics tool with a p value cutoff of 0.05 and FDR less than 0.05
Fig. 3
Fig. 3
Hippocampal DEG interactome enriched with candidate genes involved in ASD, epilepsy and learning/memory. a The protein interaction network for DEGs (143 nodes and 145 edges). To extract the DEG subnetwork, a hippocampal interactome network was constructed by integrating the 15,254 hippocampally expressed genes and a protein interaction data from BIOGRID, and then the 1247 DEGs were mapped to the hippocampal interactome to extract a subnetwork including DEGs and their first co-expressed neighbors. Red node: upregulated; blue node: downregulated; gray node: without expression change; node with green border: co-expressed neighbor; gray line: protein-protein interaction (PPI); double lines: PPI and co-expression. b Enrichment of ASD candidate genes in DEG subnetwork compared to all DEGs. Fraction of ASD candidate genes = 0.0574 (876/15,254) in mouse expressed genes; 0.0874 (109/1247) in differentially expressed genes; 0.2028 (29/143) in DEGs in the mouse hippocampal interactome. p = 7.8167E-06 between expressed genes and DEGs; p = 4.1585E-06 between expressed genes and DEGs in the mouse hippocampal interactome; p = 2.0957E-09 between all DEGs and DEGs in the mouse hippocampal interactome. Error bars represent the standard error of the fraction, estimated using a bootstrapping method with 100 resamplings. **p < 0.01; ***p < 0.001 two-tailed fisher-exact test. c Enrichment of epilepsy candidate genes enriched in DEG subnetwork compared to all DEGs. Fraction of epilepsy candidate genes = 0.0325 (496/15,254) in expressed genes; 0.0609 (76/1247) in DEGs; 0.1608 (23/143) in DEGs in the mouse hippocampal interactome. p = 1.001E-07 between expressed genes and DEGs; p = 2.156E-10 between expressed genes and DEGs in the mouse hippocampal interactome; p = 3.7105E-06 between in all DEGs and DEGs in the mouse hippocampal interactome; Error bars represent the standard error of the fraction, estimated using a bootstrapping method with 100 resamplings. **p < 0.01, ***p < 0.001, two-tailed fisher-exact test. d Enrichment of LM-related genes in DEG subnetwork compared to all DEGs. Fraction of LM-related genes = 0.0384 (585/15,254) in expressed genes; 0.0626 (78/1247) in DEGs; 0.1958 (28/143) in DEGs in the hippocampal interactome. p = 1.443E-5 between expressed genes and DEGs; p = 8.1167E-13 between expressed genes and DEGs in the hippocampal interactome; p = 3.5114E-09 between all DEGs and DEGs in the hippocampal interactome. Error bars represent the standard error of the fraction, estimated using a bootstrapping method with 100 resamplings. **p < 0.01, ***p < 0.001, two-tailed fisher-exact test. e The top 10 KEGG pathways enriched with genes in the DEG subnetwork.
Fig. 4
Fig. 4
Hippocampal protein interaction subnetworks for ASD, epilepsy and learning/memory. a ASD subnetwork. ASD candidate genes were mapped onto the hippocampal interactome network to extract a subnetwork including ASD genes and first co-expressed PPI neighbors. b Network betweenness centrality of top 10 genes in ASD subnetwork (X-axis, top 10 genes; Y-axis, betweenness centrality). c EP subnetwork. Epilepsy candidate genes were mapped onto the hippocampal interactome network to extract a subnetwork including epilepsy genes and first co-expressed PPI neighbors. d Network betweenness centrality of top 10 genes in EP subnetwork (X-axis, top 10 genes; Y-axis, betweenness centrality). e LM subnetwork. Learning/memory (LM)-related genes were mapped onto the hippocampal interactome network to extract a subnetwork including LM-related genes and first co-expressed PPI neighbors. f Network betweenness centrality of top 10 genes in LM subnetwork (X-axis, top 10 genes; Y-axis, betweenness centrality). g Venn diagram of nodes in subnetworks. h The module of nodes shared by all three subnetworks. i Co-immunoprecipitation was performed on hippocampal tissue lysates from 8-week mice to detect interactions between endogenous protein pairs: GluN1 and GluN2B, GluN1 and PSEN1. Mouse IgG antibody was used as control in the pull down experiments. j Sample traces (left) and summary bar graph (right) of measurements of the ratio of NMDA receptor-mediated versus AMPA receptor-mediated synaptic responses recorded in slices; the NMDA/AMPA current ratio was determined by sequentially evaluating EPSC amplitudes at − 70 mV (AMPA) and at + 40 mV (NMDA) holding potential; NMDA receptor-mediated responses were measured with the mean response between 110 and 160 ms post-stimulus. All data presented as mean ± SEM; n = 15 for WT cells from five mice and n = 14 for Gabra4−/− cells from five mice; *p < 0.05, Student’s t test
Fig. 5
Fig. 5
Enriched pathways with ASD, epilepsy, and LM subnetworks. a Top 10 enriched KEEG pathways with gene in ASD subnetwork. b Top 10 enriched KEGG pathways with genes in EP subnetwork. c Top 10 enriched KEGG pathways with genes in LM subnetwork. d The different and common enriched pathways among the three subnetworks. The numbers are enriched pathways with the subnetworks. The numbers in brackets are the pathways with NMDARs involved

Similar articles

Cited by

References

    1. Tarlungeanu DC, Deliu E, Dotter CP, Kara M, Janiesch PC, Scalise M, Galluccio M, Tesulov M, Morelli E, Sonmez FM, et al. Impaired amino acid transport at the blood brain barrier is a cause of autism spectrum disorder. Cell. 2016;167:1481–1494. doi: 10.1016/j.cell.2016.11.013. - DOI - PMC - PubMed
    1. Becker JA, Clesse D, Spiegelhalter C, Schwab Y, Le Merrer J, Kieffer BL. Autistic-like syndrome in mu opioid receptor null mice is relieved by facilitated mGluR4 activity. Neuropsychopharmacology. 2014;39:2049–2060. doi: 10.1038/npp.2014.59. - DOI - PMC - PubMed
    1. Charman T, Pickles A, Simonoff E, Chandler S, Loucas T, Baird G. IQ in children with autism spectrum disorders: data from the Special Needs and Autism Project (SNAP) Psychol Med. 2011;41:619–627. doi: 10.1017/S0033291710000991. - DOI - PubMed
    1. Afroz S, Parato J, Shen H, Smith SS. Synaptic pruning in the female hippocampus is triggered at puberty by extrasynaptic GABA(A) receptors on dendritic spines. Elife. 2016;5. - PMC - PubMed
    1. Afroz S, Parato J, Shen H, Smith SS. Synaptic pruning in the female hippocampus is triggered at puberty by extrasynaptic GABA(A) receptors on dendritic spines. Elife. 2016;5. - PMC - PubMed

Publication types

Substances