

Effects of variable versus nonvariable controlled mechanical ventilation on pulmonary inflammation in experimental acute respiratory distress syndrome in pigs
- PMID: 32033744
- PMCID: PMC8016484
- DOI: 10.1016/j.bja.2019.12.040
Effects of variable versus nonvariable controlled mechanical ventilation on pulmonary inflammation in experimental acute respiratory distress syndrome in pigs
Abstract
Background: Mechanical ventilation with variable tidal volumes (VT) may improve lung function and reduce ventilator-induced lung injury in experimental acute respiratory distress syndrome (ARDS). However, previous investigations were limited to less than 6 h, and control groups did not follow clinical standards. We hypothesised that 24 h of mechanical ventilation with variable VT reduces pulmonary inflammation (as reflected by neutrophil infiltration), compared with standard protective, nonvariable ventilation.
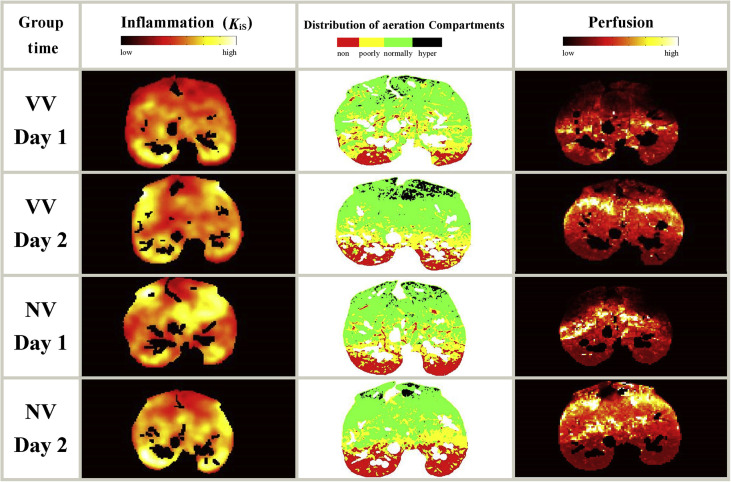
Methods: Experimental ARDS was induced in 14 anaesthetised pigs with saline lung lavage followed by injurious mechanical ventilation. Pigs (n=7 per group) were randomly assigned to using variable VT or nonvariable VT modes of mechanical ventilation for 24 h. In both groups, ventilator settings including positive end-expiratory pressure and oxygen inspiratory fraction were adjusted according to the ARDS Network protocol. Pulmonary inflammation (primary endpoint) and perfusion were assessed by positron emission tomography using 2-deoxy-2-[18F]fluoro-d-glucose and 68Gallium (68Ga)-labelled microspheres, respectively. Gas exchange, respiratory mechanics, and haemodynamics were quantified. Lung aeration was determined using CT.
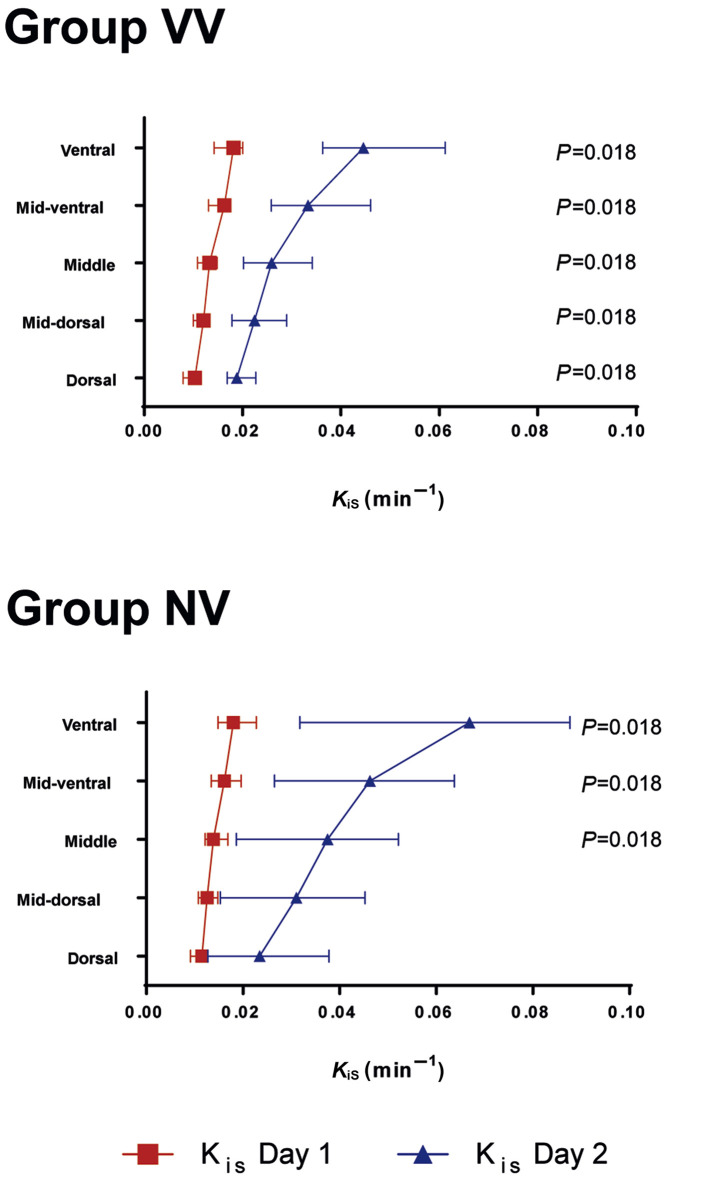
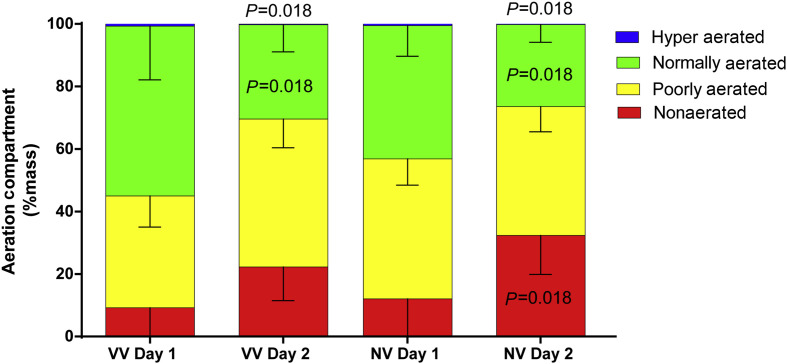
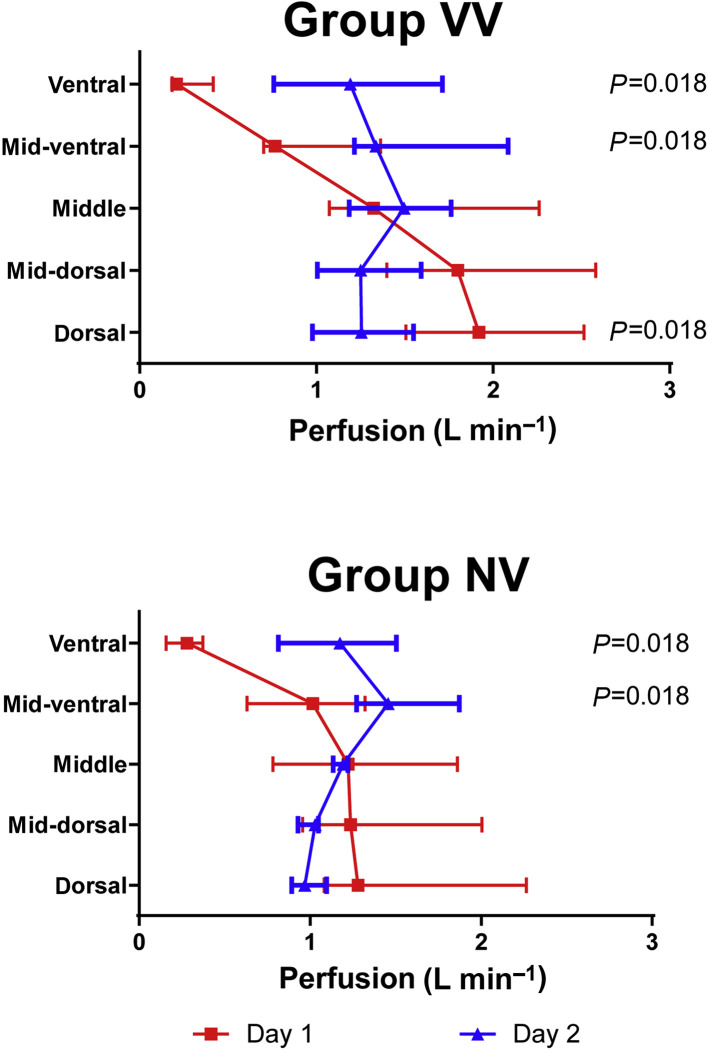
Results: The specific global uptake rate of 18F-FDG increased to a similar extent regardless of mode of mechanical ventilation (median uptake for variable VT=0.016 min-1 [inter-quartile range, 0.012-0.029] compared with median uptake for nonvariable VT=0.037 min-1 [0.008-0.053]; P=0.406). Gas exchange, respiratory mechanics, haemodynamics, and lung aeration and perfusion were similar in both variable and nonvariable VT ventilatory modes.
Conclusion: In a porcine model of ARDS, 24 h of mechanical ventilation with variable VT did not attenuate pulmonary inflammation compared with standard protective mechanical ventilation with nonvariable VT.
Keywords: ARDS; mechanical ventilation; positron emission tomography; pulmonary neutrophilic inflammation; variable ventilation.
Copyright © 2020 British Journal of Anaesthesia. Published by Elsevier Ltd. All rights reserved.
Figures
Comment in
-
Effects of variable versus non-variable controlled mechanical ventilation. Comment on Br J Anaesth 2020; 124: 430-9.Br J Anaesth. 2020 Jun;124(6):e222-e223. doi: 10.1016/j.bja.2020.02.010. Epub 2020 Mar 11. Br J Anaesth. 2020. PMID: 32171544 No abstract available.
References
-
- Slutsky A.S., Ranieri V.M. Ventilator-induced lung injury. N Engl J Med. 2013;369:2126–2136. - PubMed
-
- ARDS-Network Ventilation with lower tidal volumes as compared with traditional tidal volumes for acute lung injury and the acute respiratory distress syndrome. The Acute Respiratory Distress Syndrome Network. N Engl J Med. 2000;342:1301–1308. - PubMed
-
- Boker A., Graham M.R., Walley K.R. Improved arterial oxygenation with biologically variable or fractal ventilation using low tidal volumes in a porcine model of acute respiratory distress syndrome. Am J Respir Crit Care Med. 2002;165:456–462. - PubMed
-
- Arold S.P., Suki B., Alencar A.M., Lutchen K.R., Ingenito E.P. Variable ventilation induces endogenous surfactant release in normal Guinea pigs. Am J Physiol Lung Cell Mol Physiol. 2003;285:L370–L375. - PubMed
LinkOut - more resources
Full Text Sources
Miscellaneous
