. 2020 Feb 7;5(44):eaay3254.
doi: 10.1126/sciimmunol.aay3254.

Specialization of mucosal immunoglobulins in pathogen control and microbiota homeostasis occurred early in vertebrate evolution

Affiliations

Specialization of mucosal immunoglobulins in pathogen control and microbiota homeostasis occurred early in vertebrate evolution

Zhen Xu et al. Sci Immunol. .

Abstract

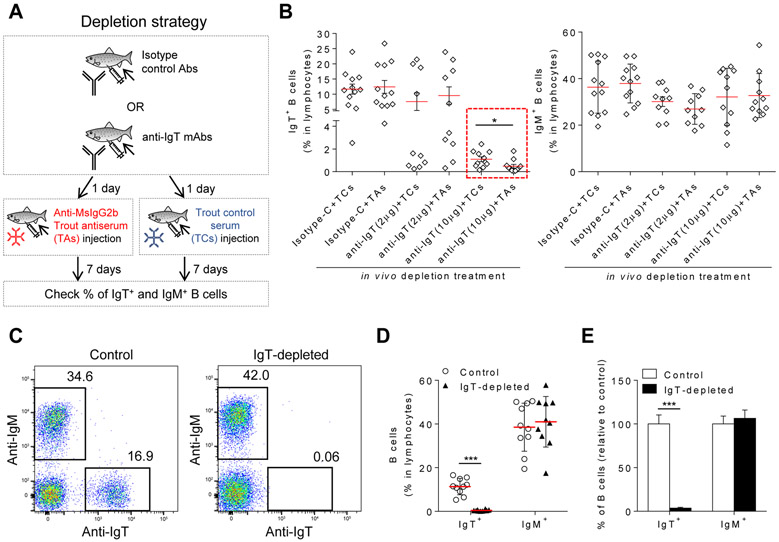
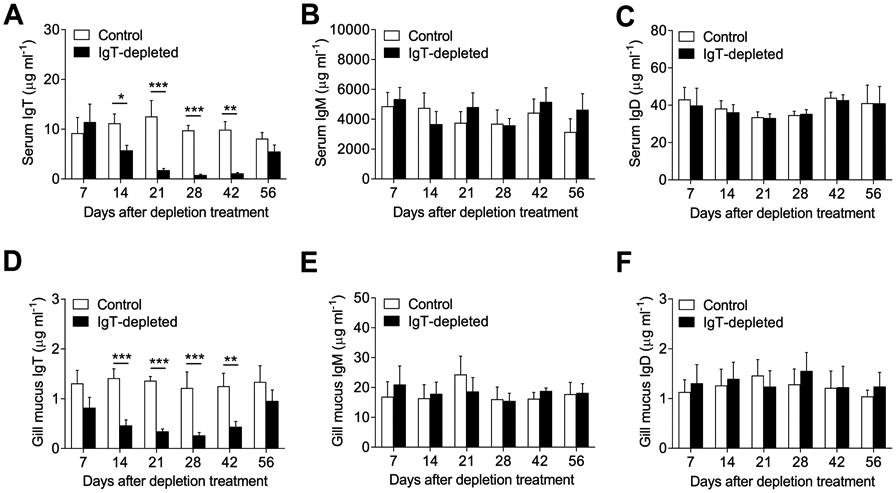
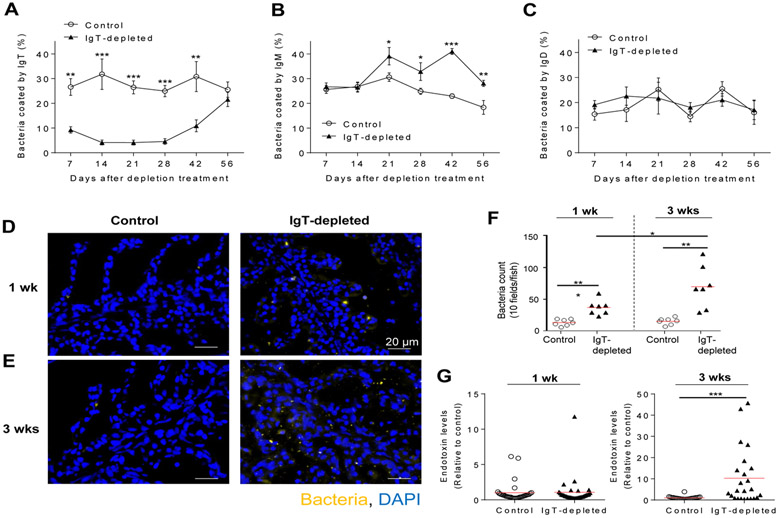
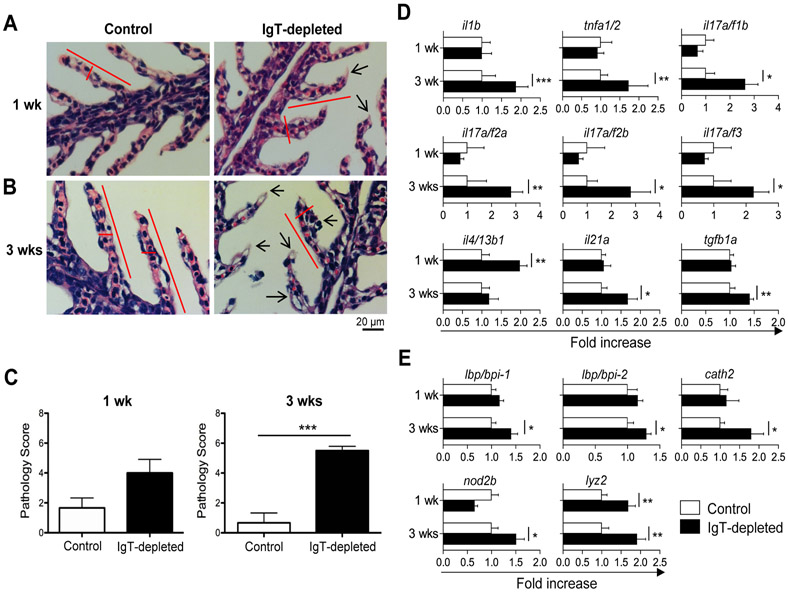
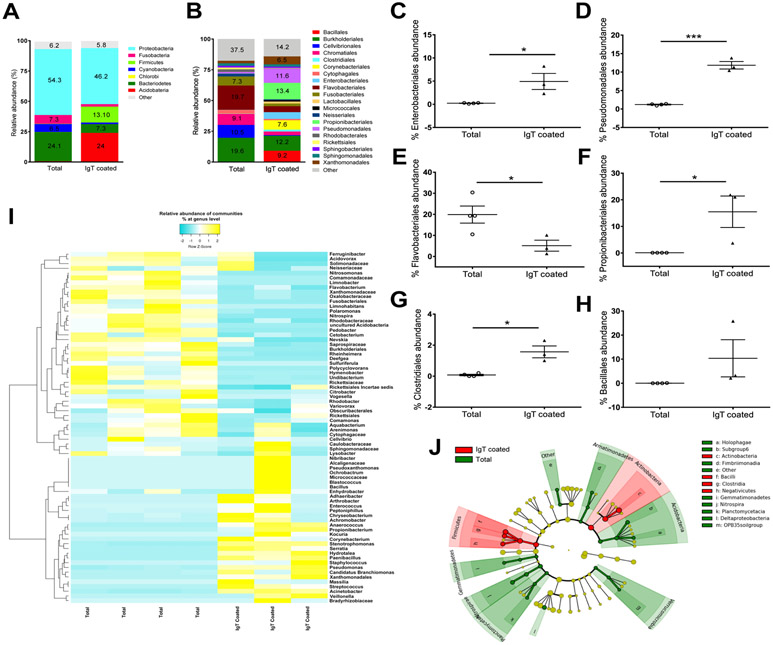
Although mammalian secretory immunoglobulin A (sIgA) targets mucosal pathogens for elimination, its interaction with the microbiota also enables commensal colonization and homeostasis. This paradoxical requirement in the control of pathogens versus microbiota raised the question of whether mucosal (secretory) Igs (sIgs) evolved primarily to protect mucosal surfaces from pathogens or to maintain microbiome homeostasis. To address this central question, we used a primitive vertebrate species (rainbow trout) in which we temporarily depleted its mucosal Ig (sIgT). Fish devoid of sIgT became highly susceptible to a mucosal parasite and failed to develop compensatory IgM responses against it. IgT depletion also induced a profound dysbiosis marked by the loss of sIgT-coated beneficial taxa, expansion of pathobionts, tissue damage, and inflammation. Restitution of sIgT levels in IgT-depleted fish led to a reversal of microbial translocation and tissue damage, as well as to restoration of microbiome homeostasis. Our findings indicate that specialization of sIgs in pathogen and microbiota control occurred concurrently early in evolution, thus revealing primordially conserved principles under which primitive and modern sIgs operate in the control of microbes at mucosal surfaces.


Figures

Fig. 1.
Fig. 1.. Development of a trout IgT+ B cell depletion model.
(A) Scheme of the strategy used to deplete trout IgT+ B cells. Fish were injected with either isotype control Abs (mouse IgG2b) or with anti-trout IgT mAbs. A day after, half of the fish from both groups were injected with anti-mouse (Ms) IgG2b trout antiserum (TAs) and the other half with trout control serum (TCs). Seven days later, the % of IgT+ and IgM+ B cells from blood leukocytes of all fish was analyzed by flow cytometry. (B) Percentage of IgT+ (left panel) or IgM+ B cells (right panel) in blood leukocytes from trout injected with isotype control (Isotype-C) antibodies (10 μg/fish) or with mouse anti-trout IgT mAbs (2 μg/fish or 10 μg/fish). Isotype-C- and anti-trout IgT-treated groups were thereafter injected with TAs or TCs (n = 10-12 fish per group) as depicted in (A). The groups injected with anti-IgT mAb (10 μg) are shown in red dotted box. (C) Flow cytometry of blood leukocytes from control (left) and IgT+ B cell depleted (right) fish. Numbers adjacent to outlined areas indicate percentage of IgM+ cells (top left) or IgT+ cells (bottom right) in the lymphocyte population. (D) The percentage of IgT+ or IgM+ B cells in the lymphocyte population of control or IgT-depleted fish (n = 10 fish per group). (E) The % of IgT+ and IgM+ B cells in the IgT-depleted group relative to that of control fish (mean ± s.e.m.; n = 10 fish). Fish in (C to E) were injected with either 25 μg of anti-trout IgT mAb (IgT-depleted) or 25 μg of the isotype control antibody (control) followed by injection with TAs. Each symbol (B and D) represents an individual fish; small horizontal red lines (B and D) indicate the mean (± s.e.m.). Data are pooled from two independent experiments (B) or representative of two independent experiments (C to E). Statistical analysis was performed by unpaired Student’s t-test. *P < 0.05, ***P < 0.001.
Fig. 2.
Fig. 2.. Analysis of IgT+ and IgM+ B cells in blood, head kidney and gill upon IgT+ B cell depletion treatment.
(A to C) Percentage of IgT+ (left) and IgM+ B cells (right) within the lymphocyte population of blood (A), head kidney (B) and gill (C) leukocytes in control and IgT-depleted fish (n = 10-12 fish per group). Data are representative of at least three independent experiments (mean ± s.e.m.). Statistical analysis was performed by unpaired Student’s t-test. **P < 0.01, ***P < 0.001. (D to F) Immunofluorescence microscopy of trout blood leukocytes (D), head kidney tissue (E) and gill tissue (F), stained for IgT (green) and IgM (red), from control (left) and IgT-depleted (right) fish. Nuclei are stained with DAPI (blue). Isotype-matched control antibody staining in fig. S2. Scale bar, 50 μm. Data are representative of at least three independent experiments.
Fig. 3.
Fig. 3.. IgT, IgM and IgD concentration in serum and gill mucus upon IgT+ B cell depletion treatment.
(A to C) Concentration of IgT (A), IgM (B) and IgD (C) in serum of control and IgT-depleted fish. (D to F) Concentration of sIgT (D), sIgM (E) and sIgD (F) in gill mucus of control and IgT-depleted fish. n = 10-12 fish per group. Data are representative of at least three independent experiments (mean ± s.e.m.). Statistical analysis was performed by unpaired Student’s t-test. *P < 0.05, **P < 0.01 and ***P < 0.001.
Fig. 4.
Fig. 4.. IgT depletion significantly increases pathogen load and fish mortalities upon Ich infection.
(A) Scheme of the experimental strategy. Immune fish (fish which survived monthly infections by bath with ~1000 theronts per fish, during a three month period) were injected with either isotype control Abs (non-depleted immune fish) or anti-IgT mAb (IgT-depleted immune fish). A day after, fish were injected with TAs. At 14 days post-TAs injection, the non-depleted and IgT-depleted groups were infected by bath with Ich (~1000 theronts per fish), and at 21, 10 and 30 days post-infection, different groups of fish were analyzed for Ig responses, pathogen load and mortalities, respectively. (B and C) Specific Ig responses against the parasite were measured by pull-down assays in which we assessed the IgT-, IgM- and IgD-specific binding to Ich in dilutions of gill mucus from non-depleted (B) and IgT-depleted fish (C). Results are presented as relative values to those of uninfected naive fish (n = 10-12 fish per group). (D) Representative stereomicroscope images of gill arches infected with Ich from non-depleted (left) and IgT-depleted fish (right). White arrowheads point to Ich trophonts. (E) Parasites numbers on gills from non-depleted and IgT-depleted fish upon infection with Ich (n = 17 fish per group). Each symbol represents an individual fish; small horizontal red lines indicate the mean. (F) Real-time PCR analysis of Ich 18S rRNA gene in gills from non-depleted and IgT-depleted fish. DNA abundance was normalized to that of non-depleted fish, which is set as 1 (n = 10 fish per group). (G) Percentage survival of non-depleted and IgT-depleted fish infected with Ich. Data (B to F) are representative of three independent experiments (mean ± s.e.m.) or two independent experiments (G). Statistical analysis was performed by unpaired Student’s t-test (B, C, E and F), or log-rank (Mantel-Cox) test (G). *P < 0.05, **P < 0.01 and ***P < 0.001.
Fig. 5.
Fig. 5.. IgT-depletion leads to a major decrease of sIgT coating of the gill microbiota and to their translocation across the gill epithelium.
(A to C) Percentage of gill bacteria coated with sIgT (A), sIgM (B) or sIgD (C) at days 7, 14, 21, 28, 42 and 56 after depletion treatment (n = 10-12 fish per group). Data are representative of at least two independent experiments (mean ± s.e.m.). (D and E) Detection of bacteria by fluorescence in situ hybridization in gill cryosections from control (left) and IgT-depleted fish (right) at 1 week (D) and 3 weeks (E) post depletion treatment. Eubacteria were detected with Cy5-EUB338 oligoprobe (yellow). Nuclei were stained with DAPI (blue). Scale bar, 20 μm. (F) Translocated bacteria were quantified in gill cryosections of control and IgT-depleted fish (10 microscopy fields per fish, n = 7 per group). (G) Endotoxin levels were measured by LAL chromogenic endpoint assay in serum from control and IgT-depleted fish (n=25 per group) at 1 week (left) and 3 weeks (right) post-depletion treatment. Endotoxin levels in IgT-depleted fish were normalized to those in control fish, which were set as 1. Each symbol (F and G) represents an individual fish; small horizontal red lines (F and G) indicate the mean. Data are representative of two independent experiments (D to E) or pooled from two independent experiments (F and G). Statistical analysis was performed by unpaired Student’s t-test. *P < 0.05 and ***P < 0.001.
Fig. 6.
Fig. 6.. IgT-depletion leads to damage and inflammation of the gill tissue.
(A and B) Hematoxylin-eosin staining of gill paraffin sections in control (left) and IgT-depleted (right) fish at 1 week (A) and 3 weeks (B) post-depletion treatment. (C) Pathology score of gill tissue in control and IgT-depleted fish at 1 week (left) and 3 weeks (right) post-depletion treatment (mean ± s.e.m.; n = 6 fish per group). (D and E) Real-time PCR analysis of cytokine genes (D) and antimicrobial peptide genes (E) in gill tissue from control and IgT-depleted fish. Expression levels in IgT-depleted fish were normalized to those in control fish, which were set as 1 (mean ± s.e.m.; n = 8 fish per group). Data are representative of two independent experiments. Statistical analysis was performed by unpaired Student’s t-test. *P < 0.05, **P < 0.01 and ***P < 0.001.
Fig. 7.
Fig. 7.. sIgT coats specific subset of gill microbiota with beneficial and pathogenic characteristics.
Total bacteria and sIgT-coated bacteria from the gill mucosa were FACS sorted and high-throughput 16S rDNA sequencing of the V1-V3 region was performed (IgT-seq). (A) Mean relative abundance at the phylum level of the total gill bacterial community (Total) and the sIgT-coated bacterial community (IgT Coated). (B) Mean relative abundance at the order level of the total gill bacterial community (Total) and the sIgT-coated bacterial community (IgT Coated). (C to H) Relative abundance (%) of Enterobacteriales (C), Pseudomonadales (D), Flavobacteriales (E), Proprionibacteriales (F), Clostridiales (G) and Bacillales (H) in the total and sIgT-coated gill bacterial community. Data were analyzed in Qiime 1.8. Differential abundances were determined by unpaired Student’s t-test. *P < 0.05, ***P < 0.001. (I) Heatmap of the top 75 OTUs with differential abundances in the total (n = 4 pools, 4 fish per pool) and sIgT-coated (n = 3 pools, 4 fish per pool) gill bacterial communities. (P < 0.05). The heatmap was generated using the online free tool Heatmapper (78) using average linkage as a clustering method followed by the Spearman rank correlation for distance measurement. (J) Cladogram representation of LEfSe analysis showing bacterial taxa that were significantly associated with the total bacterial community (green) or the sIgT-coated bacterial community (red) (P < 0.05). n=3-4 pools, 4 fish per pool. Results are representative of two independent experiments.
Fig. 8.
Fig. 8.. IgT depletion results in significant gill dysbiosis 3 weeks post-depletion.
The microbial community composition of control and IgT-depleted gills (n = 5-6 per group) was determined by high-throughput 16S rDNA sequencing 3 weeks after IgT depletion treatment. (A) Shannon-diversity index (mean ± s.e.m.) of the control and IgT-depleted gill microbial communities. (B) Mean relative abundance at the phylum level of the control and IgT-depleted gill bacterial community. (C) Mean relative abundance at the order level of the control and IgT-depleted gill bacterial community. (D and F) Relative abundance (%) of Flavobacteriales (D, top) and Neisseriales (D, bottom), Propionibacterium sp. (F, top) and Pseudomonas sp. (F, bottom) in the control and IgT-depleted gill bacterial community at 3 weeks post-depletion. Data were analyzed in Qiime 1.8. Differential abundances were determined by unpaired Student’s t-test. *P < 0.05, **P < 0.01. (E) Heatmap of the top 25 OTUs with significantly different abundance in control and IgT-depleted gills 3 weeks post-depletion. The full list of the 39 differentially abundant OTUs can be found in table S7. Each column represents one individual fish. (G) Bar chart of the log-transformed LDA score of bacterial taxa found to be significantly associated with control and IgT-depleted 3 week-post depletion showing the presence of 15 taxonomical features with higher abundance in controls (red) and 5 taxonomical features with greater abundance in IgT-depleted gills (green) by LEfSe (P < 0.05). (H) Cladogram representation of LDA analysis in (G) showing the phylogenetic relationships among the bacterial taxa found to be significantly associated with control (red) or IgT-depleted gills (green) by LEfSe. Results are representative of two independent experiments.

References

    1. Woof JM, Mestecky J, Mucosal immunoglobulins. Immunological reviews 206, 64–82 (2005). - PubMed
    1. Macpherson AJ, Yilmaz B, Limenitakis JP, Ganal-Vonarburg SC, IgA Function in Relation to the Intestinal Microbiota. Annual review of immunology 36, 359–381 (2018). - PubMed
    1. Dann SM, Manthey CF, Le C, Miyamoto Y, Gima L, Abrahim A, Cao AT, Hanson EM, Kolls JK, Raz E, Cong Y, Eckmann L, IL-17A promotes protective IgA responses and expression of other potential effectors against the lumen-dwelling enteric parasite Giardia. Experimental parasitology 156, 68–78 (2015). - PMC - PubMed
    1. Renegar KB, Small PA Jr., Boykins LG, Wright PF, Role of IgA versus IgG in the control of influenza viral infection in the murine respiratory tract Journal of immunology (Baltimore, Md. : 1950) 173, 1978–1986 (2004). - PubMed
    1. Sun K, Johansen FE, Eckmann L, Metzger DW, An important role for polymeric Ig receptor-mediated transport of IgA in protection against Streptococcus pneumoniae nasopharyngeal carriage Journal of immunology (Baltimore, Md. : 1950) 173, 4576–4581 (2004). - PubMed

Publication types

MeSH terms

Substances