. 2020 Feb 7;11(1):777.
doi: 10.1038/s41467-019-13943-3.

4D imaging of lithium-batteries using correlative neutron and X-ray tomography with a virtual unrolling technique

Affiliations

4D imaging of lithium-batteries using correlative neutron and X-ray tomography with a virtual unrolling technique

Ralf F Ziesche et al. Nat Commun. .

Abstract

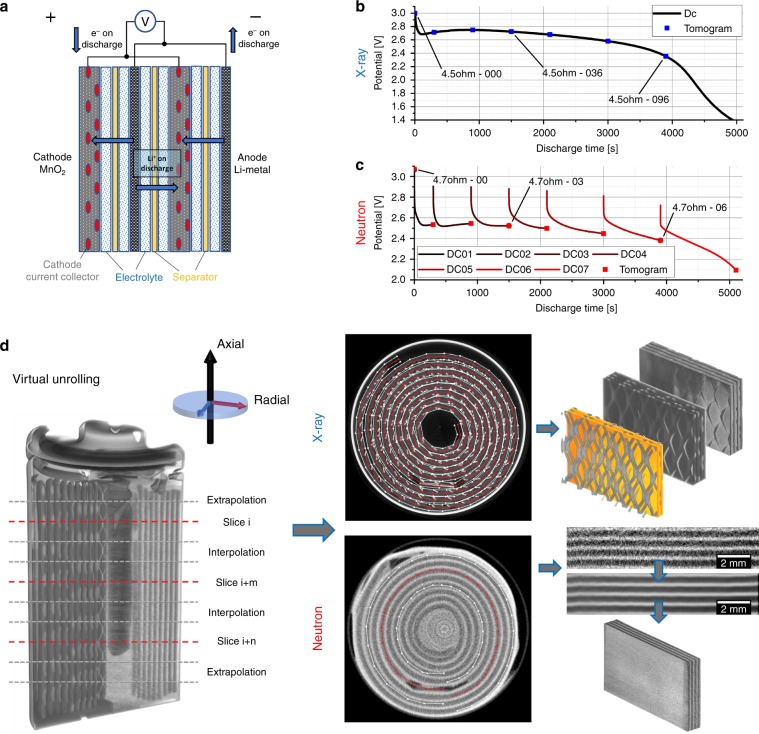
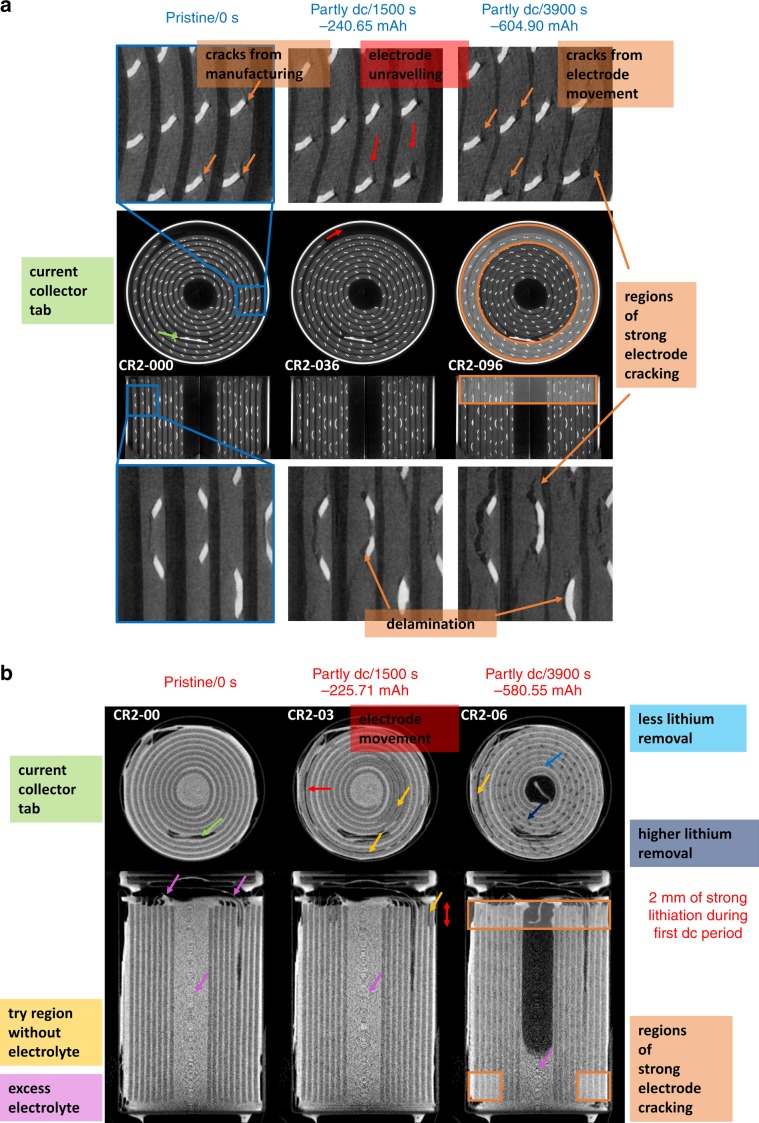
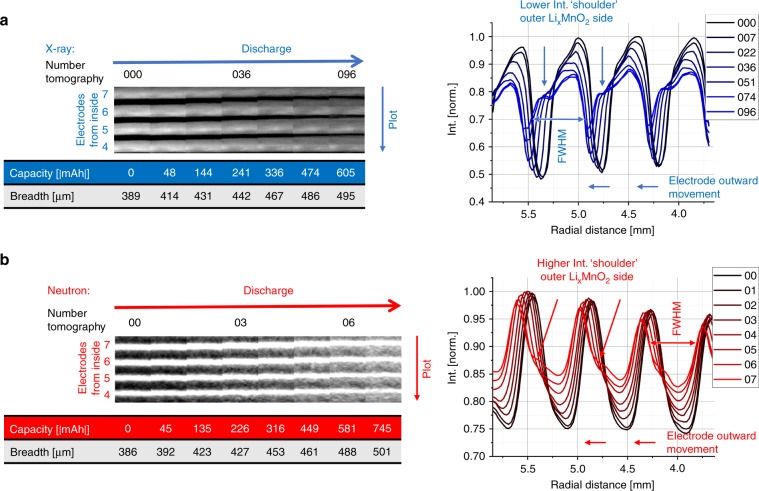
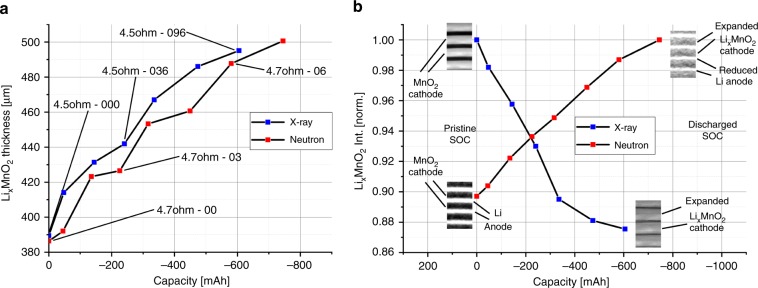
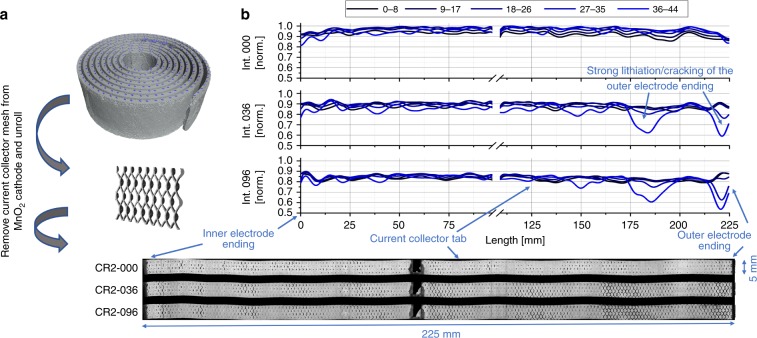
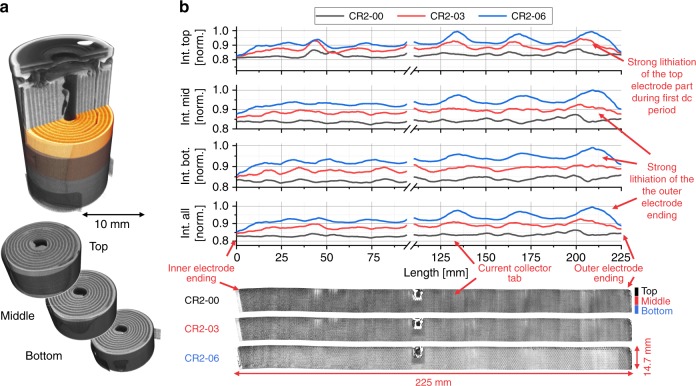
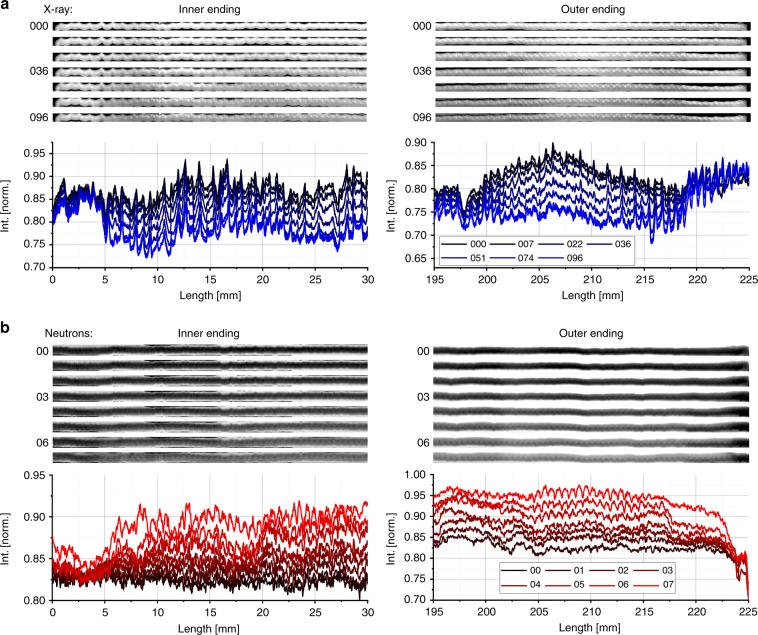
The temporally and spatially resolved tracking of lithium intercalation and electrode degradation processes are crucial for detecting and understanding performance losses during the operation of lithium-batteries. Here, high-throughput X-ray computed tomography has enabled the identification of mechanical degradation processes in a commercial Li/MnO2 primary battery and the indirect tracking of lithium diffusion; furthermore, complementary neutron computed tomography has identified the direct lithium diffusion process and the electrode wetting by the electrolyte. Virtual electrode unrolling techniques provide a deeper view inside the electrode layers and are used to detect minor fluctuations which are difficult to observe using conventional three dimensional rendering tools. Moreover, the 'unrolling' provides a platform for correlating multi-modal image data which is expected to find wider application in battery science and engineering to study diverse effects e.g. electrode degradation or lithium diffusion blocking during battery cycling.


Conflict of interest statement

The authors declare no competing interests.

Figures

Fig. 1
Fig. 1. Illustration of the cell operation, discharge curves and virtual unrolling technique.
Image a shows an illustration of the studied Li/MnO2 CR2 primary cell from Duracell. Graph b shows the constant resistance discharge curve for the CR2 cell over 4.5 Ω, where simultaneous fast X-ray CT was carried out. Graph c shows the constant resistance discharge curve over 4.7 Ω, where the discharge was interrupted for each neutron tomography after a certain time interval. Image d displays the reconstructed tomograms from neutron and X-ray CT along with examples of sections extracted following virtual unrolling of the reconstructions. Clearly visible in the X-ray images is the nickel current collecting mesh, which appears brighter than the LixMnO2 active electrode material.
Fig. 2
Fig. 2. 3D reconstructed operando X-ray and in situ neutron tomograms.
a shows horizontal and vertical orthogonal slices out of the X-ray tomograms. In total, 103 tomograms were recorded labelled from CR2-000 to CR2-102. One tomogram was recorded every 40 s with a total acquisition period of 2.8 s. Here the pristine state and two partly discharged states are presented. The images show the cracking and volume expansion of the MnO2 electrode during cell discharging. The highly absorbing steel casing is visible as very bright ring around the wounded membrane–electrode ensemble. The contrast was optimised in order to improve the contrast within the lower attenuating components. b shows orthogonal slices of the neutron tomogram captured during the discharge over a 4.7 Ω resistor, where the lithium electrode and the excess of electrolyte in the middle of the cell are clearly visible. Lithium intercalation and electrolyte consumption are observed, as well as electrode cracking and electrolyte consumption. In total, eight neutron tomograms were collected with an acquisition period of about 8 h. The discharging process was interrupted for each tomogram and labelled with CR2-00 from the pristine to CR2-07, the fully discharged SoC.
Fig. 3
Fig. 3. Cathode thickness and intensity change during discharging.
a shows cut-outs of virtual unrolled multilayer sections of the measured X-ray tomograms at different SoC from the pristine state (000) to the partly discharged state (096) to −604.90 mAh. The thickness increases of the LixMnO2 electrode, during the discharge, is about 27% measured by the full-width at half-maximum (FWHM). The intensity plot shows a higher lithium intercalation in the cell outward electrode side by a lower intensity ‘shoulder’. b shows a similar behaviour for the discharged cell imaged by neutrons. The electrode swelling is about 30% for a cell discharge to −745.08 mAh (07) and 26.5% to 580.55 mAh (06), which shows a similar electrode expansion as for the X-ray tomograms due to the similar discharge conditions. The plots illustrate the complementarity between X-rays and neutrons.
Fig. 4
Fig. 4. Cathode thickness and intensity variation vs. capacity.
Plot a shows the LixMnO2 electrode thickness increase by the lithium intercalation during cell discharging by similar c-rates. For similar c-rates, the electrode thickness increases uniformly. But it seems that a slightly higher c-rate (blue) causes a higher increase in the volume expansion in comparison to lower c-rates (red). The graphs in b compare the intensity change of the LixMnO2 electrode during discharging. The lithium intercalation process in the electrode causes an intensity decrease for X-rays and an increase for neutrons (for comparisons see Fig. 3).
Fig. 5
Fig. 5. Lithium distribution at various depths of the LixMnO2 electrode during discharging, using unrolled X-ray tomography data of the upper part of a CR2 cell.
For the analysis of the lithium distribution over the MnO2 electrode thickness, a the current metal collector mesh is digitally removed before the electrode is unrolled. The electrode thickness is divided into five depths and the normalised grey values plotted over the electrode lengths. b represents the changed lithium distribution for the tomograms CR2-000, CR2-036 and CR2-096. The lithium content or cracking increases much more on the outer electrode side (blue) compared to the inner side and the electrode outer ending, as indicated by the reduced grey values. The lithium content is highest at the side of the current collector tab, exhibiting sinusoidal variation with increasing amplitude as the cell discharges.
Fig. 6
Fig. 6. Organisation of electrode unrolling (top, middle, bottom) and analysis of the lithium distribution in the LixMnO2 electrode during discharging using neutron tomography data.
The analysis of the lithium intercalation in the LixMnO2 electrode is divided in four sections, the top, middle, bottom and overall part. a shows the pristine neutron tomogram divided in the studied parts. b displays the unrolled and over the thickness averaged electrodes of the pristine (CR2-00), partly discharged to −225.71 mAh (CR2-03) and partly discharged to −580.55 mAh (CR2-06) SoC and the related line plots. The intensity increase, due to the lithium intercalation, during discharging is clearly visible. On the top, the electrode undergoes a very strong lithiation during the first period of discharging. Over the electrode length, a sinusoidal intensity profile with increasing period is observed, with maxima at the tab side. This structure is caused by a higher lithium content on that side.
Fig. 7
Fig. 7. Electrode endings and middle part at different SoC.
The images and line plots in a, b show the attenuation of the LixMnO2 electrode during cell discharging for the X-ray and neutron imaged cells, respectively. In both cases, the inner electrode parts show an almost homogeneous lithiation (not displayed here). The electrode endings do not show any lithiation activity for the X-ray scans and late start of lithiation in case of the outer electrode endings for the neutron scans.

References

    1. Finegan DP, et al. Identifying the cause of rupture of Li-ion batteries during thermal runaway. Adv. Sci. 2017;5:1700369 1–13. - PMC - PubMed
    1. Shearing PR, Howard LE, Jørgensen PS, Brandon NP, Harris SJ. Characterization of the 3-dimensional microstructure of a graphite negative electrode from a Li-ion battery. Electrochem. commun. 2010;12:374–377. doi: 10.1016/j.elecom.2009.12.038. - DOI
    1. Ebner M, Chung DW, García RE, Wood V. Tortuosity anisotropy in lithium-ion battery electrodes. Adv. Energy Mater. 2014;4:1–6. doi: 10.1142/9789814513289_0001. - DOI - PubMed
    1. Eastwood DS, et al. Three-dimensional characterization of electrodeposited lithium microstructures using synchrotron X-ray phase contrast imaging. Chem. Commun. 2015;51:266–268. doi: 10.1039/C4CC03187C. - DOI - PubMed
    1. Finegan DP, et al. In-operando high-speed tomography of lithium-ion batteries during thermal runaway. Nat. Commun. 2015;6:1–10. doi: 10.1038/ncomms7924. - DOI - PMC - PubMed

Publication types