. 2020 Feb 7;11(1):778.
doi: 10.1038/s41467-020-14499-3.

Increased circulating levels of Factor H-Related Protein 4 are strongly associated with age-related macular degeneration

Affiliations

Increased circulating levels of Factor H-Related Protein 4 are strongly associated with age-related macular degeneration

Valentina Cipriani et al. Nat Commun. .

Abstract

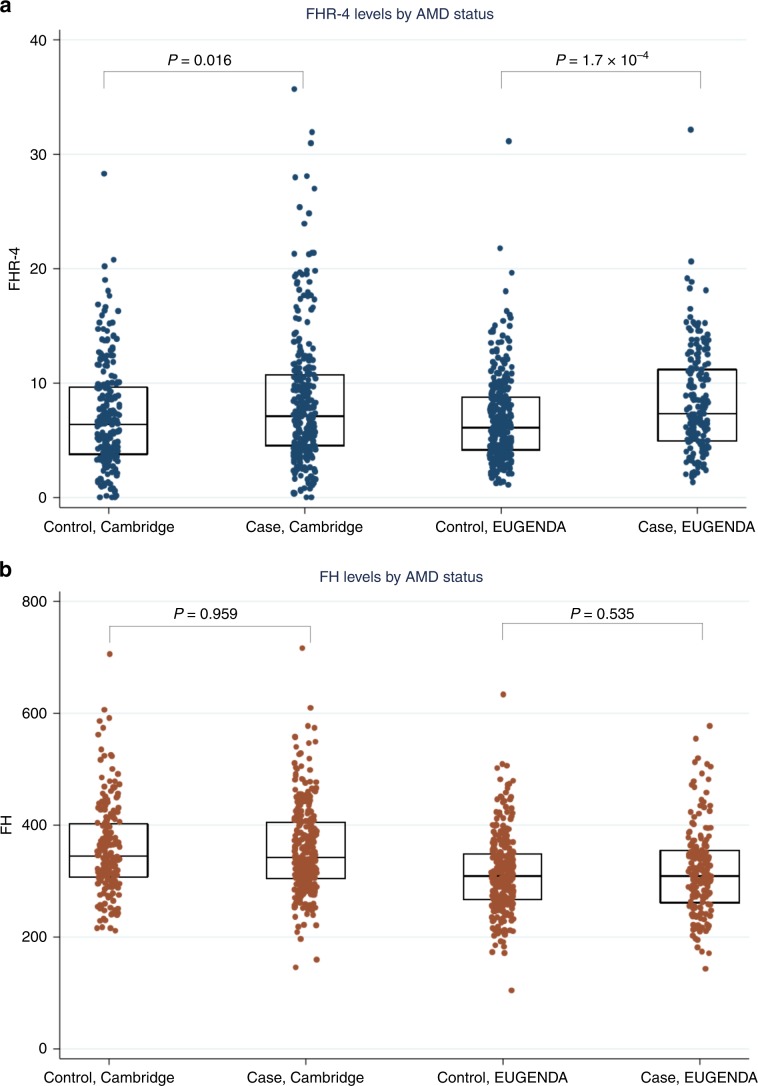
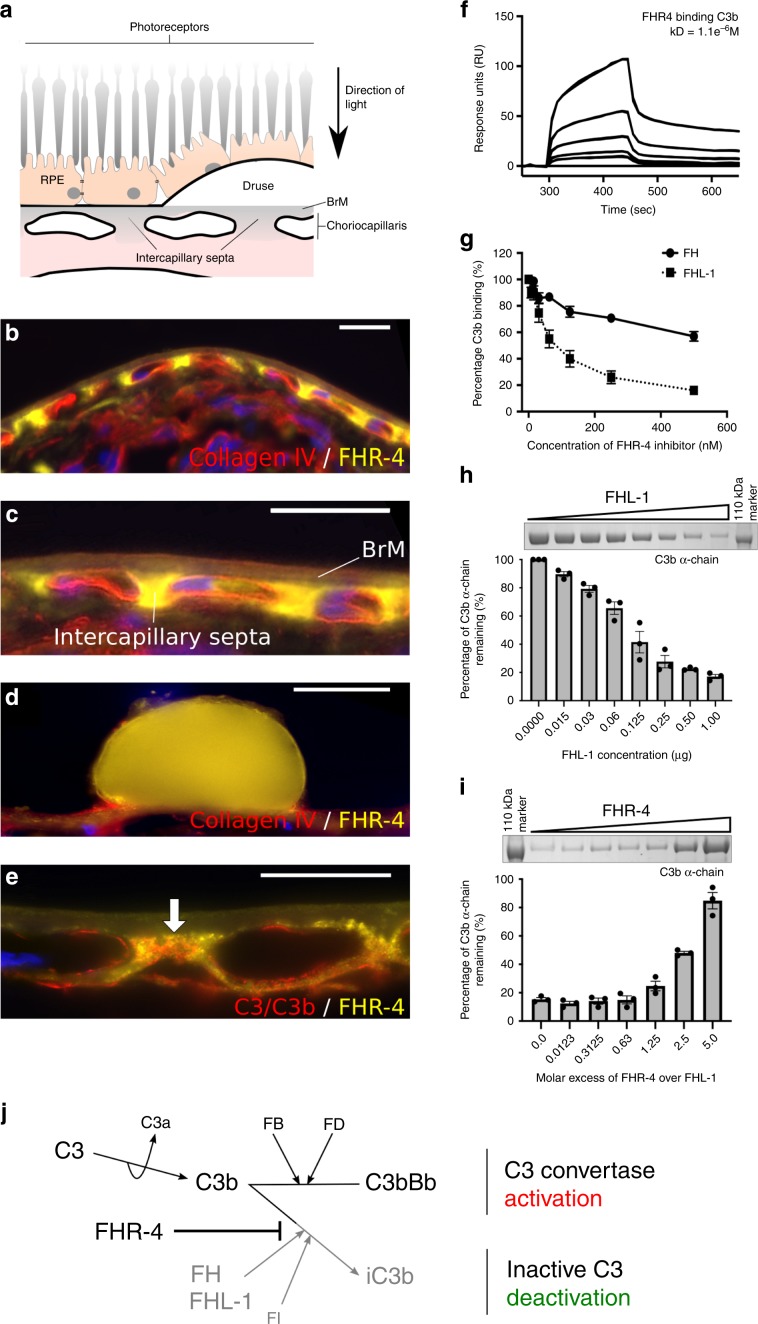
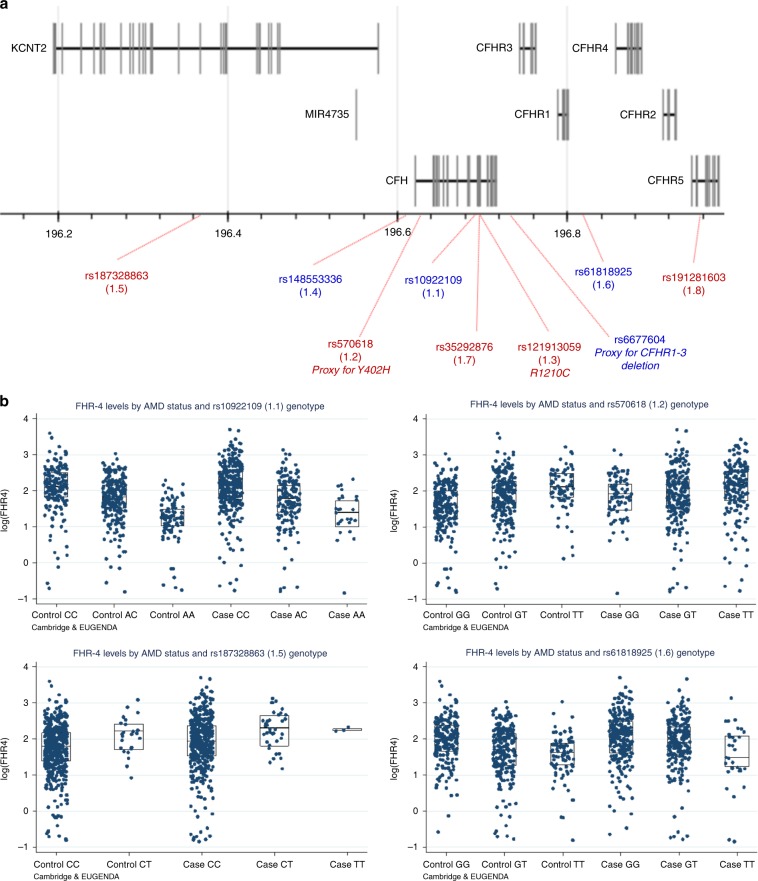
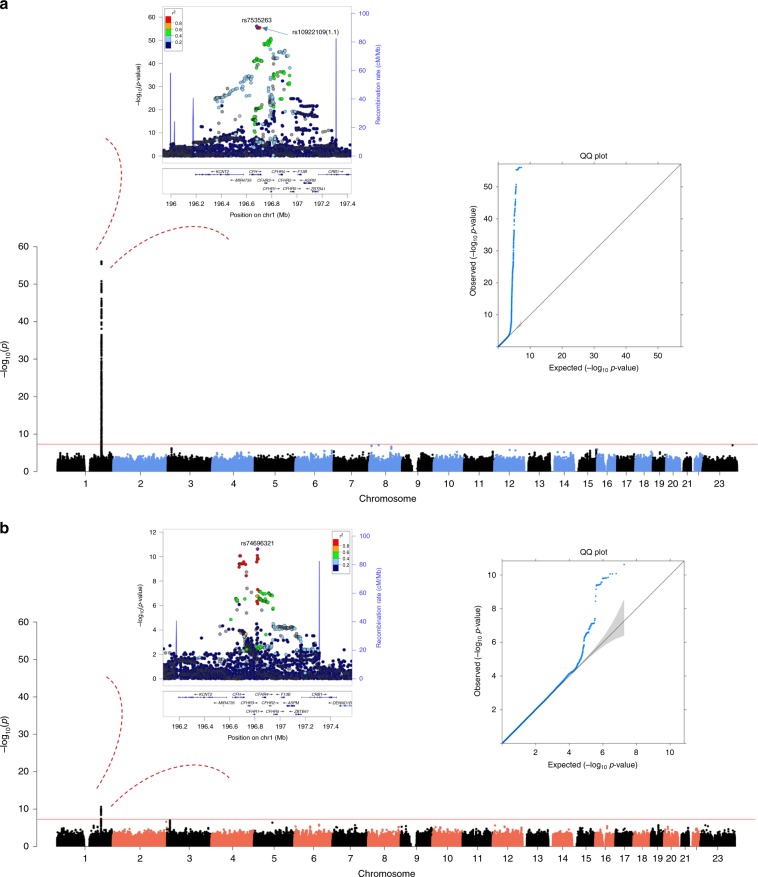
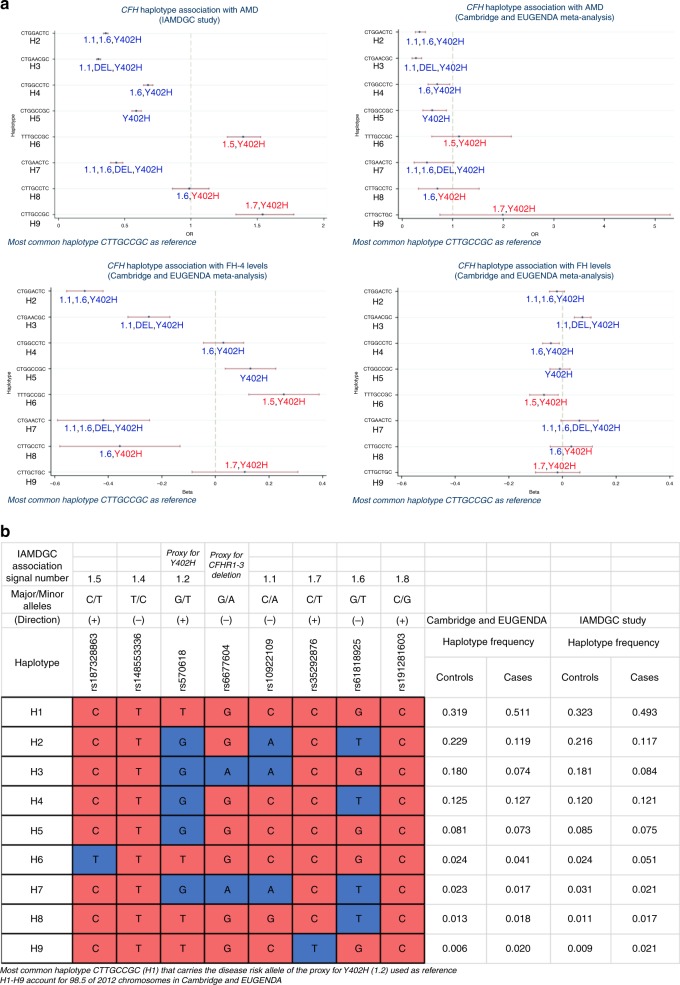
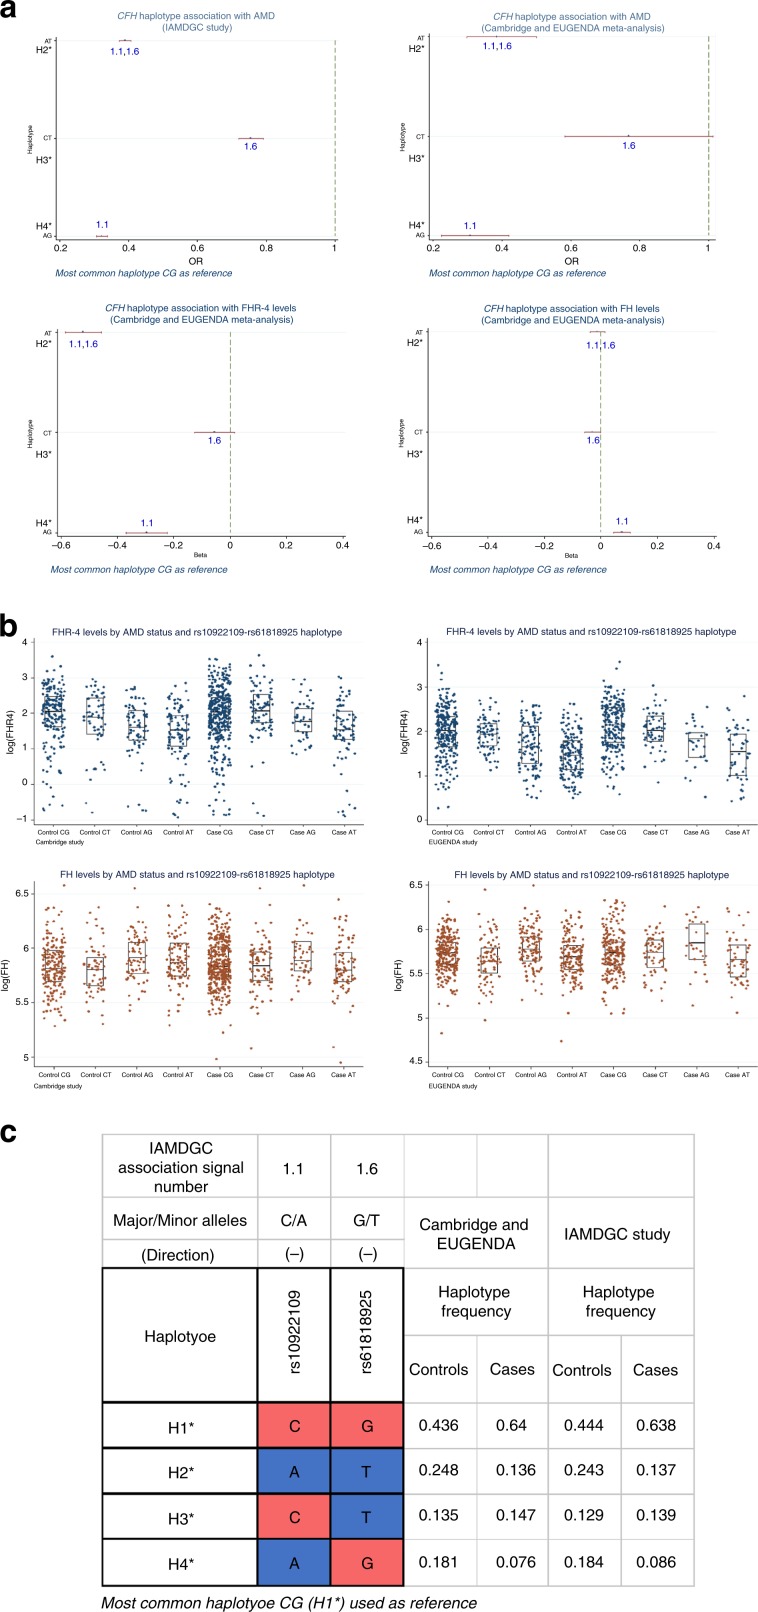
Age-related macular degeneration (AMD) is a leading cause of blindness. Genetic variants at the chromosome 1q31.3 encompassing the complement factor H (CFH, FH) and CFH related genes (CFHR1-5) are major determinants of AMD susceptibility, but their molecular consequences remain unclear. Here we demonstrate that FHR-4 plays a prominent role in AMD pathogenesis. We show that systemic FHR-4 levels are elevated in AMD (P-value = 7.1 × 10⁻⁶), whereas no difference is seen for FH. Furthermore, FHR-4 accumulates in the choriocapillaris, Bruch's membrane and drusen, and can compete with FH/FHL-1 for C3b binding, preventing FI-mediated C3b cleavage. Critically, the protective allele of the strongest AMD-associated CFH locus variant rs10922109 has the highest association with reduced FHR-4 levels (P-value = 2.2 × 10-56), independently of the AMD-protective CFHR1-3 deletion, and even in those individuals that carry the high-risk allele of rs1061170 (Y402H). Our findings identify FHR-4 as a key molecular player contributing to complement dysregulation in AMD.


Conflict of interest statement

The authors declare no competing interests.

Figures

Fig. 1
Fig. 1. Systemic FHR-4 levels are elevated in AMD patients.
a shows box plots (and corresponding data points) of FHR-4 levels measured in two separate AMD cohorts: Cambridge (plasma from 214 controls and 304 late AMD cases) and EUGENDA (serum from 308 controls and 180 late AMD cases). AMD patients show statistically significantly elevated FHR-4 levels compared to controls. Geometric mean FHR-4 levels were: Cambridge, 5.5 µg ml−1 in controls vs. 6.6 µg ml−1 in cases; EUGENDA, 6.0 µg ml−1 in controls vs. 7.2 µg ml−1 in cases. These differences remained significant after adjustment for sex, age, batch effects and first two genetic principal components (P value = 0.018 and 8.4 × 10−5 for Cambridge and EUGENDA, respectively; Wald test). b shows box plots (and corresponding data points) of FH levels measured in the same samples, where no statistically significant difference between cases and controls was observed: Cambridge, 349.0 µg ml−1 in controls vs. 348.6 µg ml−1 in cases; EUGENDA, 304.7 µg  ml−1 in controls vs. 308.7 µg ml−1 in cases. Each box plot depicts median value (central line), first quartile (lower bound line) and third quartile (upper bound line). Source data are provided as a Source Data file.
Fig. 2
Fig. 2. Accumulation of FHR-4 in the choriocapillaris inhibits C3b breakdown.
a shows a schematic diagram illustrating anatomical structures in the macula including the retinal pigment epithelium (RPE), the underlying Bruch’s membrane (BrM) and the intercapillary septa within the choriocapillaris; basement membranes are represented as black lines. Drusen, hallmark lesions of early AMD, form within BrM underneath the RPE basement membrane. b, c Immunohistochemistry showing the localization of FHR-4 (yellow) predominantly in the intercapillary septa: weak labelling is also seen within BrM. Collagen IV staining is used to delineate basement membranes, which define the inner and outer borders of BrM (red); DAPI labelling is in blue. FHR-4 is also localized in drusen (d); the RPE is absent from these tissue sections. e Both FHR-4 and C3/C3b localize in the intercapillary septa of the choriocapillaris (white arrow): scale bars 20 μm. SPR analysis showing the binding of FHR-4 to immobilized C3b (f). Solid-phase binding assays demonstrate that FHR-4 can compete off fluid-phase FH or FHL-1 binding to immobilized C3b (g). Measurement of FHL-1-mediated breakdown of C3b by factor I (h); in the presence of fixed concentrations of C3b and factor I, increasing concentrations of FHL-1 result in increased breakdown of the C3b α-chain (see Supplementary Fig. 4 for full gel image). i optimal C3b breakdown conditions from h are repeated, but now include increased concentrations of fluid-phase FHR-4, where an inhibition of FHL-1/FI-mediated C3b α-chain breakdown is observed (see Supplementary Fig. 4 for full gel image). j FHR-4 prevents FHL-1 acting as a cofactor for factor I, this results in the formation of a C3 convertase and the activation of the amplification loop of complement and subsequent inflammation. Data in gi are from n = 3, averaged from three independent experiments ± s.e.m. Source data are provided as a Source Data file.
Fig. 3
Fig. 3. Four AMD risk variants at the CFH locus are strongly associated with FHR-4 levels.
Schematic diagram of chromosome 1 showing the genes in the CFH locus and the genomic location of the eight established AMD risk variants from the large IAMDGC GWAS of AMD and rs6677604, a proxy for the previously reported AMD-protective CFHR1–3 deletion (a). Variant annotations are in red or blue depending on whether the corresponding minor allele is AMD deleterious or protective. The rare missense variant rs121913059 (1.3; R1210C) was only present heterozygously in a case individual from the Cambridge cohort, and therefore was not included in the genetic association analyses with the FHR-4/FH levels. b shows box plots (and corresponding data points) of FHR-4 levels by AMD status and SNP genotype for the four variants that showed significant associations (after Bonferroni correction) with FHR-4 levels (Table 2), in the Cambridge and EUGENDA cohorts combined. Each box plot depicts median value (central line), first quartile (lower bound line) and third quartile (upper bound line). Source data are provided as a Source Data file.
Fig. 4
Fig. 4. GWAS meta-analysis of FHR-4 levels reveals a strong signal spanning the CFH locus.
Each panel shows a Manhattan plot, a regional plot (upper left-hand side) and a quantile–quantile (QQ) plot (upper right-hand side) for the results of the GWAS meta-analysis of FHR-4 levels (a) and FH levels (b). Manhattan plots illustrate P values (Wald test) for each single variant tested for association with log(levels). Observed −log10(P values) are plotted against the genomic position of each variant on chromosomes 1–22 plus the X chromosome. The horizontal red line indicates the threshold considered for genome-wide significance (P value ≤ 5 x 10−8). Regional plots show the only genome-wide association signal observed, that is, at the CFH locus (on chromosome 1q31.3). The most associated variant is denoted by a purple circle and is labelled by its rsID. The other surrounding variants are shown by circles coloured to reflect the extent of LD with the most associated variant (based on 1000 Genomes data, November 2014). A diagram of the genes within the relevant regions is depicted below each plot. Physical positions are based on NCBI RefSeq hg19 human genome reference assembly. QQ plots compare the distribution of the observed test statistics with its expected distribution under the null hypothesis of no association. A marked departure from the null hypothesis (reference line) is seen in the meta-analysis of FHR4 levels. Genomic inflation values (λ) were equal to 1.008 and 1.005 from the GWASs of FHR-4 levels and 1.002 and 1.014 from the GWASs of FH levels, in the Cambridge and EUGENDA studies, respectively.
Fig. 5
Fig. 5. Haplotype analysis identifies CFH locus haplotypes strongly associated with AMD and FHR-4 levels.
a Illustrates the association of the observed common nine haplotypes formed by the seven AMD-associated CFH locus variants considered in our association analyses and rs6677604 (overall haplotype frequency ≥1% in the Cambridge and EUGENDA cohorts combined, accounting for 98.5% of 2012 chromosomes) with AMD and with FHR-4/FH levels. Details of the alleles forming the haplotypes together with the frequency distribution in the two cohorts combined, and as estimated in the IAMDGC dataset (16,144 patients with advanced AMD and 17,832 controls of European ancestry), are shown in b: haplotype CTTGCCGC (H1) that carries the AMD increasing-risk allele T of the proxy for Y402H (1.2) is used as reference (coloured in red); alleles that are different from the reference are coloured in blue; the direction of association with AMD for the minor allele of each single variant as estimated in the IAMDGC study is indicated within parentheses. Four association plots are displayed in a: the first two (top) plots show the OR (with CI) estimates for the CFH haplotype association with AMD in the IAMDGC dataset and our two-cohort meta-analysis, respectively; the third and fourth (bottom) plots show the β (with CI) estimates for the CFH haplotype association with FHR-4 and FH levels, respectively, in our two-cohort meta-analysis; haplotype H1 is used as reference. The estimates shown in each plot are labelled further to indicate the presence of alleles that differ from the reference; those alleles are indicated with the IAMDGC association signal numbers of the corresponding variants (1.1, 1.5–1.7), in red to indicate that the allele different from the reference is AMD risk-increasing allele, in blue if protective; the Y402H label is blue to indicate the presence of the protective allele G of variant 1.2, red for the AMD risk-increasing allele T; finally, the label DEL indicates the presence of the protective allele A of the proxy for the CFHR1-3 deletion (rs6677604). See Supplementary Data 9 for full details of the haplotype association estimates. Source data are provided as a Source Data file.
Fig. 6
Fig. 6. The AMD-associated variants rs10922109 (1.1) and rs61818925 (1.6) are a minimal set of variants that explain the genetic effect on FHR-4 levels at the CFH locus.
a illustrates the association of the observed four haplotypes formed by the two independently AMD-associated variants rs10922109 (1.1) and rs61818925 (1.6) at the CFH locus with AMD and with FHR-4/FH levels. Variants 1.1 and 1.6 represent the best two single-variant association signals with FHR-4 levels in the Cambridge and EUGENDA meta-analysis (Table 2). Details of the alleles forming the haplotypes together with the frequency distribution in the two cohorts combined (484 patients with advanced AMD and 522 controls) and as estimated in the IAMDGC dataset (16,144 patients with advanced AMD and 17,832 controls of European ancestry) are shown in c: most common haplotype CG (H1*) is used as reference (coloured in red); alleles that are different from the reference are coloured in blue; the direction of association with AMD for the minor allele of each single variant as estimated in the IAMDGC study is indicated within parentheses. Four association plots are displayed in a: the first two (top) plots show the OR (with CI) estimates for the CFH haplotype association with AMD in the IAMDGC dataset and our two-cohort meta-analysis, respectively; the third and fourth (bottom) plots show the β (with CI) estimates for the CFH haplotype association with FHR-4 and FH levels, respectively, in our two-cohort meta-analysis; haplotype H1* is used as reference. The estimates shown in each plot are labelled further to indicate the presence of alleles that differ from the reference; those alleles are indicated with the IAMDGC association signal numbers of the corresponding variants (1.1 and 1.6), in blue to indicate that the allele different from the reference is AMD protective. See Supplementary Data 11 for full details of the rs10922109–rs61818925 haplotype association estimates. Finally, b shows box plots (and corresponding data points) of FHR-4 levels (top) and FH levels (bottom) by rs10922109–rs61818925 haplotype for each study cohort (Cambridge and EUGENDA). Each box plot depicts median value (central line), first quartile (lower bound line) and third quartile (upper bound line). Source data are provided as a Source Data file.

References

    1. Wong WL, et al. Global prevalence of age-related macular degeneration and disease burden projection for 2020 and 2040: a systematic review and meta-analysis. Lancet Glob. Health. 2014;2:e106–e116. doi: 10.1016/S2214-109X(13)70145-1. - DOI - PubMed
    1. Curcio CA. Soft drusen in age-related macular degeneration: biology and targeting via the oil spill strategies. Invest. Ophthalmol. Vis. Sci. 2018;59:AMD160–AMD181. doi: 10.1167/iovs.18-24882. - DOI - PMC - PubMed
    1. Crabb JW. The proteomics of drusen. Cold Spring Harb. Perspect. Med. 2014;4:a017194. doi: 10.1101/cshperspect.a017194. - DOI - PMC - PubMed
    1. Ferris FL, 3rd, et al. Clinical classification of age-related macular degeneration. Ophthalmology. 2013;120:844–851. doi: 10.1016/j.ophtha.2012.10.036. - DOI - PMC - PubMed
    1. Fritsche LG, et al. A large genome-wide association study of age-related macular degeneration highlights contributions of rare and common variants. Nat. Genet. 2016;48:134–143. doi: 10.1038/ng.3448. - DOI - PMC - PubMed

Publication types

MeSH terms