. 2020 Feb 7;11(1):787.
doi: 10.1038/s41467-020-14609-1.

Rapid and site-specific deep phosphoproteome profiling by data-independent acquisition without the need for spectral libraries

Affiliations

Rapid and site-specific deep phosphoproteome profiling by data-independent acquisition without the need for spectral libraries

Dorte B Bekker-Jensen et al. Nat Commun. .

Abstract

Quantitative phosphoproteomics has transformed investigations of cell signaling, but it remains challenging to scale the technology for high-throughput analyses. Here we report a rapid and reproducible approach to analyze hundreds of phosphoproteomes using data-independent acquisition (DIA) with an accurate site localization score incorporated into Spectronaut. DIA-based phosphoproteomics achieves an order of magnitude broader dynamic range, higher reproducibility of identification, and improved sensitivity and accuracy of quantification compared to state-of-the-art data-dependent acquisition (DDA)-based phosphoproteomics. Notably, direct DIA without the need of spectral libraries performs close to analyses using project-specific libraries, quantifying > 20,000 phosphopeptides in 15 min single-shot LC-MS analysis per condition. Adaptation of a 3D multiple regression model-based algorithm enables global determination of phosphorylation site stoichiometry in DIA. Scalability of the DIA approach is demonstrated by systematically analyzing the effects of thirty kinase inhibitors in context of epidermal growth factor (EGF) signaling showing that specific protein kinases mediate EGF-dependent phospho-regulation.


Conflict of interest statement

The authors O.M.B., L.V., T.G. and L.R. are employees of Biognosys AG (Zurich, Switzerland). The other authors declare no competing interests.

Figures

Fig. 1
Fig. 1. High-throughput and sensitive phosphoproteomics for DDA and DIA—identification and quantification.
a Experimental workflow for phosphoproteomics. b Comparison of quantified phosphopeptides with DDA & DIA. c Overlap of phosphopeptides between two replica with DDA. d Overlap of phosphopeptides between two replica with DIA. e Correlation between replicates with DDA. f Correlation between replicates with DIA. g Ions measured in the orbitrap in MS2 scans with DDA and DIA. h Quantified difference in ions measured in the orbitrap for DDA and DIA. i Experimental workflow for evaluation of accuracy and precision of the method. j Boxplot of measured and theoretical ratios for yeast phosphopeptides with DDA and DIA from six independent measurements. Boxes mark the first and third quantile, with the median highlighted as dash, and whiskers marking the minimum/maximum value within 1.5 interquartile range. Outliers are not shown. k Mean squared errors for DDA and DIA from six independent measurements were calculated as a sum of positive bias and variance for each method and all replicates. l Receiver operating characteristic (ROC) curves for DDA and DIA from six independent measurements were calculated by using the d-score from SAM testing as an indicator for significant regulation. SAM testing for significantly regulated phosphopeptides was performed at default settings (s0 estimation automatic). ROC plots are presented as zoomed-in excerpts from the total plots, shown on the lower right each. Source data for this figure are provided as a Source Data file.
Fig. 2
Fig. 2. Challenges and solutions for phosphoDIA.
a Confirming and refuting fragments for site localization. b Calculation of site localization confidence score. The score for a given site localization candidate is calculated by summing all confirming fragments matched and subtracting the sum of all refuting fragments matched. c Workflow to evaluate localization algorithm with MaxQuant. d Error rates for phosphorylation site assignment in DDA and DIA. e Coverage of assigned phosphorylation site in a diluted yeast background for DDA and DIA. Source data for this figure are provided as a Source Data file.
Fig. 3
Fig. 3. Technical comparison of DDA and different types of DIA in a biological setting.
a Experimental workflow. b Overview of identified phosphopeptides, localized phosphosites, and ANOVA (s0 = 0.1, FDR 0.5) regulated sites for the different methods. c Heatmap of unsupervised clustering analysis of ANOVA-regulated phosphosites for DDA workflow (d) and for DIA workflow with project-specific library (e). Linear sequence motif analysis for two major clusters marked in colored boxes on heatmaps. All data are shown for three independent measurements.
Fig. 4
Fig. 4. Stoichiometry benchmark.
a Experimental workflow for experiment with controlled ratios. b Boxplot of calculated phosphorylation stoichiometry with DDA and DIA from six independent measurements. Boxes mark the first and third quantile, with the median highlighted as dash, and whiskers marking the minimum/maximum value within 1.5 interquartile range. Outliers are not shown. c Mean squared errors for calculated stoichiometries with DDA and DIA from six independent measurements were calculated as a sum of positive bias and variance for each method and all replicates. d Volcano plot analysis of calculated occupancies EGF vs. control from three independent measurements. Source data for this figure are provided as a Source Data file.
Fig. 5
Fig. 5. Kinase inhibitor screen.
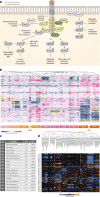
a Experimental overview of kinase inhibitors used. b Hierarchical clustering of averaged site intensities from six independent measurements. c Fisher Exact test of overrepresented kinase motifs. d Clustering analysis of known substrates and individual kinases.

References

    1. Olsen JV, Mann M. Status of large-scale analysis of post-translational modifications by mass spectrometry. Mol. Cell. Proteomics. 2013;12:3444–3452. doi: 10.1074/mcp.O113.034181. - DOI - PMC - PubMed
    1. Olsen JV, et al. Global, in vivo, and site-specific phosphorylation dynamics in signaling networks. Cell. 2006;127:635–648. doi: 10.1016/j.cell.2006.09.026. - DOI - PubMed
    1. Villén J, Beausoleil SA, Gerber SA, Gygi SP. Large-scale phosphorylation analysis of mouse liver. Proc. Natl Acad. Sci. USA. 2007;104:1488–1493. doi: 10.1073/pnas.0609836104. - DOI - PMC - PubMed
    1. Lundby A, et al. In vivo phosphoproteomics analysis reveals the cardiac targets of β-adrenergic receptor signaling. Sci. Signal. 2013;6:rs11. doi: 10.1126/scisignal.2003506. - DOI - PubMed
    1. Francavilla C, et al. Multilayered proteomics reveals molecular switches dictating ligand-dependent EGFR trafficking. Nat. Struct. Mol. Biol. 2016;23:608–618. doi: 10.1038/nsmb.3218. - DOI - PubMed

Publication types

MeSH terms