Epidemiology and Predictors of all-cause 30-Day readmission in patients with sickle cell crisis
- PMID: 32034210
- PMCID: PMC7005718
- DOI: 10.1038/s41598-020-58934-3
Epidemiology and Predictors of all-cause 30-Day readmission in patients with sickle cell crisis
Abstract
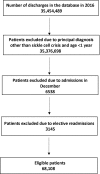
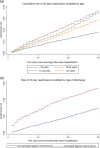
The 30-day readmission rate after hospitalization for a sickle cell crisis (SCC) is extremely high. Accurate information on readmission diagnoses, total readmission costs and factors associated with readmission is required to effectively plan resource allocation and to plan interventions to reduce readmission rates. The present study aimed to examine readmission diagnoses and factors associated with all-cause 30-day readmission after hospitalization for SCC. We analyzed 2016 nationwide readmission database (NRD) to identify patterns of 30-day readmission by patient demographic characteristics and time after hospitalization for SCC. We estimated the percentage and most common readmission diagnoses for 30-day and 7-day readmissions after discharge. We studied the relationship between risk factors and readmission and the impact of readmission on patient outcomes and resulting financial burden on health care in dollars. In 2016, of 67,887 discharges after index hospitalizations, 18099 (26.9%) were readmitted within 30-days. Of all readmissions, 5166 (7.6%) were readmitted within 7 days. The spectrum of readmission diagnoses was largely similar in both 30-day and 7-day readmission with more than 80% patients in both time periods readmitted with diagnoses related to SCC. The mean length of stay for readmitted patients was significantly longer than the index hospitalization (5.3 days (5.1-5.5) vs 4.9 days (CI 4.8-5.1, p < 0.01). Also, the mean cost of hospitalization in readmitted patients $8485 was significantly higher than the index hospitalization $8064 p < 0.01. In 2016, readmission among patients with SCC incurred an additional 95,445 hospitalization days resulting a total charge of $609 million and a total cost of $152 million in the US. On Multivariate analysis, age group 18-30 years, discharge against medical advice, higher Charlson comorbidity index, low socioeconomic status and admission at high volume centers were associated with a higher likelihood of 30-day readmission. Among patients hospitalized for SCC, 30-day readmissions were frequent throughout the month post hospitalization and resulted in an enormous financial burden on the United States healthcare system.
Conflict of interest statement
Vivek Kumar No, I declare that I have no competing interests as defined by Nature Research, or other interests that might be perceived to influence the results and/or discussion reported in this paper. Neha Chaudhary No, I declare that I have no competing interests as defined by Nature Research, or other interests that might be perceived to influence the results and/or discussion reported in this paper. Maureen Achebe None No, I declare that I have no competing interests as defined by Nature Research, or other interests that might be perceived to influence the results and/or discussion reported in this paper.
Figures
References
-
- Why Not the Best? Results from the National Scorecard on U.S. Health System Performance, 2011 | Commonwealth Fund 2011 [Available from: https://www.commonwealthfund.org/publications/fund-reports/2011/oct/why-....
-
- Why Not the Best? Results from the National Scorecard on U.S. Health System Performance, 2011 | Commonwealth Fund 2019 [Available from: https://www.commonwealthfund.org/publications/fund-reports/2011/oct/why-....
MeSH terms
LinkOut - more resources
Full Text Sources
Medical
Research Materials


