. 2020 Feb 7;10(1):2176.
doi: 10.1038/s41598-020-58986-5.

Resilience of marine invertebrate communities during the early Cenozoic hyperthermals

Affiliations

Resilience of marine invertebrate communities during the early Cenozoic hyperthermals

William J Foster et al. Sci Rep. .

Abstract

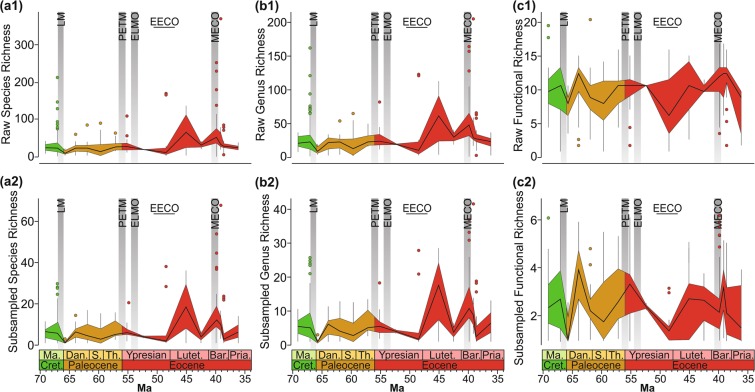
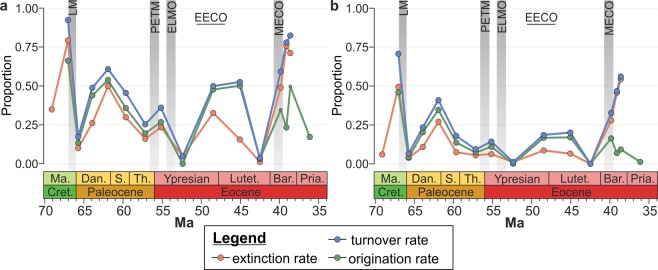
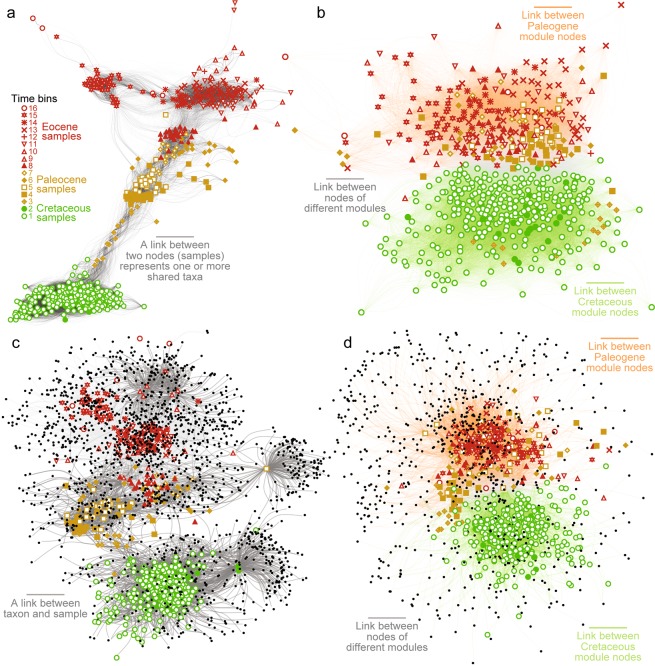
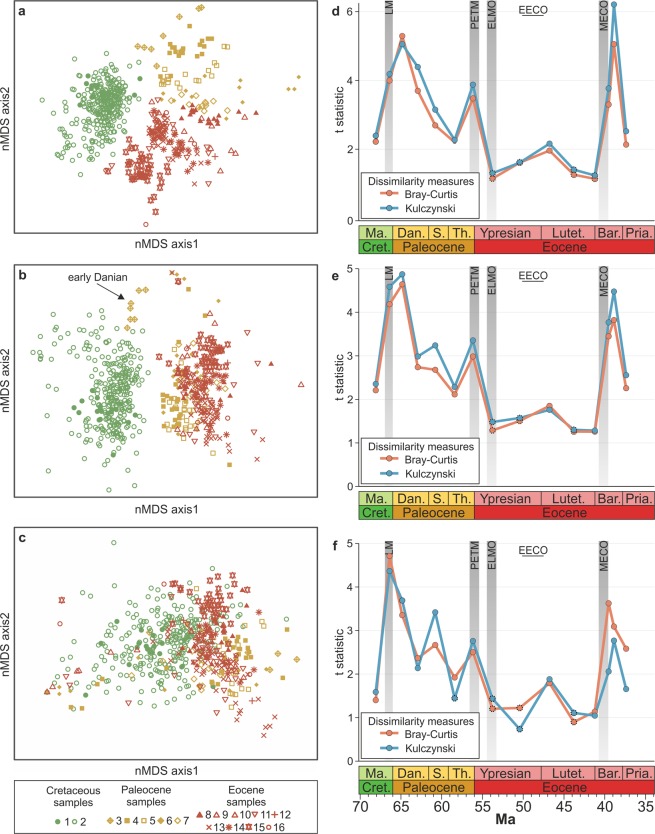
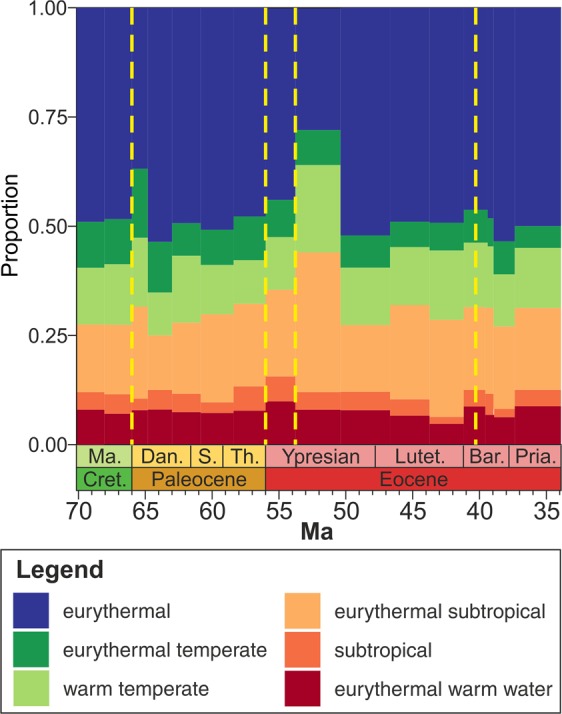
The hyperthermal events of the Cenozoic, including the Paleocene-Eocene Thermal Maximum, provide an opportunity to investigate the potential effects of climate warming on marine ecosystems. Here, we examine the shallow benthic marine communities preserved in the late Cretaceous to Eocene strata on the Gulf Coastal Plain (United States). In stark contrast to the ecological shifts following the end-Cretaceous mass extinction, our data show that the early Cenozoic hyperthermals did not have a long-term impact on the generic diversity nor composition of the Gulf Coastal Plain molluscan communities. We propose that these communities were resilient to climate change because molluscs are better adapted to high temperatures than other taxa, as demonstrated by their physiology and evolutionary history. In terms of resilience, these communities differ from other shallow-water carbonate ecosystems, such as reef communities, which record significant changes during the early Cenozoic hyperthermals. These data highlight the strikingly different responses of community types, i.e., the almost imperceptible response of molluscs versus the marked turnover of foraminifera and reef faunas. The impact on molluscan communities may have been low because detrimental conditions did not devastate the entire Gulf Coastal Plain, allowing molluscs to rapidly recolonise vacated areas once harsh environmental conditions ameliorated.


Conflict of interest statement

The authors declare no competing interests.

Figures

Figure 1
Figure 1
Changes in the diversity of molluscan assemblages during the Late Cretaceous-Eocene interval along the Gulf Coastal Plain. Raw species richness (a1), generic richness (b1), and functional richness (c1) of faunal samples. Subsampled species-level richness (a2), genus-level richness (b2), and functional richness (c2) using the SQS method. Solid black line is the median, the top and bottom of the shaded area corresponds to the first and third quartiles, and the vertical lines represent the lowest and highest datum within 1.5 times of the interquartile range. Points outside of these lines are outliers. The Late Cretaceous and early Cenozoic hyperthermal events discussed in the text are highlighted by vertical grey bars: LM = Latest Maastrichtian, PETM = Paleocene/Eocene Thermal Maximum, ELMO = Eocene Thermal Maximum 2, MECO = Middle Eocene Climatic Optimum. The climax of the early Eocene long-term warming trend is shown by a horizontal bar, i.e., the Early Eocene Climatic Optimum (EECO). Abbreviations: Ma. = Maastrichtian, Cret. = Cretaceous, Dan. = Danian, S. = Selandian, Th. = Thanetian, Lutet. = Lutetian, Bar. = Bartonian, Pria. = Priabonian. Note: samples with <50 specimens were excluded from the analysis. The number of samples in each time interval is shown in Table S1.
Figure 2
Figure 2
Turnover, extinction, and origination rates during the Late Cretaceous-Eocene interval along the Gulf Coastal Plain. (a) Species-level. (b) Genus-level. Turnover and origination rates were removed for the first time bin and turnover and extinction rates from the last time bin due to the influence of edge effects. See Fig. 1 for abbreviations.
Figure 3
Figure 3
Network analysis of early Cenozoic molluscan communities from the Gulf Coastal Plain. (a,b) Unipartite network graphs showing changes in the composition of molluscan assemblages. Two samples are connected if they share one or more taxa, and each connection weight equals the Bray-Curtis similarity of the samples calculated from taxon data. (a) Bray-Curtis similarity calculated from species data (modularity, 0.399758). (b) Bray-Curtis similarity calculated from genus data (modularity, 0.2434448). In (b), modules found with the walktrap community detection algorithm (step length equal to 5) are illustrated with green and orange connections. (c,d) Bipartite network graphs showing changes in the presence and absence of mollusc taxa among samples. Taxa are connected to their samples, and vice versa, with non-weighted links. The modules found with COPRA method are illustrated with green and orange connections. Black nodes in (c) are species (modularity of sample projection, 0.766; modularity of species projection, 0.795), and in (d) are genera (modularity of sample projection, 0.417; modularity of species projection, 0.551).
Figure 4
Figure 4
Changes in the composition of molluscan assemblages during the Upper Cretaceous-Eocene interval along the Gulf Coastal Plain. Non-metric multidimensional scaling (nMDS) ordination of molluscan assemblages based on (a) species, (b), genera, and (c) functional compositions. Samples with <50 specimens and individual stress values > 0.3 were excluded. Colours of data points correspond to the different epochs (as in Fig. 1); sample numbering (and symbols) corresponds to the time bins of Fig. S2. T-statistic from the PERMANOVA test using the Bray-Curtis dissimilarity of centroids for relative abundances and Kulczynski dissimilarity of centroids for presence/absence based on (d) species, (e) genera, and (f) functional compositions of sequential time bins: each point represents the dissimilarity between the time bin and the previous time bin. Insignificant p-values for the PERMANOVA t-statistic are indicated by dashed circles.
Figure 5
Figure 5
Composition of species from the dataset in each time interval based on their palaeolatitudinal range. Yellow dashed lines represent hyperthermal events discussed in the text, from left to right: late Maastrichtian, PETM, ETM-2, and the MECO. See Supplemental Material and Fig. S5 for the definition of each palaeolatitudinal group. See Fig. 1 for timescale abbreviations.

References

    1. Henson SA, Beaulieu C, Lampitt R. Observing climate change trends in ocean biogeochemistry: when and where. Glob. Change Biol. 2016;22:1561–1571. doi: 10.1111/gcb.13152. - DOI - PMC - PubMed
    1. Hönisch B, et al. The geological record of ocean acidification. Sci. 2012;335:1058–1063. doi: 10.1126/science.1208277. - DOI - PubMed
    1. Littler K, Röhl U, Westerhold T, Zachos JC. A high-resolution benthic stable-isotope record for the South Atlantic: Implications for orbital-scale changes in Late Paleocene–Early Eocene climate and carbon cycling. Earth Planet. Sci. Lett. 2014;401:18–30. doi: 10.1016/j.epsl.2014.05.054. - DOI
    1. Burke KD, et al. Pliocene and Eocene provide best analogs for nearfuture climates. P.N.A.S. 2018;115:13288–13293. doi: 10.1073/pnas.1809600115. - DOI - PMC - PubMed
    1. Edgar KM, et al. Symbiont ‘bleaching’ in planktic foraminifera during the Middle Eocene Climatic Optimum. Geol. 2013;41:15–18. doi: 10.1130/G33388.1. - DOI

Publication types