. 2020 Feb 7;10(1):2084.
doi: 10.1038/s41598-020-59180-3.

Arbuscular mycorrhizal fungi (AMF) enhanced the growth, yield, fiber quality and phosphorus regulation in upland cotton (Gossypium hirsutum L.)

Affiliations

Arbuscular mycorrhizal fungi (AMF) enhanced the growth, yield, fiber quality and phosphorus regulation in upland cotton (Gossypium hirsutum L.)

Xinpeng Gao et al. Sci Rep. .

Abstract

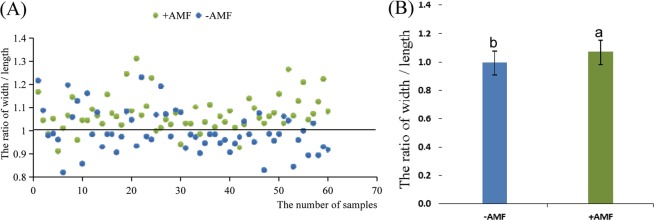
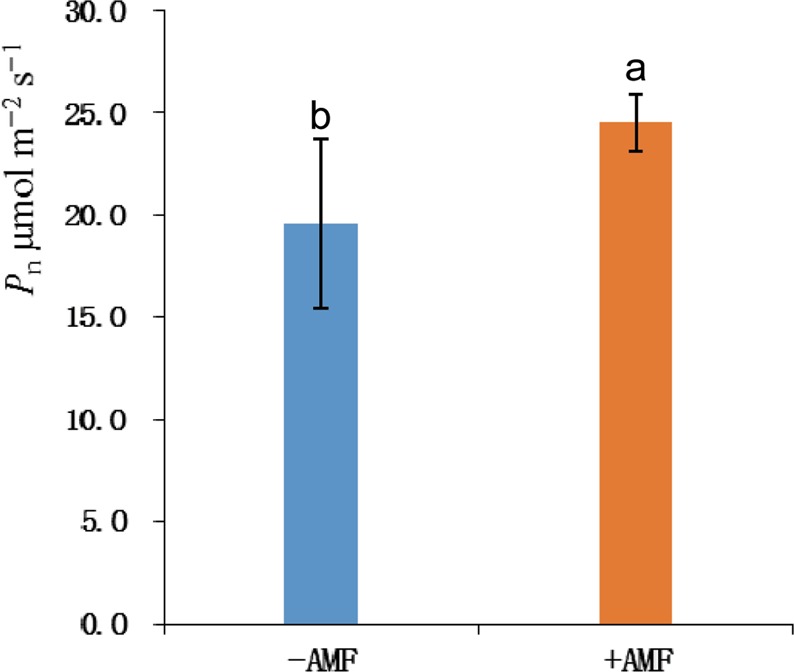
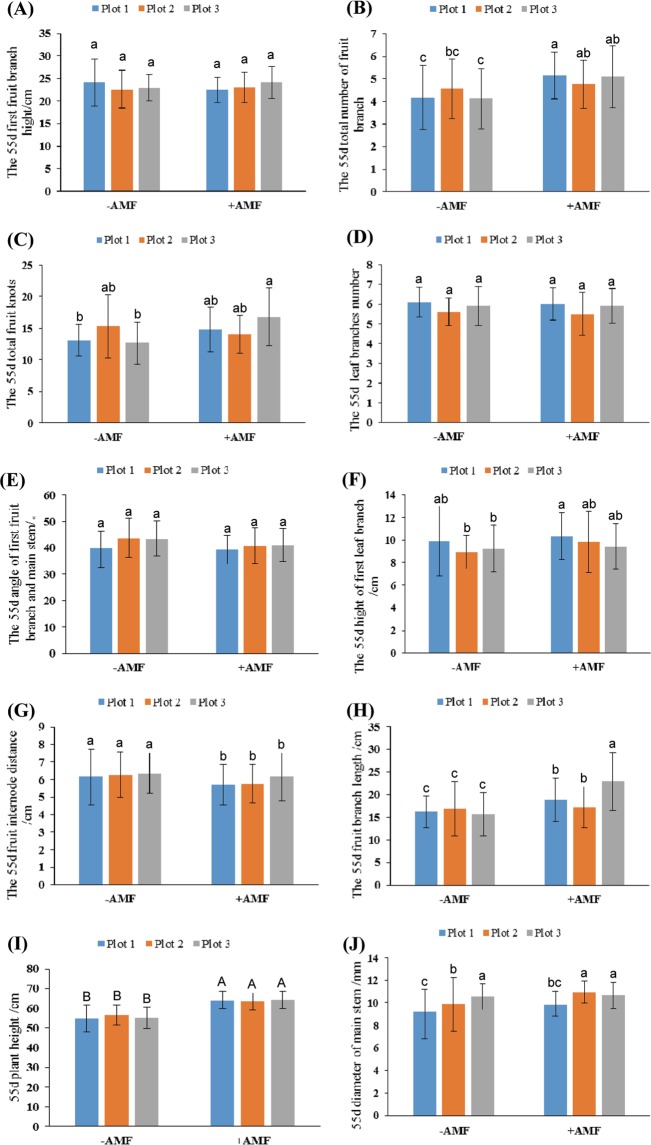
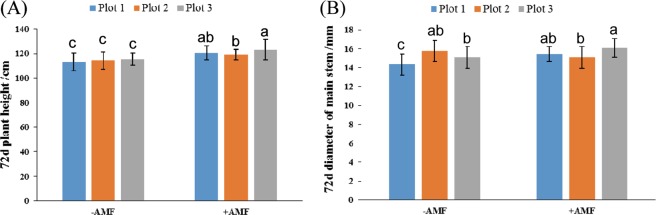
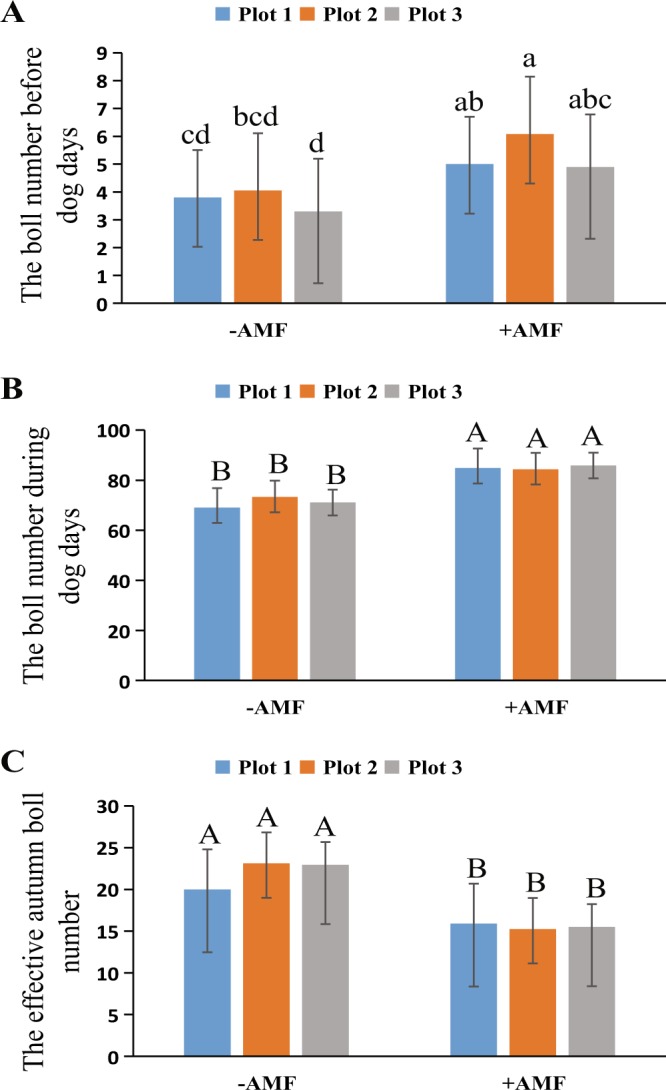
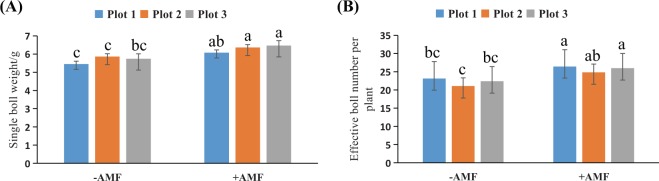
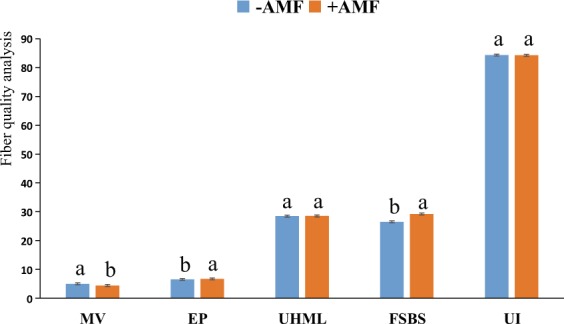
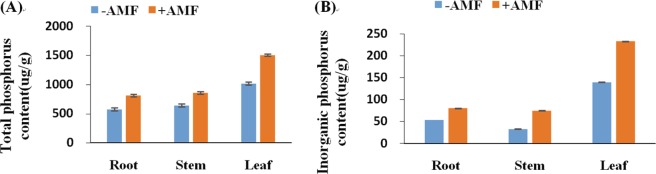
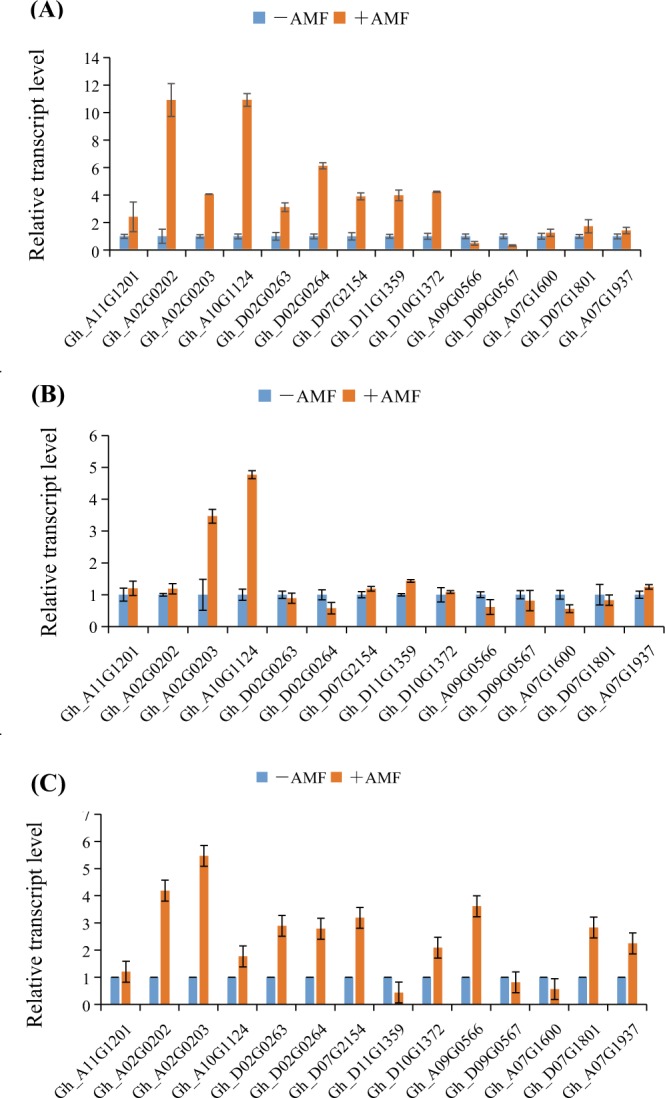
We previously reported on the strong symbiosis of AMF species (Rhizophagus irregularis CD1) with the cotton (Gossypium hirsutum L.) which is grown worldwide. In current study, it was thus investigated in farmland to determine the biological control effect of AMF on phosphorus acquisition and related gene expression regulation, plant growth and development, and a series of agronomic traits associated with yield and fiber quality in cotton. When AMF and cotton were symbiotic, the expression of the specific phosphate transporter family genes and P concentration in the cotton biomass were significantly enhanced. The photosynthesis, growth, boll number per plant and the maturity of the fiber were increased through the symbiosis between cotton and AMF. Statistical analysis showed a highly significant increase in yield for inoculated plots compared with that from the non inoculated controls, with an increase percentage of 28.54%. These findings clearly demonstrate here the benefits of AMF-based inoculation on phosphorus acquisition, growth, seed cotton yield and fiber quality in cotton. Further improvement of these beneficial inoculants on crops will help increase farmers' income all over the world both now and in the future.


Conflict of interest statement

The authors declare no competing interests.

Figures

Figure 1
Figure 1
The width/length ratio of the functional leaf. (A) Scatter plot of the distribution of strong and weak functional leaves; (B) Statistical analysis of the difference between strong and weak functional leaves. If the value of width/length >1, the cotton seedlings will grow rapidly. If the value of width/length <1, the cotton seedlings will grow slowly. The proportion of strong seedings with (+AMF) and without (−AMF) AMF are 90% and 35% respectively. The means ± standard error values are shown in the figure. Bars labeled with a different letter at the top of each parameter show a significant difference at P < 0.05 by one-way ANOVA.
Figure 2
Figure 2
Net photosynthetic rate (Pn) of upland cotton (Lumian No. 1) seedlings. The means ± standard error values are shown in the figure. Bars labeled with a different letter at the top of each parameter show a significant difference at P < 0.05 by statistical analysis of a single-factor experiment. The values were measured by CIRAS-II,UK portable photosynthesis measurement system. The unit of Net photosynthetic rate is μmol m−2 s−1.
Figure 3
Figure 3
Plant growth traits at 55-days after sowing. (A) 55-day first fruit branch; (B) 55-day total number of fruit branches; (C) 55-day total boll nodes; (D) 55-day number of leaf branches; (E) 55-day angle of the first fruit branch and the main stem; (F) 55-day height of the first leaf branch; (G) 55-day fruit internode distance; (H) 55-day fruit branch length; (I) 55-day plant height; (J) 55-day diameter of the main stem. The means ± standard error values are shown in the figure. Bars labeled with a different letter at the top of each parameter show a significant difference at P < 0.05 by statistical analysis of a single-factor experiment. Bars labeled with a different capital letter at the top of each parameter show a significant difference at P < 0.01 by statistical analysis of single-factor experiment.
Figure 4
Figure 4
Plant growth traits at 72 days after sowing. (A) The plant height at 72 days after sowing; (B) the diameter of the main stem at 72 days after sowing. The means ± standard error values are shown in the figure. Bars labeled with a different letter at the top of each parameter show a significant difference at P < 0.05 by one-way factorial ANOVA.
Figure 5
Figure 5
The boll number before late summer and during late summer and the effective autumn boll number. (A) The boll number before late summer; (B) the boll number during late summer; (C) the effective autumn boll number. The means ± standard error values are shown in the figure. Bars labeled with a different letter at the top of each parameter show a significant difference at P < 0.05 by statistical analysis of a single-factor experiment. Bars labeled with a different capital letter at the top of each parameter show a significant difference at P < 0.01 by statistical analysis of a single-factor experiment.
Figure 6
Figure 6
The boll traits in the harvest period. (A) The single-boll weight; (B) The effective boll number per plant. The means ± standard error values are shown in the figure. Bars labeled with a different letter at the top of each parameter show a significant difference at P < 0.05 by statistical analysis of a single-factor experiment.
Figure 7
Figure 7
Fiber quality analysis. MV, micronaire value; EP, elongation percentage; AL, average length; FSBS, fiber specific breaking strength; UI, uniformity index; UHML, upper-half mean length. The means ± standard error values are shown in the figure. Bars labeled with a different letter at the top of each parameter show a significant difference at P < 0.05 by statistical analysis of a single-factor experiment. Each parameter was analyzed independently.
Figure 8
Figure 8
Phosphorus concentrations of plants in −AMF and +AMF plots. (A) The total phosphorus concentrations in −AMF and +AMF plots; (B) the inorganic phosphorus concentrations in −AMF and +AMF plots. The means ± standard error values are shown in the figure. Bars labeled with a different letter at the top of each parameter show a significant difference at P < 0.05 by statistical analysis of a single-factor experiment. Each parameter was analyzed independently.
Figure 9
Figure 9
Expression patterns of phosphate transporters in leaves, stems and roots. (A) RT-qPCR analysis of phosphate transporter genes in leaves. (B) RT-qPCR analysis of phosphate transporter genes in stems. (C) RT-qPCR analysis of phosphate transporter genes in roots.

References

    1. Schüßler A, Krüger C, Urgiles N. Phylogenetically diverse AM fungi from Ecuador strongly improve seedling growth of native potential crop trees. Mycorrhiza. 2016;26:199–207. doi: 10.1007/s00572-015-0659-y. - DOI - PubMed
    1. Majewska ML, Rola K, Zubek S. The growth and phosphorus acquisition of invasive plants Rudbeckia laciniata and Solidago gigantea are enhanced by arbuscular mycorrhizal fungi. Mycorrhiza. 2016;27:83–94. doi: 10.1007/s00572-016-0729-9. - DOI - PMC - PubMed
    1. Delavaux CS, et al. Nutrient enrichment effects on mycorrhizal fungi in an Andean tropical montane Forest. Mycorrhiza. 2017;27:311–319. doi: 10.1007/s00572-016-0749-5. - DOI - PubMed
    1. Bona E, et al. Arbuscular mycorrhizal fungi and plant growth-promoting pseudomonads improve yield, quality and nutritional value of tomato: a field study. Mycorrhiza. 2017;27:1–11. doi: 10.1007/s00572-016-0727-y. - DOI - PubMed
    1. Rahimzadeh S, Pirzad A. Arbuscular mycorrhizal fungi and Pseudomonas in reduce drought stress damage in flax (Linum usitatissimum L.)-a field study. Mycorrhiza. 2017;27:537–552. doi: 10.1007/s00572-017-0775-y. - DOI - PubMed

Publication types