. 2020 Feb;145(2):550-562.
doi: 10.1016/j.jaci.2019.10.031.

An endothelial microRNA-1-regulated network controls eosinophil trafficking in asthma and chronic rhinosinusitis

Affiliations

An endothelial microRNA-1-regulated network controls eosinophil trafficking in asthma and chronic rhinosinusitis

Asawari Korde et al. J Allergy Clin Immunol. 2020 Feb.

Abstract

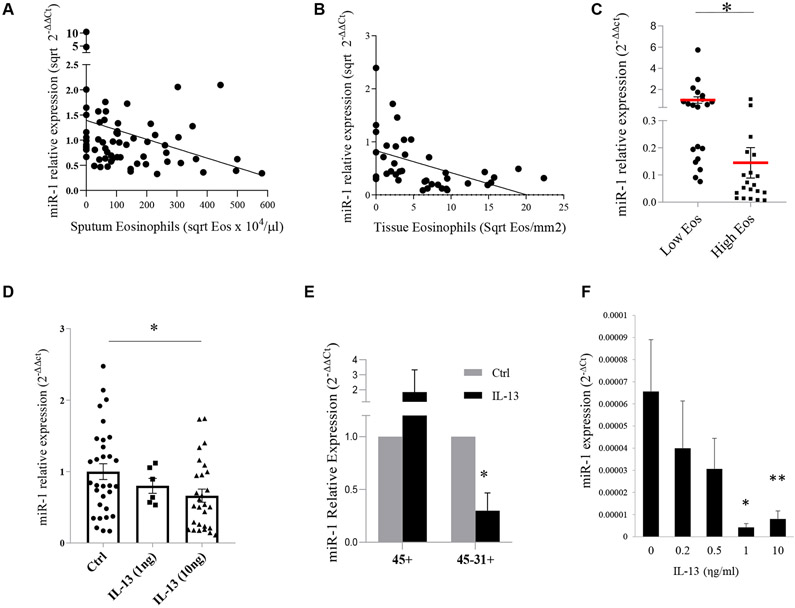
Background: Airway eosinophilia is a prominent feature of asthma and chronic rhinosinusitis (CRS), and the endothelium plays a key role in eosinophil trafficking. To date, microRNA-1 (miR-1) is the only microRNA known to be regulated in the lung endothelium in asthma models.

Objective: We sought to determine the role of endothelial miR-1 in allergic airway inflammation.

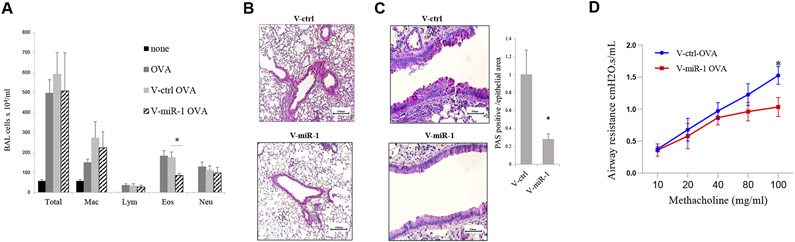
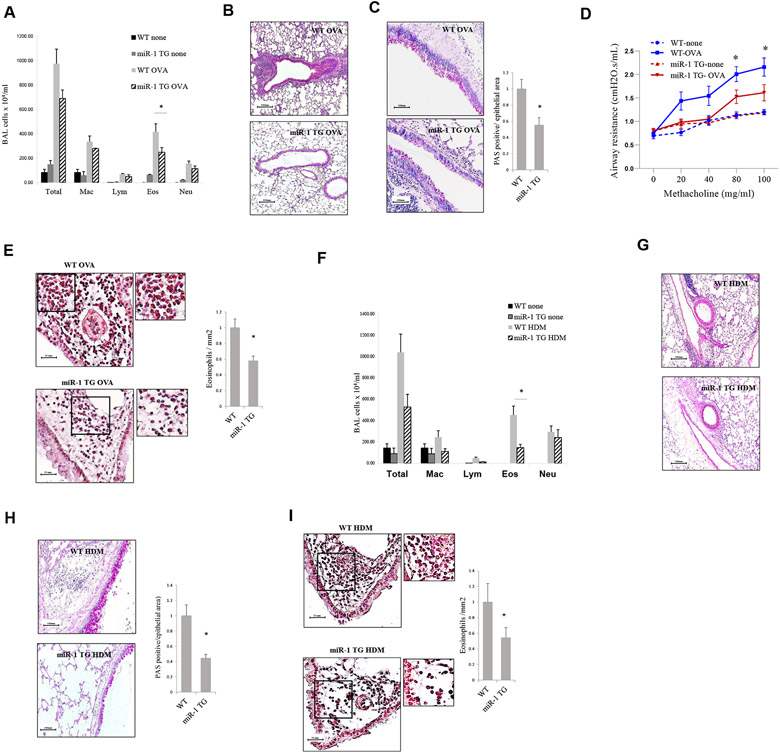
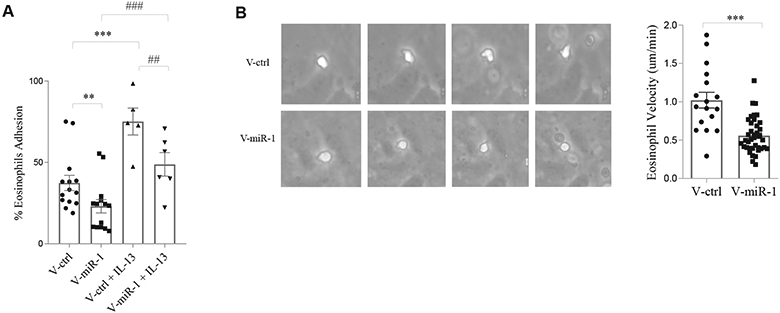
Methods: We measured microRNA and mRNA expression using quantitative RT-PCR. We used ovalbumin and house dust mite models of asthma. Endothelium-specific overexpression of miR-1 was achieved through lentiviral vector delivery or induction of a transgene. Tissue eosinophilia was quantified by using Congo red and anti-eosinophil peroxidase staining. We measured eosinophil binding with a Sykes-Moore adhesion chamber. Target recruitment to RNA-induced silencing complex was assessed by using anti-Argonaute2 RNA immunoprecipitation. Surface P-selectin levels were measured by using flow cytometry.

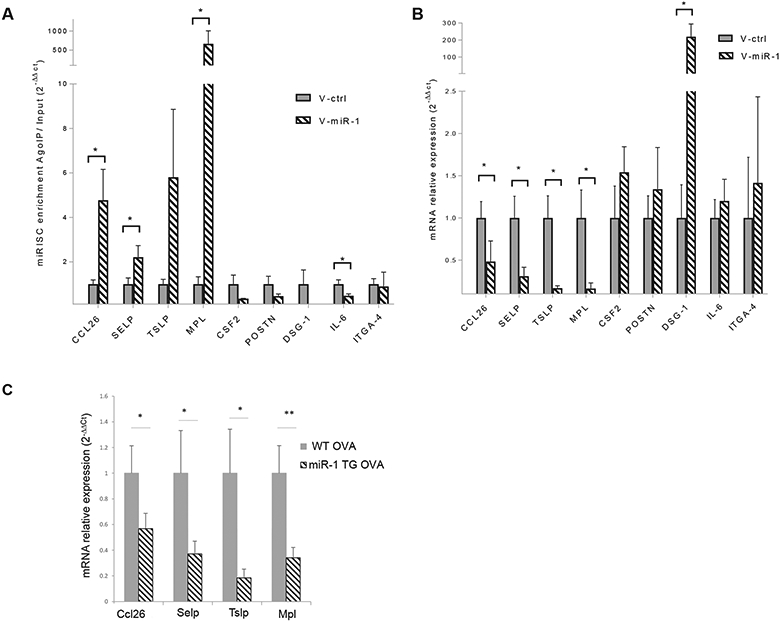
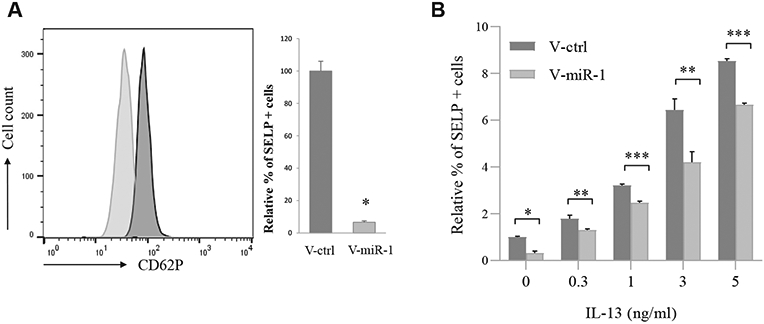
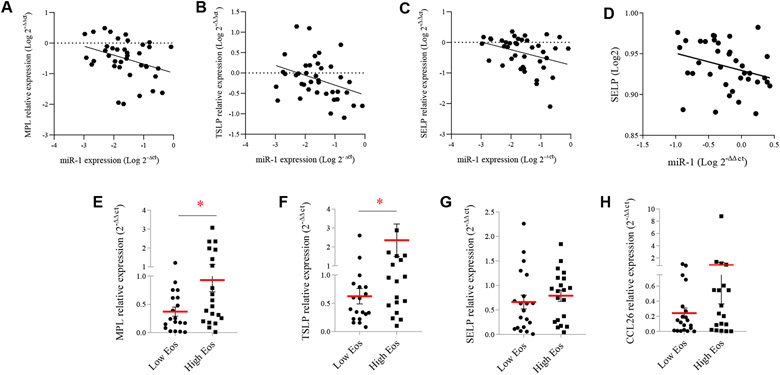
Results: Serum miR-1 levels had inverse correlations with sputum eosinophilia, airway obstruction, and number of hospitalizations in asthmatic patients and sinonasal tissue eosinophilia in patients with CRS. IL-13 stimulation decreased miR-1 levels in human lung endothelium. Endothelium-specific overexpression of miR-1 reduced airway eosinophilia and asthma phenotypes in murine models and inhibited IL-13-induced eosinophil binding to endothelial cells. miR-1 recruited P-selectin, thymic stromal lymphopoietin, eotaxin-3, and thrombopoietin receptor to the RNA-induced silencing complex; downregulated these genes in the lung endothelium; and reduced surface P-selectin levels in IL-13-stimulated endothelial cells. In our asthma and CRS cohorts, miR-1 levels correlated inversely with its target genes.

Conclusion: Endothelial miR-1 regulates eosinophil trafficking in the setting of allergic airway inflammation. miR-1 has therapeutic potential in asthmatic patients and patients with CRS.

Keywords: Eosinophil trafficking; P-selectin; asthma; chronic rhinosinusitis; microRNA; vascular endothelium.


Conflict of interest statement

Disclosure of potential conflict of interest: G. Chupp has been a speakers’ bureau member, consultant, and clinical trial principal investigator for Genentech, GlaxoSmithKline, AstraZeneca, and BSCI; has been a speakers’ bureau member and clinical trial principal investigator for Genzyme; on serves on the advisory board of TEVA unrelated to this work. The rest of the authors declare that they have no relevant conflicts of interest.

Figures

FIG 1.
FIG 1.
The effect of T2 inflammation on miR-1 levels in human subjects. A, Association between serum miR-1 levels (normalized to the mean of the control group) and sputum eosinophilia in asthma patients and healthy control subjects (n = 66, R = −0.3037, P = .013). B, Association between miR-1 levels and eosinophil counts (counted after anti-eosinophil peroxidase [EPX] staining) in sinonasal tissue samples from patients with CRS (n = 40, r = −5784, P < .00001). C, Comparison of miR-1 levels in sinonasal tissue samples from patients with CRS divided into high-eosinophil-count (>15 cells/high-power field [hpf]) and low-eosinophil-count (≤15 cells/hpf) groups (n = 40). *P < .0001. Eos, Eosinophils. D, miR-1 levels in cultured human lung tissue samples after stimulation with recombinant IL-13 and normalized to the mean of the control group (ctrl, PBS; control group: n = 8 subjects with 3 or more replicates; 1 ng/mL group, n = 3 subjects with 2 replicates; 10 ng/mL group, n = 7 subjects with 3 or more replicates). *P = .0106. E, miR-1 levels in immune (CD45+) and endothelial (CD31+CD45) cells isolated from cultured human lungs after treatment with recombinant IL-13 or PBS controls (n = 3 subjects). *P = .026. F, miR-1 levels in HUVECs stimulated with recombinant IL-13 (n = 6 or more in each group from 4 experiments). *P < .01 and **P < .05, Student unpaired t test. R, Spearman correlation coefficient for Fig 1, A and B. Error bars represent SEMs.
FIG 2.
FIG 2.
Effect of vascular-specific lentiviral miR-1 vector on T2 inflammation. Wild-type C57BL/6 mice were sensitized with OVA and received intranasal V-miR-1 or V-ctrl vector 2 weeks before OVA aerosol challenge. A, BAL cytology from PBS-challenged (none), OVA-challenged, OVA-challenged with V-ctrl treatment, and OVA-challenged with V-miR-1 treatment groups (n = 7 and 11 for the none and OVA groups and n = 15 per group for the V-ctrl-OVA and V-miR-1-OVA groups from 3 experiments). *P = .00049. Eos, Eosinophils; Lym, lymphocytes; Mac, macrophages; Neu, neutrophils. B and C, Lung sections from these mice were stained with hematoxylin and eosin for airway inflammation (Fig 2, B) and periodic acid–Schiff (PAS) stain for mucus metaplasia (Fig 2, C). PAS-positive/total airway epithelial areas were counted and presented as a graph in the left panel (n ≥ 6 from 2 experiments). *P = .01909. D, Airway responses were measured by using the forced oscillation technique. Mean airway resistance (in cm H20.s/mL) was measured after exposing mice to increasing concentrations of methacholine (in milligrams per milliliter, n = 8 from 2 experiments). *P = .02. Error bars represent SEMs. Data were assessed by using the Student unpaired t test.
FIG 3.
FIG 3.
Effect of the inducible miR-1 transgene in asthma models. A-E, miR-1 transgenic mice (miR-1 TG) and their wild-type (WT) littermates in an OVA model. Fig 3, A, BAL fluid cytology (n = 4 for the “none” group and n = 12 for the OVA groups from 2 experiments). *P = .00048. Fig 3, B and C, Representative lung sections from these mice stained with hematoxylin and eosin for inflammation (Fig 3, B) and periodic acid-Schiff (PAS) for mucus metaplasia (Fig 3, C). Right panel shows PAS-positive areas measured and presented as in Fig 2, C (n = 4-7 per group). *P = .0018. Fig 3, D, Airway responses to methacholine challenge were measured and presented, as described in Fig 2, D (n = 4-7 per group from 2 experiments). *P < .03 for the OVA group. Fig 3, E, Congo red staining for tissue eosinophilia. Left panel shows representative images. Insets show 2 × magnification of the corresponding area. Right panel shows quantification results (n = 3-5 per group from 1 experiment). *P = .0017. F-I, miR-1 TG mice and their WT litters in an HDM model. Fig 3, F, BAL fluid cytology (n = 4 for the “none” group and n = 8 or 19 for the HDM groups from 2 experiments). *P = .00524. Fig 3, G-I, Lung sections were stained with H&E (Fig 3, G), PAS (n = 3-6 per group from 1 experiment, *P = .0165; Fig 3, H), and Congo red (n = 13 from 2 experiments, *P = .000603; Fig 3, I). Error bars represent SEMs. Data were assessed by using the Student unpaired t test. Eos, Eosinophils; Lym, lymphocytes; Mac, macrophages; Neu, neutrophils.
FIG 4.
FIG 4.
Effect of miR-1 on eosinophil-endothelium interaction. HUVECs were transduced with V-miR-1 or V-ctrl, stimulated with recombinant IL-13 (1 ng/mL) for 24 hours, and then exposed to eosinophils freshly isolated from healthy human subjects. Eosinophils were isolated by using a rapid method with chemotactic peptide. A, Eosinophil adhesion assay in a Sykes-Moore adhesion chamber. Percentages of eosinophils bound to the HUVEC surface were plotted for each group (n = 14 for the v-miR-1 and v-ctrl groups and n = 5 for the IL-13 groups, data from 4 experiments). **P = .0014, ***P = .0006, ##P = .0303, and ###P = .0041, Mann-Whitney test). B, Velocities of eosinophil movement on the surfaces of transduced HUVECs (in micrometers per minute) after binding were recorded by using video microscopy. Left panel shows representative images depicting sequential images from the movement of a human eosinophil (white cell) on the surfaces of transduced HUVECs. Right panel shows the quantification plot (n = 17 for the V-ctrl and n = 39 for the V-miR-1 group, 2 experiments). ***P < .0001, Mann-Whitney test. Error bars represent SEMs.
FIG 5.
FIG 5.
miR-1 targets controlling eosinophil trafficking. A, HUVECs were transduced with V-miR-1 or V-ctrl vectors. Cell lysates were immunoprecipitated with anti–Argonaute2 (Ago2) antibody, and levels of mRNAs bound to Ago2 were measured by using quantitative RT-PCR in the whole lysate (input) and Ago2 immuno-precipitates (AgoIP). RISC recruitment was calculated as mRNA levels in AgoIP/input (2−ΔΔCt, n = 4 per group). *P < .05. B, Expression levels of the target gene mRNAs in V-miR-1– and V-ctrl-transduced HUVECs were normalized to their means in the control (V-ctrl) group and presented as 2−ΔΔCt (n = 4). *P < .05. C, Endothelial cells were isolated from OVA-challenged mice by using magnetic immune sorting, as described in Fig 1, E, and mRNA expression levels were measured, normalized, and presented as described in Fig 5, B (CCL26, SELP, and TSLP: n = 7WT and 8 miR-1 TG; MPL: n = 10 per group; from 2 experiments). *P < .05 and **P = .005331. CSF2, Colony-stimulating factor 2; DSG1, desmoglein 1; ITGA4, integrin subunit α4; POSTN, periostin. Error bars represent SEMs. Data were assessed by using the Student unpaired t test.
FIG 6.
FIG 6.
Effect of the miR-1 axis on SELP expression on the endothelial surface. HUVECs were transduced with V-miR-1 (or V-ctrl), and SELP expression on the cell surface was measured by using flow cytometry. A, Left panel shows a typical histogram plot. Right panel shows cumulative data from 2 experiments with percentage SELP expression normalized to the V-ctrl group (n = 9 from 2 experiments). Light gray, V-miR-1; dark gray, V-ctrl. *P = 2.1 × 10⁻⁷. B, Transduced HUVECs were treated with increasing concentrations of human recombinant IL-13. SELP expression levels in each group were measured and normalized to V-ctrl in PBS (n = 6 or more from 2 experiments). *P < .000001, **P < .01, and ***P < .05.
FIG 7.
FIG 7.
Associations between miR-1, its target genes, and eosinophilia in clinical samples. A-C, Correlation between miR-1 and its target genes in the CRS cohort described in Fig 1, A (n = 40, except for MPL [n = 39]). Fig 7, A, MPL: R = −0.3356, P = .0367. Fig 7, B, TSLP: R = −0.3461, P = .0309. Fig 7, C, SELP: R = −0.3361, P = .034. D, Correlation between miR-1 and SELP expression in serum samples from the asthma cohort described in Fig 1 (n = 37, R = −0.3589, P = .0291. E-H, mRNA expression levels in the high- and low-eosinophil-count groups described in Fig 1, A. Fig 7, E, MPL: *P = .0468. Fig 7, F, TSLP. *P = .0262. Fig 7, G, SELP: P = .2534. Fig 7, H, CCL26: P = .2829. In each graph means and SEMs are represented as red lines and error bars, respectively. R, Spearman correlation coefficient.

References

    1. McGrath KW, Icitovic N, Boushey HA, Lazarus SC, Sutherland ER, Chinchilli VM, et al.A large subgroup of mild-to-moderate asthma is persistently noneosinophilic. Am J Respir Crit Care Med 2012;185:612–9. - PMC - PubMed
    1. Steinke JW, Borish L. Chronic rhinosinusitis phenotypes. Ann Allergy Asthma Immunol 2016;117:234–40. - PMC - PubMed
    1. Holgate ST. Pathogenesis of asthma. Clin Exp Allergy 2008;38:872–97. - PubMed
    1. Pelaia G, Vatrella A, Maselli R. The potential of biologics for the treatment of asthma. Nat Rev Drug Discov 2012;11:958. - PubMed
    1. Shah SA, Ishinaga H, Takeuchi K. Pathogenesis of eosinophilic chronic rhinosinusitis. J Inflamm (Lond) 2016;13:11. - PMC - PubMed

Publication types

MeSH terms