. 2020 Mar 27;432(7):1978-1995.
doi: 10.1016/j.jmb.2020.01.029. Epub 2020 Feb 6.

Structural Basis for Lipid Binding and Function by an Evolutionarily Conserved Protein, Serum Amyloid A

Affiliations

Structural Basis for Lipid Binding and Function by an Evolutionarily Conserved Protein, Serum Amyloid A

Nicholas M Frame et al. J Mol Biol. .

Abstract

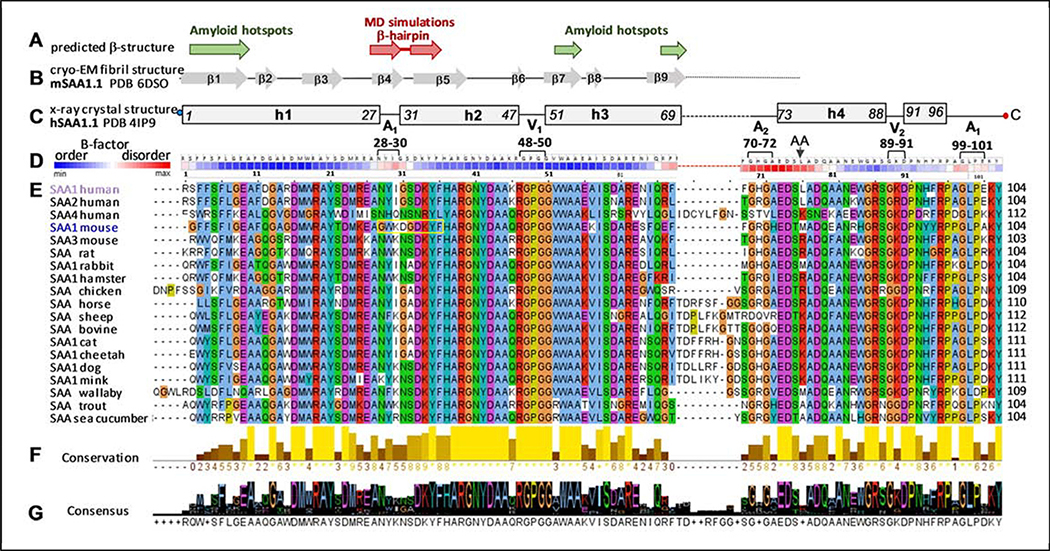
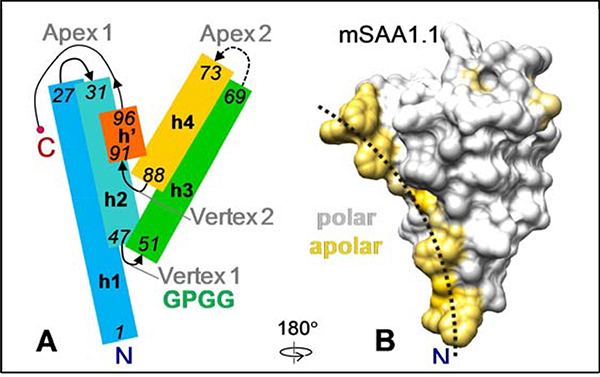
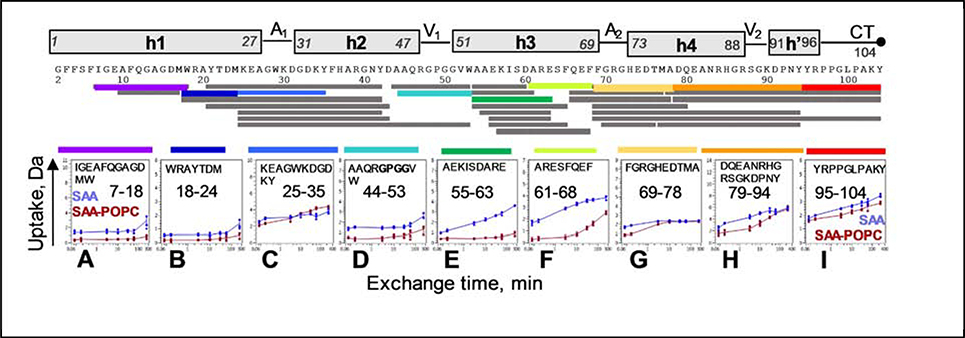
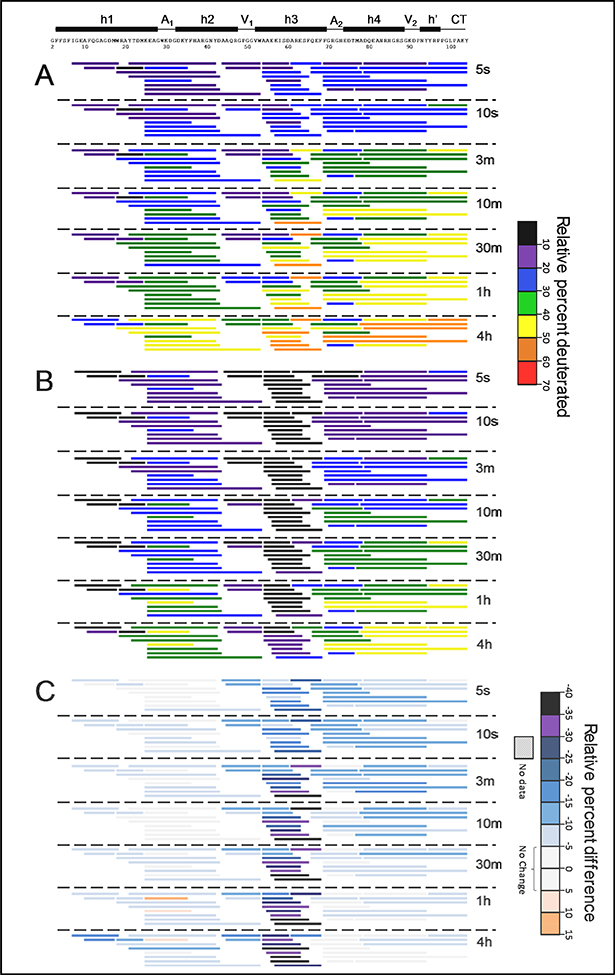
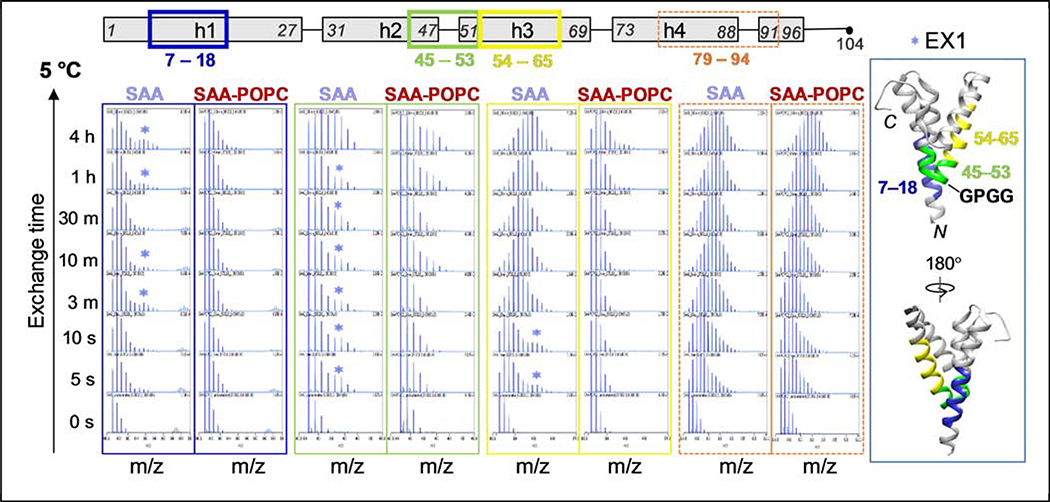
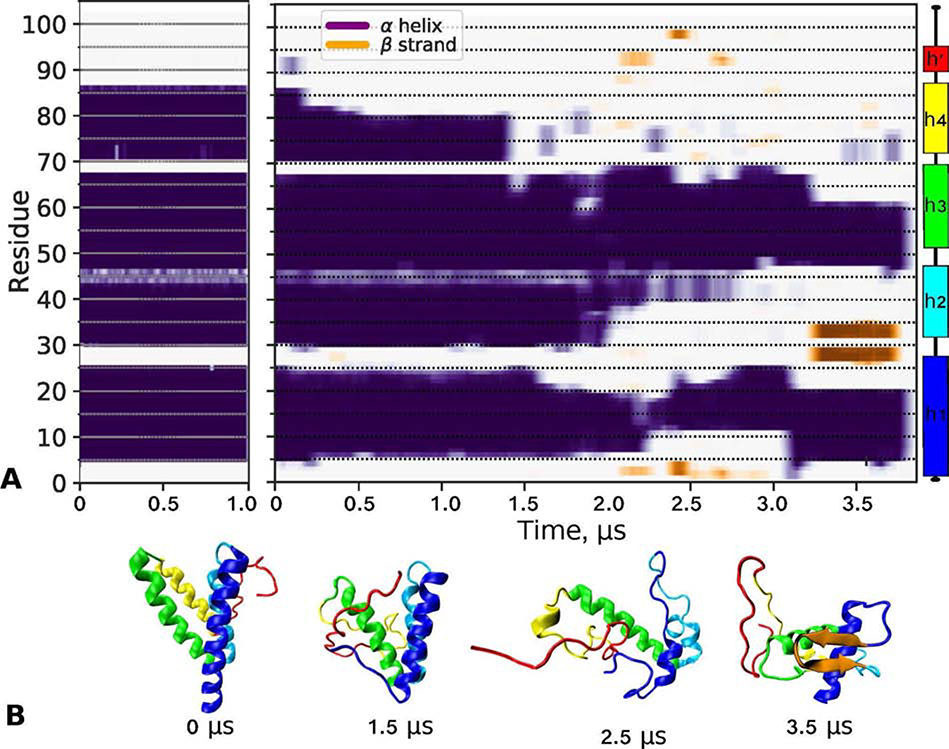
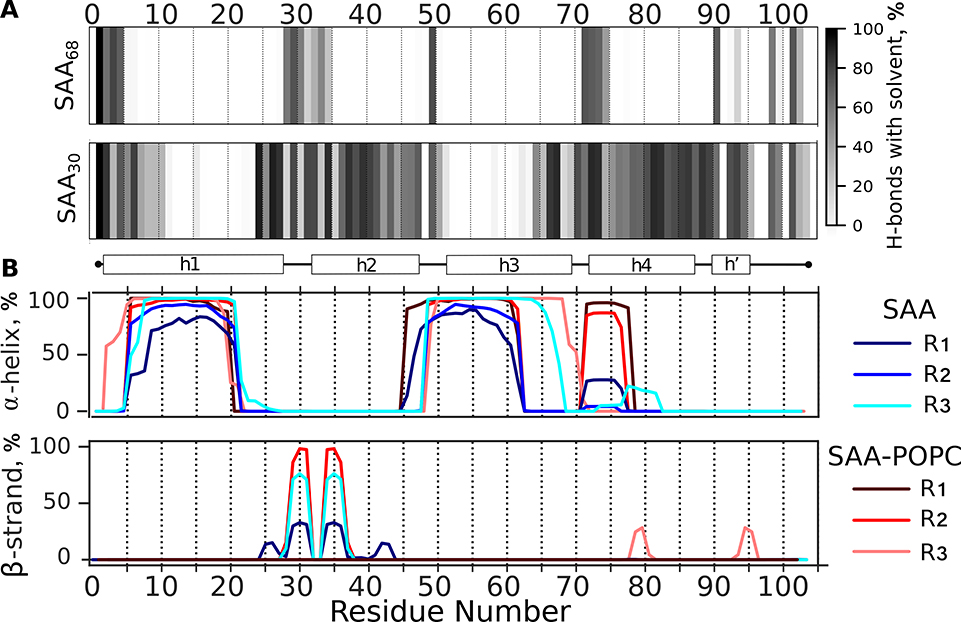
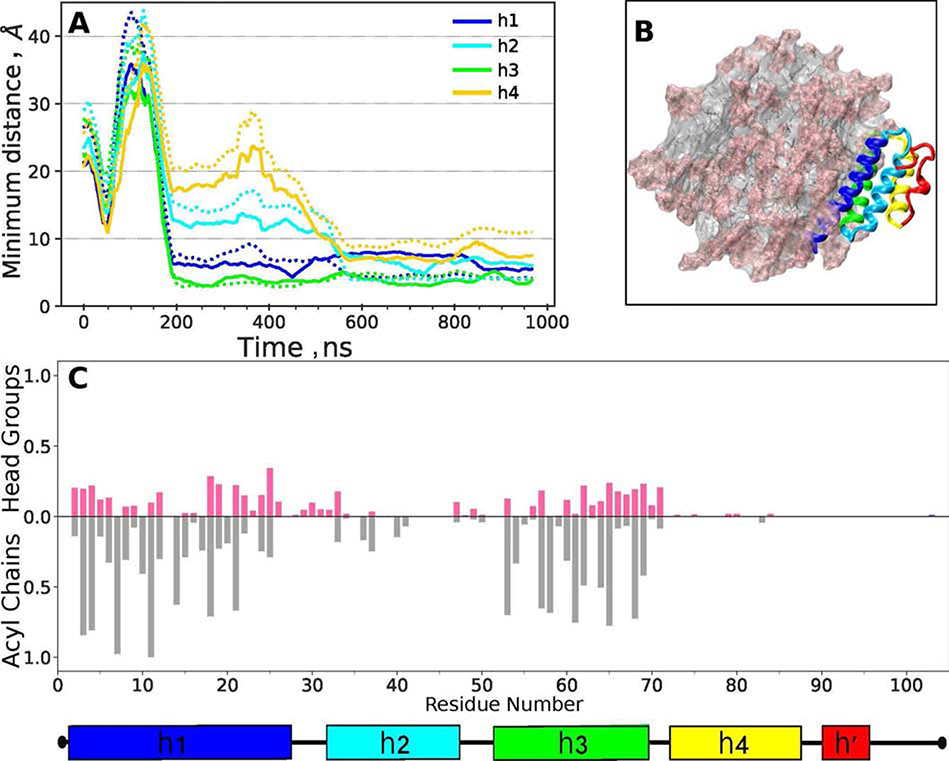
Serum amyloid A (SAA) is a plasma protein that transports lipids during inflammation. To explore SAA solution conformations and lipid-binding mechanism, we used hydrogen-deuterium exchange mass spectrometry, lipoprotein reconstitution, amino acid sequence analysis, and molecular dynamics simulations. Solution conformations of lipid-bound and lipid-free mSAA1 at pH~7.4 agreed in details with the crystal structures but also showed important differences. The results revealed that amphipathic α-helices h1 and h3 comprise a lipid-binding site that is partially pre-formed in solution, is stabilized upon binding lipids, and shows lipid-induced folding of h3. This site sequesters apolar ligands via a concave hydrophobic surface in SAA oligomers. The largely disordered/dynamic C-terminal region is conjectured to mediate the promiscuous binding of other ligands. The h1-h2 linker region is predicted to form an unexpected β-hairpin that may represent an early amyloidogenic intermediate. The results help establish structural underpinnings for understanding SAA interactions with its key functional ligands, its evolutional conservation, and its transition to amyloid.

Keywords: hydrogen-deuterium exchange mass spectrometry; inflammation and immunity; lipoprotein nanoparticle; molecular dynamics simulations; β-hairpin misfolding intermediate.


Figures

Figure 1.
Figure 1.
Predicted and observed secondary structure and amino acid sequence conservation in the SAA protein family. The residue numbers correspond to human SAA1. (A) Predicted β-sheet structure. Green arrows show residue segments predicted to initiate β-aggregation in SAA, or “amyloid hotspots” [15]; brown arrows show the β-hairpin predicted by MD simulations of the current study. (B) Linear diagram shows β-sheets observed in the AA amyloid structure, derived from mSAA1.1 (PDB: 6DSO); arrows represent β-strands and lines are turns/loops [34]. (C) Linear diagram depicts secondary structure observed by x-ray crystallography (PDB 4IP9) in lipid-free hSAA1.1 [31]. Rectangles show α-helices h1-h4 and a 3/10 helix h’; first and last residue numbers in each helix are indicated. Lines show turn/coil regions; dashed line indicates the variable h3-h4 linker. Apices 1 and 2 (A1, A2) and vertices 1 and 2 (V1, V2) are indicated, along with their residue numbers (see Figure 2 for detail). Residues numbering is according to human SAA1 that has an additional N-terminal Gly compared to murine SAA1. (D) Temperature factors of the Cα atoms from the crystal structure of hSAA1.1 (PDB: 4IP9); the B-factors are color-coding as shown, from low to high (blue to red). Similar B-factor distribution was observed in all nine symmetry-unrelated SAA molecules from the four available crystal structures of hSAA1 and mSAA3 (PDB: 4IP8, 4IP9, 4Q5G, 6PY0) in four different space groups; therefore, this B-factor distribution was determined by factors other than lattice contacts. Amino acids are shown for hSAA1. Black arrow shows the major cleavage site that generates AA fragment found in the in vivo deposits. (E) The conservation table lists amino acid sequences of 19 SAA proteins. The sequence alignment was performed using Clustal Omega server [64] and the results were displayed using Jalview, http://www.jalview.org/ [65]. Conserved residues are color-coded: apolar (blue), polar (green), acidic (purple), basic (red), Pro (yellow), Gly (orange). Yellow box highlights the β-hairpin observed in our MD simulations of mSAA1. (F) Conservation plot shows more conserved residues in lighter colors; the bar height represents the number of tabulated SAA sequences wherein each residue is conserved. (G) Consensus plot shows the predominant residues in each position.
Figure 2.
Figure 2.
SAA monomer x-ray crystal structure and model. (A) Cartoon representation of the SAA monomer based on the ~2.2 Å resolution x-ray crystal structures of hSAA1 and mSAA3 [25, 26, 31]. Rectangles show α-helices (h1, h2, h3, h4) and a 3/10 helix (h’), rainbow-colored from the N- to the C-terminus (blue to red). First and last residue numbers in each helix are in italics. Residue numbering is according to hSAA1. Two apices and two vertices are indicated. Dashed line shows variable h3-h4 linker at apex 2. (B) Space-filling model illustrating surface hydrophobicity of mSAA1 monomer. A homology model of mSAA1 was obtained using the crystal structure of hSAA1 (PDB ID 4IP9) and Swiss model software [66]. Hydrophobic residues are colored yellow. Dotted arc indicates a concave hydrophobic surface whose radius of curvature, r~4.5 nm, ideally fits the HDL surface curvature. Crystal structures of hSAA1 and mSAA3A show a similar hydrophobic surface [21].
Figure 3.
Figure 3.
Deuterium uptake plots for selected regions of lipid-free SAA (blue) and SAA-POPC (red). Error bars for individual time points represent the range for multiple charge states (varies per peptide) from the combined results of multiple replicates (described in Table S1 and in Methods). Residue numbers for representative peptides are indicated. Linear representation of the SAA secondary structure observed by crystallography is shown at the top. Apices 1 and 2 (A1, A2), vertices 1 and 2 1 (V1, V2), and the C-terminal tail (CT) are indicated; Figure 2A shows their locations in the crystal structure. Peptide coverage map for lipid-free SAA and SAA-POPC at 5 °C is shown above the uptake plots. Each bar r epresents a peptic peptide fragment of SAA detected by MS. Selected fragments whose uptake plots are displayed are color-coded.
Figure 4.
Figure 4.
Relative deuterium incorporation at 5 °C of all pep tides in lipid-free SAA (A), in SAA-POPC (B), and their difference (C) where subtraction was performed as DSAA-POPC – DSAA. The relative percent deuteration scale for panels A and B is used to color each peptide from black/violet (low uptake, high structural protection) to red (high uptake, low structural protection). The deuteration difference scale for panel C indicates less deuteration (negative numbers and colors) in SAA-POPC. Similar data at 15 °C and 25 ° C are shown in Figures S4, S5.
Figure 5.
Figure 5.
Mass spectra of selected peptides that display EX1 kinetics at 5 °C. Other peptides that overlap those shown here (see Figs 3 and 4) also displayed EX1 kinetics. Spectra are shown for free SAA (left of each pair) and for SAA-POPC (right of each pair) as a function of the exchange time for peptides 6–17 (blue boxes), 44–52 (green boxes), 53–64 (yellow boxes). The regions showing EX1 in free SAA, color-coded in blue (residues 6–17), green (44–52) and yellow (53–64). Each of these peptides is indicated in the linear protein model (top) and is mapped on the crystal structure (far right). Stars indicate spectra that clearly show two peaks characteristic of EX1 regime. Spectra for a representative peptide showing only EX2 (residues 79–94, orange boxes) are shown for comparison. Figure S7 shows similar data of selected peptides that display EX1 kinetics at 15 °C and at 25 °C.
Figure 6.
Figure 6.
Low- and high-temperature simulations of lipid free SAA monomer in solution. The starting model, denoted SAA68, was obtained from the x-ray crystal structure of hSAA1 (PDB ID: 4IP8) as shown in Figure S9. The structure was simulated at 310 K for 1 μs and at 370 K for 3.8 μs as described in Methods. (A) Time evolution of the secondary structure showing ⍺-helices (purple/blue) and β-sheets (orange) over the simulation trajectory at 310 K (left) and 370 K (right panel). The remaining structure (off-white) was turn/coil. Linear secondary structure model based on the hSAA1 crystal structure is color-coded. (B) Representative molecular structures at indicated simulation times from the 370 K trajectory, from 0 μs (SAA68) to 3.5 μs. The orientation of h1 is similar in all figures. Color-coding: h1 (blue), h2 (teal), h3 (green), residue segment 70–104 (red), and β-sheet (orange).
Figure 7.
Figure 7.
Main chain hydrogen bonding and secondary structure in SAA monomer in solution. Three representative structures collectively termed SAA30, which were extracted from the last 1 μs of the 370 K trajectory (shown in Figure 6A), were equilibrated at 310 K in the absence (SAA) or presence of a POPC micelle (SAA-POPC) for 5 or 10 μs, respectively. The resulting models, denoted R1-R3, are reported. (A) Hydrogen bonding of the protein main chain nitrogens to water molecules. Fraction of frames showing H-bonds with water is plotted versus residue number; darker colors indicate greater H-bonding probability. The plots represent an average of R1-R3 models; the results for individual models and their 3D structures are shown in Figure S11. Similar data for the starting model, SAA68, are shown for comparison (top panel). (B) Location of the α-helices and β-strands in the primary sequence of SAA and SAA-POPC is shown for R1-R3 models. Individual replicates are color-coded.
Figure 8.
Figure 8.
Protein-lipid contacts in SAA-POPC68 model. SAA68 was oriented randomly in respect to the POPC micelle containing 72 lipid molecules, the system was simulated at 310 K for 1 μs (for detail see flowchart in Figure S8), and the last 0.5 μs of the trajectory were used for analysis. (A) Average protein-lipid distances are plotted as a function of simulation time for individual SAA helices (color coded). Solid lines show distances involving phospholipid head groups, and dotted lines those involving acyl chains. (B) Final configuration of the SAA-POPC68 system. Protein ribbon diagram shows h1 (blue), h2 (teal), h3 (green), h4 (yellow) and residue segment 70–104 (red). POPC head groups are in pink and acyl chains in grey. (C) Fraction of frames showing SAA contacts with the POPC head groups (pink) and acyl chains (grey) per residue. A contact is defined as lipid atoms within 5 Å of protein atoms. Average results from R1-R3 simulations are shown.

References

    1. Urieli-Shoval S, Linke RP, Matzner Y, Expression and function of serum amyloid A, a major acute-phase protein, in normal and disease states, Curr. Opin. Hematol 7 (2000) 64–69. - PubMed
    1. Eklund KK, Niemi K, Kovanen PT, Immune functions of serum amyloid A, Crit. Rev. Immunol 32(4) (2012) 335–348. - PubMed
    1. Westermark GT, Fändrich M, Westermark P, AA amyloidosis: pathogenesis and targeted therapy, Annu. Rev. Pathol 10 (2015) 321–344. - PubMed
    1. Papa R, Lachmann HJ, Secondary AA, Amyloidosis, Rheum. Dis. Clin. North. Am 44(4) (2018) 585–603. - PubMed
    1. Shridas P, Tannock LR, Role of serum amyloid A in atherosclerosis, Curr. Opin. Lipidol 30(4) (2019) 320–325. - PMC - PubMed

Publication types