. 2020 Mar;47(1):20-33.
doi: 10.5653/cerm.2020.00388. Epub 2020 Feb 10.

Comparison of male reproductive parameters in mice with type 1 and type 2 diabetes

Affiliations

Comparison of male reproductive parameters in mice with type 1 and type 2 diabetes

Apichakan Sampannang et al. Clin Exp Reprod Med. 2020 Mar.

Abstract

Objective: The differences between type 1 and type 2 diabetes mellitus (T1DM and T2DM) in terms of their adverse effects on male reproductive parameters have never been elucidated. This study aimed to distinguish between the effects of the DM types in mice treated with multiple low doses of streptozotocin (STZ) to mimic human T1DM and coadministered a high-fat diet (HFD) to mimic human T2DM.

Methods: The T1DM mice were intraperitoneally injected with STZ (40 mg/kg body weight) for 5 days. The T2DM mice received an HFD for 14 days prior to STZ injection (85 mg/kg body weight), followed by continuous feeding of an HFD. Male reproductive parameters were evaluated.

Results: The reproductive organs of the DM mice weighed significantly less than those of controls, and the seminal vesicles plus prostates of the T1DM mice weighed less than those of the T2DM mice. Increased sperm abnormalities and incomplete DNA packaging were observed in the DM groups. Sperm concentration and the proportion of normal sperm were significantly lower in the T1DM group. The seminiferous histopathology of DM mice was classified into seven types. The penises of the DM mice were smaller than those of the controls; however, tunica albuginea thickness and the amount of penile collagen fibers were increased in these mice. Round germ cells were abundant in the epididymal lumens of the mice with DM.

Conclusion: T1DM adversely affected reproductive parameters to a greater extent than T2DM.

Keywords: Mice; Sperm; Streptozotocin; Type 1 diabetes mellitus; Type 2 diabetes mellitus.


Conflict of interest statement

Conflict of interest

No potential conflict of interest relevant to this article was reported.

Figures

Figure 1.
Figure 1.
Representative morphological photographs of the mouse testis, epididymis plus vas deferens, seminal vesicle plus prostate gland, and penis compared among type 1 diabetes mellitus control (C-T1DM), type 1 DM (T1DM), type 2 DM control (C-T2DM), and type 2 DM (T2DM) mice on experimental days 36 and 72. Scale bar, 1 cm.
Figure 2.
Figure 2.
Comparisons among type 1 diabetes mellitus control (C-T1DM), type 1 DM (T1DM), type 2 DM control (C-T2DM), and type 2 DM (T2DM) mice on experimental days 36 and 72. (A) Sperm concentration. (B) Acrosome reaction. Top right: representative photographs of acrosome-intact (AI) sperm stained with 0.22% Coomassie blue G-250 and acrosome-reacted (AR) sperm without staining. (C) Incomplete sperm DNA structure and packaging. Top right: toluidine blue-reacted (TB+) sperm indicating sperm with abnormal chromatin versus sperm with normal chromatin (TB–). (D) Visualization of sperm chromatin condensation. Top right: aniline blue-reacted (AB+) sperm indicating chromatin defects of sperm nuclei versus normal sperm (AB–). Values are presented as mean ± standard deviation. Scale bar, 1 μm. a)p< 0.05 compared with control; b)p< 0.05 compared with T2DM; c)p< 0.05 compared with T1DM.
Figure 3.
Figure 3.
The percentage of total abnormal sperm morphology compared among type 1 diabetes mellitus control (C-T1DM), type 1 DM (T1DM), type 2 DM control (C-T2DM), and type 2 DM (T2DM) mice on experimental days 36 and 72. Values are presented as mean ± standard deviation. Scale bar, 1 μm. N, normal; H1, thin-elongated head; H2, club-shaped head; H3, mild head defects; T1, bent head; T2, looping midpiece; T3, folded midpiece and principal piece; T4, incorrect head-neck connection. a)p< 0.05 compared with controls.
Figure 4.
Figure 4.
The percentages of individual types of abnormal sperm morphology compared among type 1 diabetes mellitus control (C-T1DM), type 1 DM (T1DM), type 2 DM control (C-T2DM), and type 2 DM (T2DM) mice on experimental days 36 and 72. (A) Abnormalities of the head. (B) Abnormalities of the tail. Values are presented as mean ± standard deviation. Scale bar, 1 μm. H1, thin-elongated head; H2, club-shaped head; H3, mild head defects; T1, bent head; T2, looping midpiece; T3, folded midpiece and principal piece; T4, incorrect head-neck connection. a)p< 0.05 compared with controls.
Figure 5.
Figure 5.
Seminiferous histopathology of the testis (%) compared among type 1 diabetes mellitus control (C-T1DM), type 1 DM (T1DM), type 2 DM control (C-T2DM), and type 2 DM (T2DM) mice on experimental days 36 and 72. Values are presented as mean ± standard deviation. a)p< 0.05 compared with controls.
Figure 6.
Figure 6.
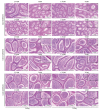
(A) Representative photomicrographs showing normal histology and histopathology. (a) Control group; normal arrangement of spermatogenic and Sertoli cells. (b-h) Histopathological findings of the seminiferous tubules found in the type 1 and type 2 diabetes mellitus (T1DM and T2DM) groups. (b) Sloughing of deciduous and spermatogenic cells (arrows) into the tubular lumen. (c) Cell with large nuclei (arrow) in the seminiferous epithelium. (d) Cell with small nuclei and vacuolization (arrow) in the seminiferous epithelium. (e) Few spermatogenic cell layers of artifactual sloughing (arrow) of germ cell elements into the lumen. (f) Vacuolization (arrows) of Sertoli cells and absence of spermatids. (g) Atrophy with germ cell degeneration and small vacuolization between spermatogonia and Sertoli cells. (h) Hypospermatogenesis with all germ layers diminished. (B) Seven histopathology types by percentage. Values are presented as mean ± standard deviation. C-T1DM, type 1 diabetes mellitus control; C-T2DM, type 2 DM control. a)p< 0.05 compared with controls; b)p< 0.05 compared with T2DM; c)p< 0.05 compared with T1DM.
Figure 7.
Figure 7.
Representative histology of caput, corpus, and caudal epididymides of type 1 diabetes mellitus control (C-T1DM), type 1 DM (T1DM), type 2 DM control (C-T2DM), and type 2 DM (T2DM) mice on experimental days 36 and 72. Arrows indicate the round germ cells in the epididymal lumen (small panels; scale bar, 20 μm).
Figure 8.
Figure 8.
Histomorphometric analysis of seminiferous tubular diameter (A) and epithelial height (B) compared among type 1 diabetes mellitus control (C-T1DM), type 1 DM (T1DM), type 2 DM control (C-T2DM), and type 2 DM (T2DM) mice on experimental days 36 and 72. Values are presented as mean ± standard deviation. a)p< 0.05 compared with controls.
Figure 9.
Figure 9.
Representative histology of tunica albuginea stained by H&E (lower panels) and Masson’s trichrome (upper panels; A) and thickness (B) compared among type 1 diabetes mellitus control (C-T1DM), type 1 DM (T1DM), type 2 DM control (C-T2DM), and type 2 DM (T2DM) mice on experimental days 36 and 72. Values are presented as mean ± standard deviation. a)p< 0.05 compared with controls.
Figure 10.
Figure 10.
(A) Representative penile histology as shown by H&E staining and (B) percentage of the penile cross-sectional area compared among type 1 diabetes mellitus control (C-T1DM), type 1 DM (T1DM), type 2 DM control (C-T2DM), and type 2 DM (T2DM) mice on experimental days 36 and 72. Values are presented as mean ± standard deviation. a)p< 0.05 compared with controls.
Figure 11.
Figure 11.
(A) Penile collagen fibers stained using Masson trichrome and (B) percentage of collagen fiber area compared among type 1 DM control (C-T1DM), type 1 DM (T1DM), type 2 DM control (C-T2DM), and type 2 DM (T2DM) mice on experimental days 36 and 72. Values are presented as mean ± standard deviation. a)p< 0.05 compared with controls.

Similar articles

Cited by

References

    1. Report of the Expert Committee on the Diagnosis and Classification of Diabetes Mellitus. Diabetes Care. 1997;20:1183–97. - PubMed
    1. American Diabetes Association Diagnosis and classification of diabetes mellitus. Diabetes Care. 2013;36 Suppl 1:S67–74. - PMC - PubMed
    1. American Diabetes Association Diagnosis and classification of diabetes mellitus. Diabetes Care. 2009;32 Suppl 1:S62–7. - PMC - PubMed
    1. Frier BM, Fisher M. Diabetes mellitus. In: Colledge NR, Walker BR, Ralston S, Davidson S, editors. Davidson’s principles and practice of medicine. India: Elsevier; 2010. p. 735.
    1. Ahangarpour A, Oroojan AA, Heidari H, Ghaedi E, Taherkhani R. Effects of hydro-alcoholic extract from Arctium lappa L. (Burdock) root on gonadotropins, testosterone, and sperm count and viability in male mice with nicotinamide/streptozotocin-induced type 2 diabetes. Malays J Med Sci. 2015;22:25–32. - PMC - PubMed