. 2020 Jun;22(6):1079-1087.
doi: 10.1038/s41436-020-0759-8. Epub 2020 Feb 10.

Copy-number variation contributes 9% of pathogenicity in the inherited retinal degenerations

Affiliations

Copy-number variation contributes 9% of pathogenicity in the inherited retinal degenerations

Erin Zampaglione et al. Genet Med. 2020 Jun.

Abstract

Purpose: Current sequencing strategies can genetically solve 55-60% of inherited retinal degeneration (IRD) cases, despite recent progress in sequencing. This can partially be attributed to elusive pathogenic variants (PVs) in known IRD genes, including copy-number variations (CNVs), which have been shown as major contributors to unsolved IRD cases.

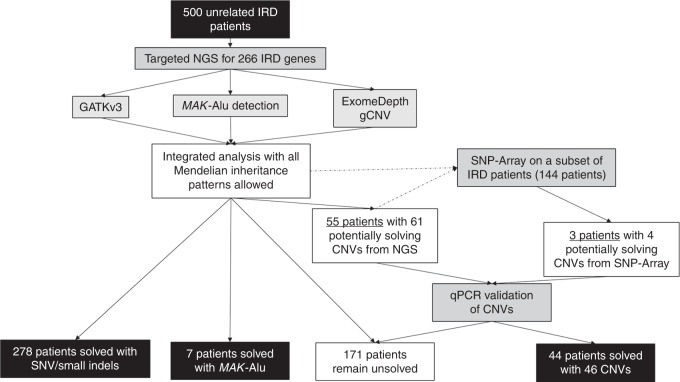
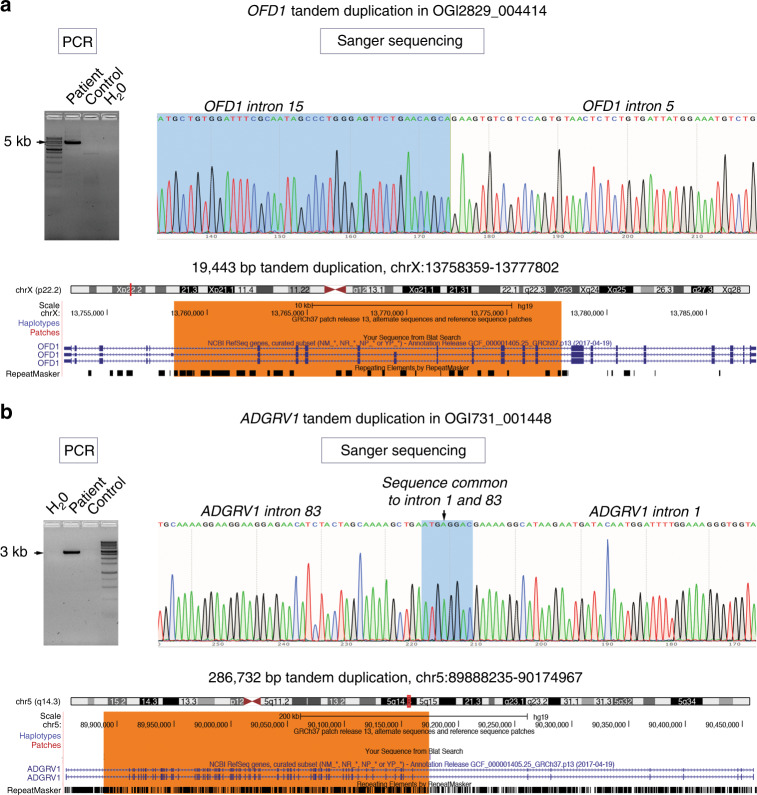
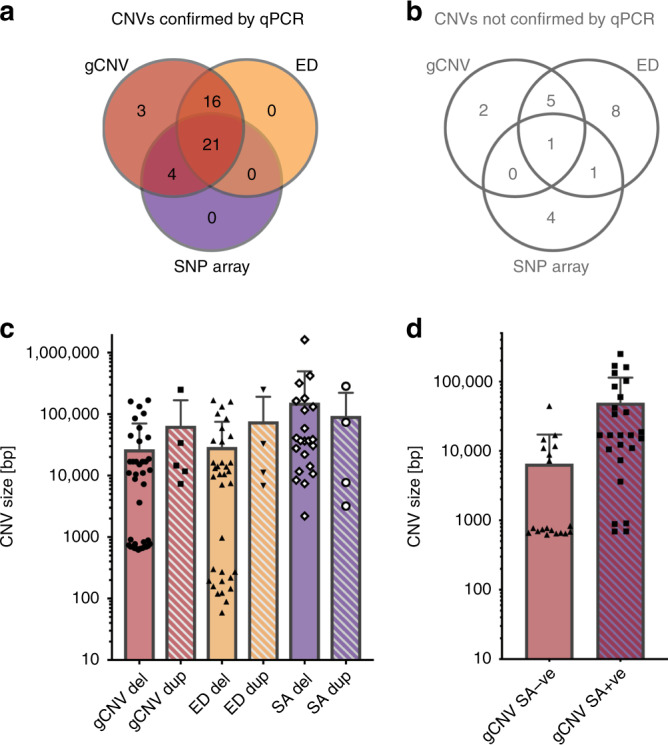
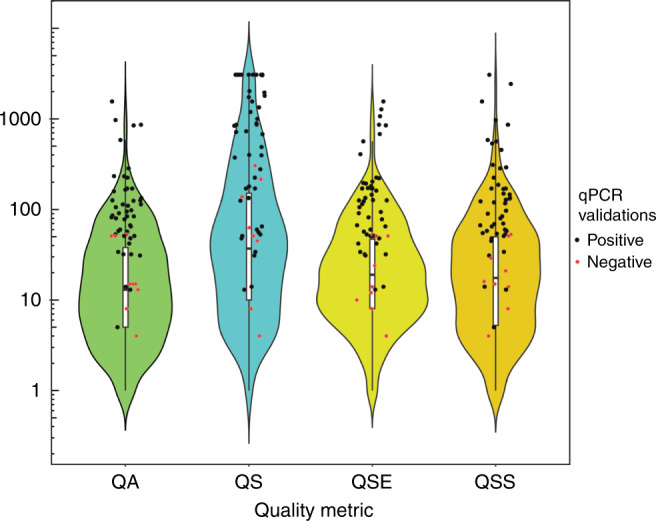
Methods: Five hundred IRD patients were analyzed with targeted next-generation sequencing (NGS). The NGS data were used to detect CNVs with ExomeDepth and gCNV and the results were compared with CNV detection with a single-nucleotide polymorphism (SNP) array. Likely causal CNV predictions were validated by quantitative polymerase chain reaction (qPCR).

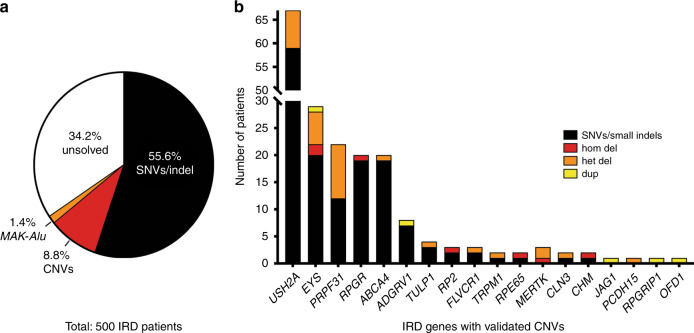
Results: Likely disease-causing single-nucleotide variants (SNVs) and small indels were found in 55.6% of subjects. PVs in USH2A (11.6%), RPGR (4%), and EYS (4%) were the most common. Likely causal CNVs were found in an additional 8.8% of patients. Of the three CNV detection methods, gCNV showed the highest accuracy. Approximately 30% of unsolved subjects had a single likely PV in a recessive IRD gene.

Conclusion: CNV detection using NGS-based algorithms is a reliable method that greatly increases the genetic diagnostic rate of IRDs. Experimentally validating CNVs helps estimate the rate at which IRDs might be solved by a CNV plus a more elusive variant.

Keywords: cone–rod dystrophy; copy-number variation; inherited retinal degeneration; retinitis pigmentosa; rod–cone dystrophy.


Conflict of interest statement

The authors declare no conflicts of interest.

Figures

Fig. 1
Fig. 1. Flowchart of analysis strategy for inherited retinal degeneration (IRD) cohort.
In this study, 500 unrelated IRD patients underwent targeted next-generation sequencing (NGS) and subsequent analysis for potentially causal genetic variants in IRD genes. A subset of the samples underwent additional single-nucleotide polymorphism (SNP) array analysis. Samples that had predicted likely causal copy-number variations (CNVs) were further analyzed with quantitative polymerase chain reaction (qPCR) to confirm the CNVs.
Fig. 2
Fig. 2. Summary of genetic contributions to inherited retinal degeneration (IRD) .
(a) Targeted next-generation sequencing (NGS) analysis in a cohort of 500 IRD subjects reveals single-nucleotide variant (SNV)/small indel solutions in 55.6% cases, copy-number variation (CNV) solutions in 8.8% cases, and MAK-Alu insertions in 1.4% cases. (b) Breakdown of CNV solutions by gene, with the number of patients solved by SNVs in the same gene. Note that genes that commonly have SNV solutions (USH2A, EYS) also tend to have CNV solutions, a notable exception being PRPF31, in which CNVs are more common than expected based on the number of SNVs. CNV copy-number variation, IRD inherited retinal degeneration, SNV single-nucleotide variant.
Fig. 3
Fig. 3. Mapping of tandem duplication breakpoints.
(a) OFD1 ex6–15 duplication in subject OGI2829_004414 was mapped with specific primers that only amplified the duplicated allele (primer sequences in the Supplementary Methods) and Sanger sequenced to reveal 19,443-bp tandem duplication on chromosome X (chrX:13758359–13777802 dup). (b) ADGRV1 ex2–82 duplication in subject OGI731_001448 was mapped with specific primers that only amplified the duplicated allele (primer sequences in the Supplementary Methods) and Sanger sequenced to reveal 286,732-bp tandem duplication on chromosome 5 (chr5:89888235–90174967 dup). PCR polymerase chain reaction.
Fig. 4
Fig. 4. Comparison of different copy-number variation (CNV) detection methods.
(a) Breakdown of true positive CNVs predicted by different methods. Note that all true positive CNVs were predicted by gCNV. (b) Breakdown of false positive CNVs predicted by different methods. Note that only one false positive CNV was predicted by all three CNV prediction methods. (c) The distribution of sizes of CNVs predicted by different methods. Note that in general, duplications were predicted less often, and were on average larger in size than predicted deletions. (d) Comparison of the gCNV predicted sizes of validated CNVs that were also predicted by the single-nucleotide polymorphism (SNP) array (gCNV SA + ve) versus the gCNV predicted size of validated CNVs that were not predicted by the SA (gCNV SA-ve). ED ExomeDepth, qPCR quantitative polymerase chain reaction.
Fig. 5
Fig. 5. Distribution of gCNV quality metrics for rare, nonopsin copy-number variations (CNVs).
The gCNV algorithm provides four quality metrics for every predicted CNV: QA, QS, QSE, and QSS. QA is the complementary Phred-scaled probability that all points (i.e., targets or bins) in the segment agree with the segment copy-number call. QS is the complementary Phred-scaled probability that at least one point (i.e., target or bin) in the segment agrees with the segment copy-number call. QSE is the complementary Phred-scaled probability that the segment end position is a genuine copy-number changepoint. QSS is the complementary Phred-scaled probability that the segment start position is a genuine copy-number changepoint. Violin plots show the relative probability density of the distribution of each quality metric, while internal box plots show the 25th, median, and 75th percentile of distribution. The red and black data points represent CNVs within the distribution that were experimentally determined to be either true positives (black) or false positives (red) by quantitative polymerase chain reaction (qPCR) validation.

References

    1. Berger W, Kloeckener-Gruissem B, Neidhardt J. The molecular basis of human retinal and vitreoretinal diseases. Prog Retin Eye Res. 2010;29:335–375. - PubMed
    1. Retinal Information Network. https://sph.uth.edu/retnet/home.htm. 2019. Accessed 20 November 2018.
    1. Consugar MB, Navarro-Gomez D, Place EM, et al. Panel-based genetic diagnostic testing for inherited eye diseases is highly accurate and reproducible, and more sensitive for variant detection, than exome sequencing. Genet Med. 2015;17:253–261. - PMC - PubMed
    1. Weisschuh N, Mayer AK, Strom TM, et al. Mutation detection in patients with retinal dystrophies using targeted next generation sequencing. PLoS One. 2016;11:1–15. - PMC - PubMed
    1. Zhao L, Wang F, Wang H, et al. Next-generation sequencing-based molecular diagnosis of 82 retinitis pigmentosa probands from Northern Ireland. Hum Genet. 2015;134:217–230. - PMC - PubMed

Publication types