Meta-Analysis
. 2020 Mar;122(7):1085-1093.
doi: 10.1038/s41416-020-0741-x. Epub 2020 Feb 10.

Combined lifestyle factors, incident cancer, and cancer mortality: a systematic review and meta-analysis of prospective cohort studies

Affiliations
Meta-Analysis

Combined lifestyle factors, incident cancer, and cancer mortality: a systematic review and meta-analysis of prospective cohort studies

Yan-Bo Zhang et al. Br J Cancer. 2020 Mar.

Abstract

Background: Cancer poses a huge disease burden, which could be reduced by adopting healthy lifestyles mainly composed of healthy diet, body weight, physical activity, limited alcohol consumption, and avoidance of smoking. However, no systematic review has summarised the relations of combined lifestyle factors with cancer morbidity and mortality.

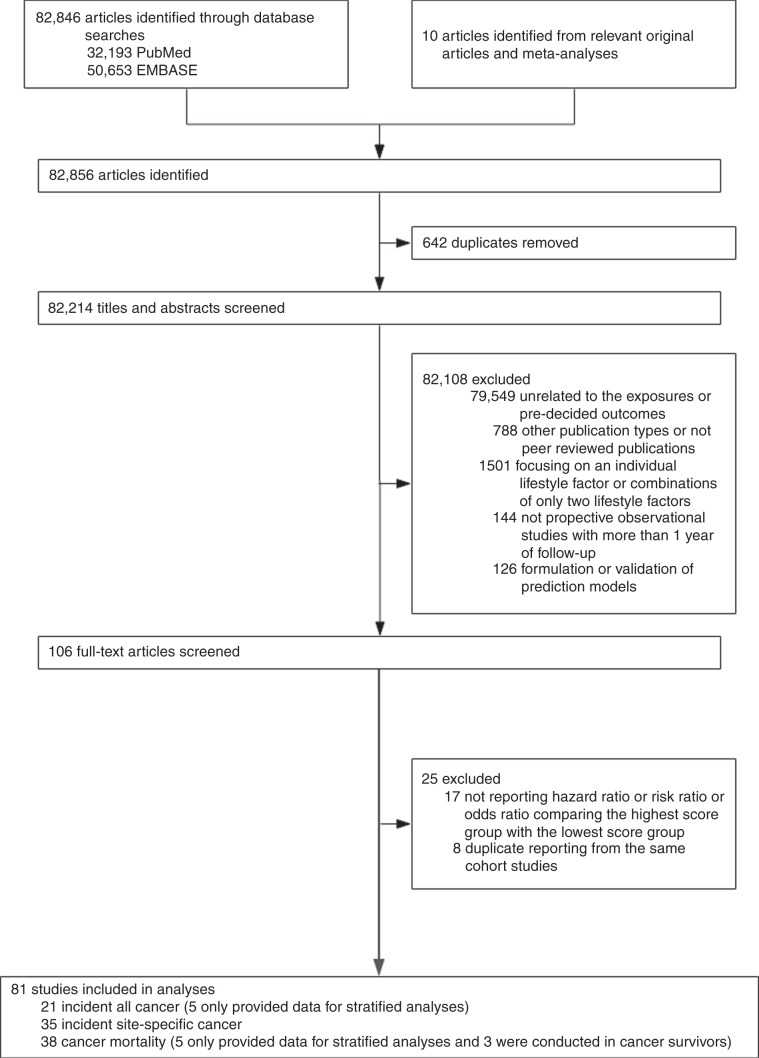
Methods: EMBASE and PubMed were searched up to April 2019. Cohort studies investigating the association of combined lifestyle factors with risks of incident cancer and cancer mortality were selected. Summary hazard ratios (HRs) and 95% confidence intervals (CIs) were calculated using random-effects models. Heterogeneity and publication bias tests were conducted.

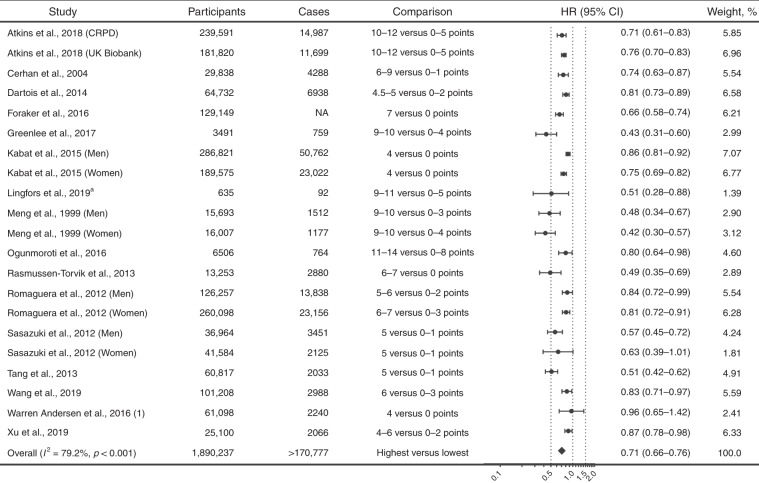
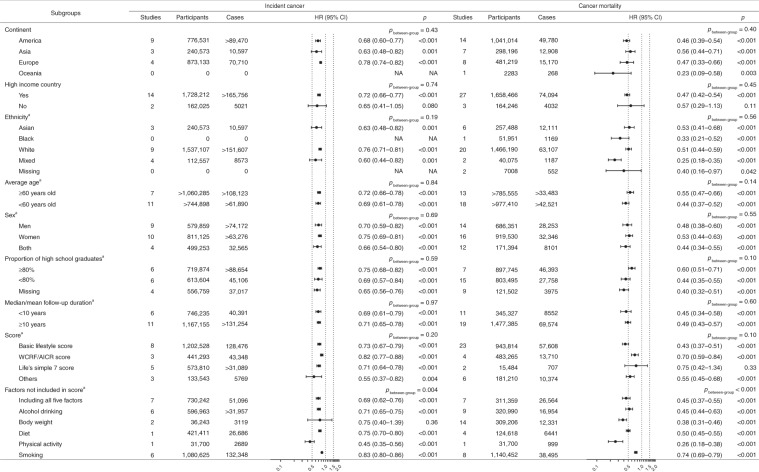
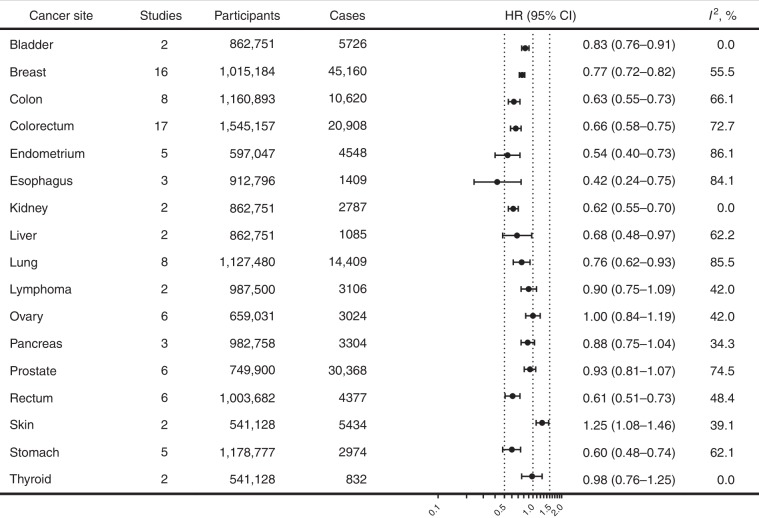
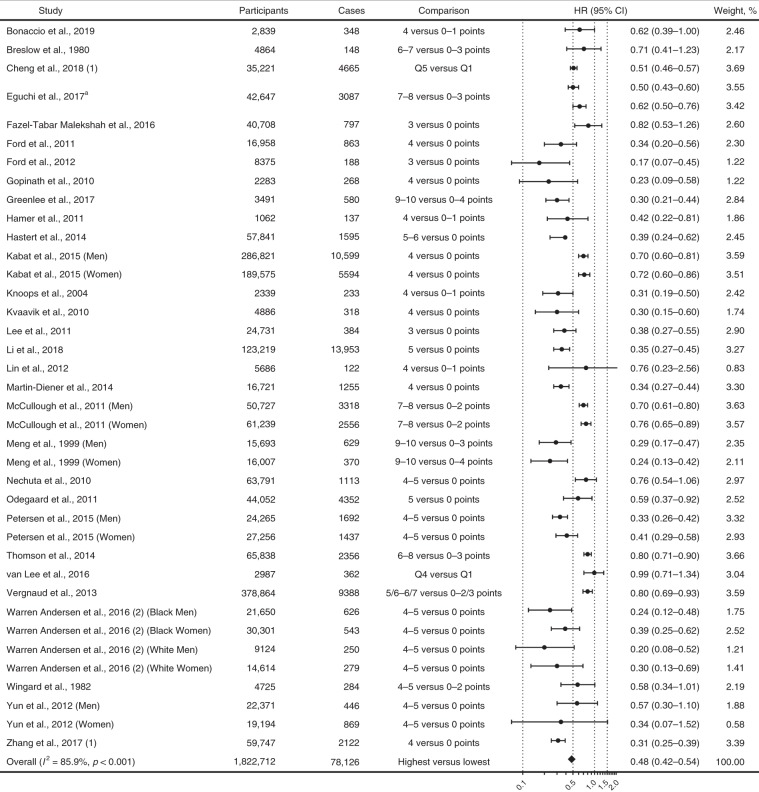
Results: The HRs (95% CIs) comparing individuals with the healthiest versus the least healthy lifestyles were 0.71 (0.66-0.76; 16 studies with 1.9 million participants) for incident cancer and 0.48 (0.42-0.54; 30 studies with 1.8 million participants) for cancer mortality. Adopting the healthiest lifestyles was also associated with 17 to 58% lower risks of bladder, breast, colon, endometrial, oesophageal, kidney, liver, lung, rectal, and gastric cancer. The relations were largely consistent and significant among participants with different characteristics in the subgroup analyses.

Conclusions: Adopting healthy lifestyles is associated with substantial risk reduction in cancer morbidity and mortality, and thus should be given priority for cancer prevention.


Conflict of interest statement

The authors declare no competing interests.

Figures

Fig. 1
Fig. 1. Flowchart of study selection.
HR hazard ratio; OR odds ratio; RR, risk ratio. There were nine studies reporting multiple outcomes (two or more outcomes), so the total number of studies for different outcomes exceeded 81.
Fig. 2
Fig. 2. Association of combined lifestyle factors with incident cancer.
CI confidence interval; CRPD Clinical Practice Research Datalink; HR hazard ratio; NA not available. The forest plot shows the HRs comparing individuals with the healthiest lifestyles (in the highest score group) with those with the least healthy lifestyles (in the lowest score group) for incident cancer. The number of participants and incident cases were shown in the figure. Each dot represents the HR for each original article, with the location of the circle representing both the direction and magnitude of the effect size, and the HR is bounded by a CI. The rhombs represent the pooled HRs. aOdds ratio was reported in the study and was transformed into relative risk, which was then used in the pooled analysis.
Fig. 3
Fig. 3. Association of combined lifestyle factors with incident cancer and cancer mortality in different subgroups.
AICR American Institute for Cancer Research; CI confidence interval; HR hazard ratio; NA not available; WCRF World Cancer Research Fund. The forest plot shows HRs comparing individuals with the healthiest lifestyles (in the highest score group) with those with the least healthy lifestyles (in the lowest score group). Each dot represents the HR, with the location of the circle representing both the direction and magnitude of the effect size, and the HR is bounded by a CI. Foraker et al. did not report the number of incident cancer cases. aSince a number of studies conducted subgroup analyses or sensitivity analyses, the total number of studies in these stratified analyses exceeded the number of studies included in main analysis.
Fig. 4
Fig. 4. Association of combined lifestyle factors with the risks of site-specific cancers.
CI confidence interval; HR hazard ratio. The forest plot shows the HRs comparing individuals with the healthiest lifestyles (in the highest score group) with those with the least healthy lifestyles (in the lowest score group) for the risks of site-specific cancers. Each dot represents the HR, with the location of the circle representing both the direction and magnitude of the effect size, and the HR is bounded by a CI.
Fig. 5
Fig. 5. Association of combined lifestyle factors with cancer mortality.
CI confidence interval; CVD cardiovascular disease; HR hazard ratio. The forest plot shows the HRs comparing individuals with the healthiest lifestyles (in the highest score group) with those with the least healthy lifestyles (in the lowest score group) for cancer mortality. Each dot represents the HR for each original article, with the location of the circle representing both the direction and magnitude of the effect size, and the HR is bounded by a CI. The rhombs represent the pooled HRs. aEguchi et al. reported results in well-educated and poor-educated groups respectively.

References

    1. Bray F, Ferlay J, Soerjomataram I, Siegel RL, Torre LA, Jemal A. Global cancer statistics 2018: GLOBOCAN estimates of incidence and mortality worldwide for 36 cancers in 185 countries. CA Cancer J. Clin. 2018;68:394–424. doi: 10.3322/caac.21492. - DOI - PubMed
    1. Kyu HH, Abate D, Abate KH, Abay SM, Abbafati C, Abbasi N, et al. Global, regional, and national disability-adjusted life-years (DALYs) for 359 diseases and injuries and healthy life expectancy (HALE) for 195 countries and territories, 1990–2017: a systematic analysis for the Global Burden of Disease Study 2017. Lancet. 2018;392:1859–1922. doi: 10.1016/S0140-6736(18)32335-3. - DOI - PMC - PubMed
    1. Jönsson B, Hofmarcher T, Lindgren P, Wilking N. The cost and burden of cancer in the European Union 1995–2014. Eur. J. Cancer. 2016;66:162–170. doi: 10.1016/j.ejca.2016.06.022. - DOI - PubMed
    1. Mariotto AB, Yabroff KR, Shao Y, Feuer EJ, Brown ML. Projections of the cost of cancer care in the United States: 2010-2020. J. Natl Cancer Inst. 2011;103:117–128. doi: 10.1093/jnci/djq495. - DOI - PMC - PubMed
    1. Colditz GA, Wolin KY, Gehlert S. Applying what we know to accelerate cancer prevention. Sci. Transl. Med. 2012;4:127rv124. doi: 10.1126/scitranslmed.3003218. - DOI - PMC - PubMed

Publication types