. 2020 Jan 21:13:1446.
doi: 10.3389/fnins.2019.01446. eCollection 2019.

Effect of Rocking Movements on Afternoon Sleep

Affiliations

Effect of Rocking Movements on Afternoon Sleep

Rachel M van Sluijs et al. Front Neurosci. .

Abstract

Study objectives: Gentle rocking movements provided by a moving bed have been proposed as a promising non-pharmacological way to promote sleep. In rodents the sleep promoting effect of rocking movements depended on the peak acceleration (named "stimulation intensity") perceived by the vestibular system. We set out to verify previous reports on the sleep promoting effect of rocking movements and to investigate the importance of stimulation intensity in this process.

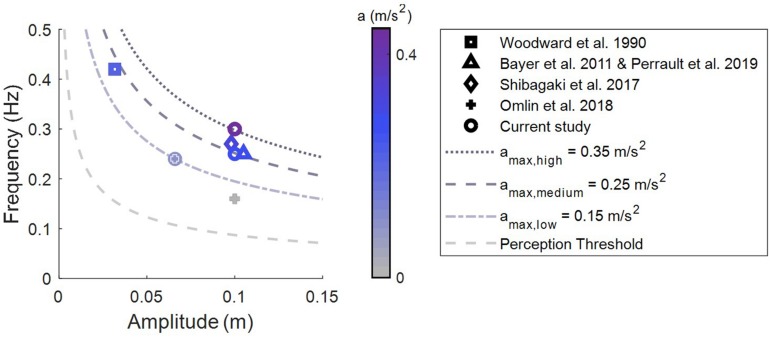
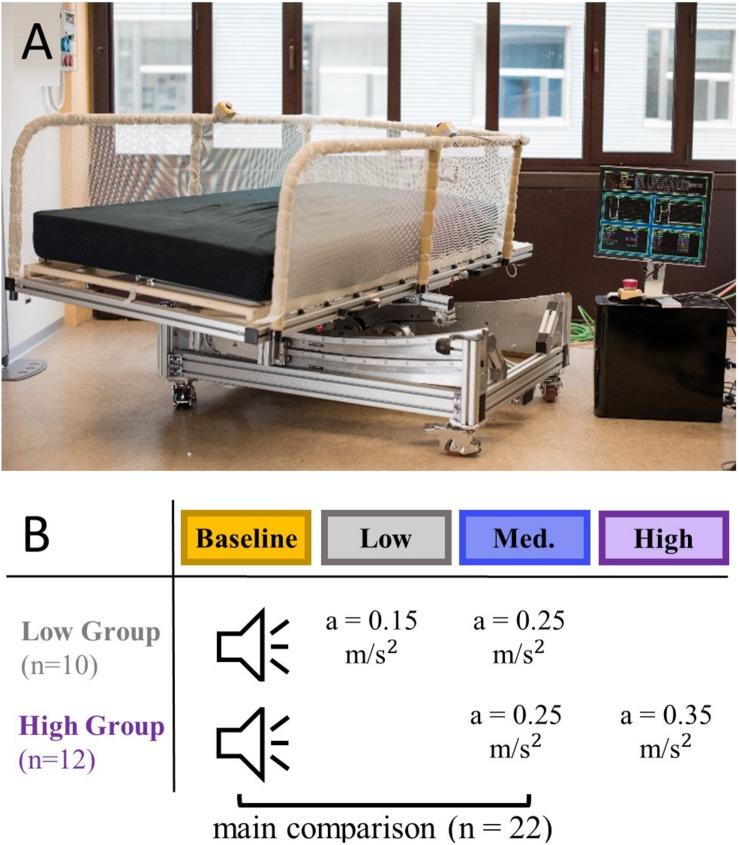
Methods: Side-to-side rocking movements along a pendulum trajectory with different peak accelerations (control: 0 m/s2, low intensity: 0.15 m/s2, medium intensity: 0.25 m/s2, high intensity: 0.35 m/s2) were provided for 45 min during an afternoon nap opportunity. Participants were assigned to a low intensity group (n = 10) experiencing control, low and medium intensity stimulation or a high intensity group (n = 12) experiencing control, medium and high intensity stimulation. Sleep and sleep-related memory performance were assessed using polysomnography and a word-pair memory task, respectively.

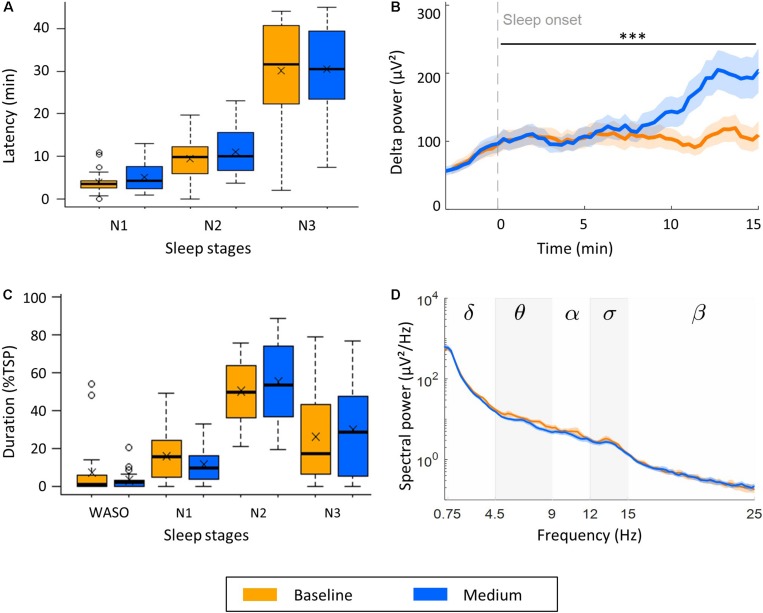
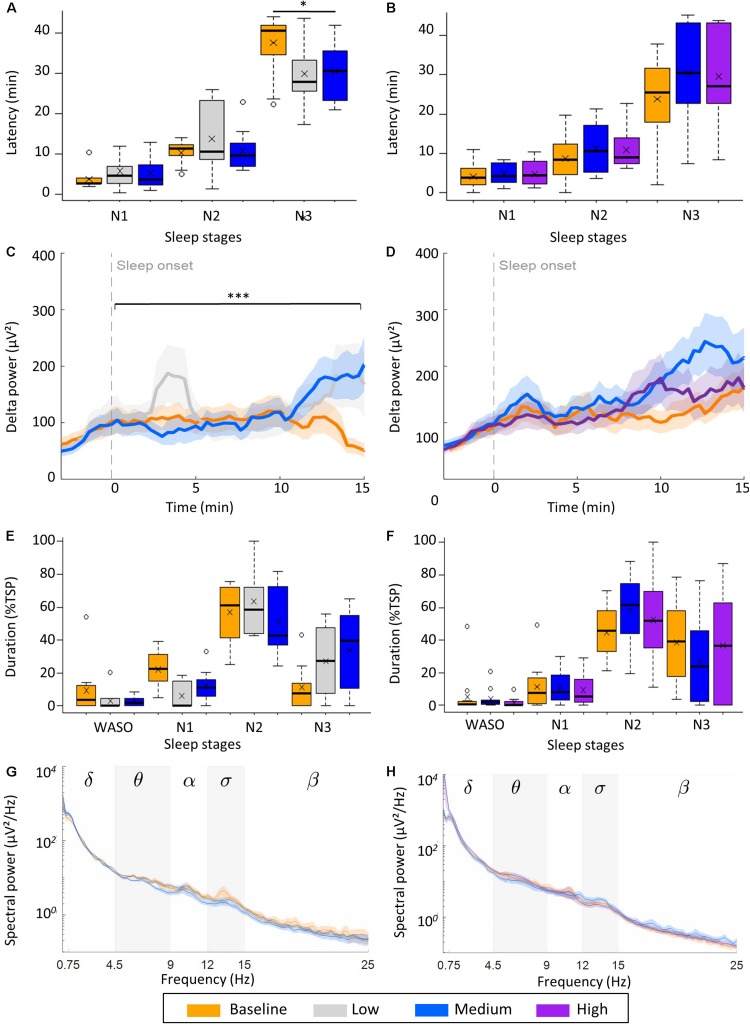
Results: Participants transitioned faster into deep sleep under the influence of medium intensity rocking as was evident by a faster buildup of delta power compared to the control condition (n = 22). The faster buildup did not affect sleep architecture, since e.g., the proportion of the nap spent in deep sleep or latencies did not change. Previously reported effects like a shorter latency to stage N2 and a higher density of sleep spindles were not observed. Sleep quality during control naps of the low intensity group was worse than in the high intensity group. In the low intensity group, we also observed a significant increase in delta power throughout the nap, as well as a higher density of slow oscillations both under the influence of low and medium intensity vestibular stimulation. No such effects were observed in the high intensity group.

Conclusion: Rocking movements may promote nap sleep in young adults. Due to a difference in sleep quality during control naps between the low and high intensity group no conclusion regarding the influence of stimulation intensity were possible. Thus, optimal stimulation settings in humans need further investigation.

Keywords: declarative memory; movement Intervention; nap sleep; polysomnography; vestibular stimulation.


Figures

FIGURE 1
FIGURE 1
Stimulation intensities (peak acceleration) of rocking movements. Overview of intensities used to assess sleep promoting effects of vestibular stimulation in adults. Lines are isoparametric acceleration curves.
FIGURE 2
FIGURE 2
A rocking bed was used to provide vestibular stimulation at three levels of intensity. (A) Picture of the Somnomat rocking bed (here not located in the sleep laboratory) performing a side-to-side motion along a pendulum trajectory. (B) Participants were divided in a group having a nap opportunity with low intensity stimulation (n = 10) and a group having a nap opportunity with high intensity stimulation (n = 12), all participants additionally had one control and medium intensity stimulation nap opportunity. Recorded sound of the bed was played back during the control condition.
FIGURE 3
FIGURE 3
Effect of medium intensity vestibular stimulation on sleep and the sleep EEG (n = 22). (A) Effect of rocking on transition from wake to NREM sleep stages N1, N2, and N3. (B) Buildup of delta power (0.75–4.5 Hz) from 3 min before to 15 min after sleep onset. (C) Time spent awake after sleep onset (WASO), and in stage N1, N2, and N3 expressed as percentage of the total sleep period (TSP). (D) Power density spectra of channel C4-A1 during stage N3. Boxplots with mean values (x) and outliers (o) are illustrated. Lines represent mean power, shading SEM, and stars the significance increase of the slope of delta power (μV2/s) during the first 15 min after sleep onset (B, ∗∗∗p < 0.001).
FIGURE 4
FIGURE 4
Effect of vestibular stimulation on transition from wake to sleep. (A,B) Effect of rocking on transition from wake to NREM sleep stages N1, N2, and N3 (latency). Boxplots with mean value (x) and outliers (o) are illustrated shown. (A) low intensity (n = 10), (B) high intensity group (n = 12). Boxplots with mean value (x) and outliers (o) are illustrated. (C,D) Buildup of delta power (0.75–4.5 Hz) from 3 min before to 15 min after sleep onset. (C) Low intensity (n = 9), (D) high intensity group (n = 11). (E,F) Time spent awake after sleep onset (WASO), and in stage N1, N2, and N3 expressed as percentage of the total sleep period (TSP). Boxplots with mean (x) and outliers (°) are shown. (G,H) Power density spectra of channel C4-A1 during stage N3. Lines are mean power, shading is SEM of power, stars represent the significance of condition (p) of a repeated measures ANOVA of the latency to stage N3 (A, p < 0.01) and of the slope of delta power (μV2/min) during the first 15 min after sleep onset (C, ∗∗∗p < 0.001).
FIGURE 5
FIGURE 5
Relationship between stimulation intensity and rocking related changes (rocking – control) in sleep efficiency (A), sleep onset latency (B), proportion of time spent in deep sleep (C), and density of sleep spindles (D). Purple/gray markers indicate significance/no significance at p < 0.05. Sleep efficiency was defined as total sleep time/time in bed × 100. Values of(Bayer et al. (2011) were calculated based on the reported total sleep time (TST). Sleep onset latency was defined as time from lights off to the first occurrence of N2, except for Woodward et al. (1990) where sleep onset latency was defined as lights off to first two consecutive minutes of any sleep stage. Bayer et al. (2011) did not report inferential statistics for the latency to stage N2. Proportion of time spent in deep sleep was calculated as% of stage N3 or stages S3+S4 of TST. Density of sleep spindles was defined as spindles per 30 s in NREM sleep, except for Perrault et al. (2019) where the density was calculated only over stage N3. Omlin et al. (2018) calculated the values only during the first 2 h after lights off.)

References

    1. Alhola P., Polo-Kantola P. (2007). Sleep deprivation: impact on cognitive performance. Neuropsychiatr. Dis. Treatm. 3 553–567. - PMC - PubMed
    1. Barnard K. E., Bee H. L. (1983). The impact of temporally patterned stimulation on the development of preterm infants. Child Dev. 54 1156–1167. 10.1111/j.1467-8624.1983.tb00536.x - DOI - PubMed
    1. Bayer L., Constantinescu I., Perrig S., Vienne J., Vidal P. P., Mühlethaler M., et al. (2011). Rocking synchronizes brain waves during a short nap. Curr. Biol. 21 R461–R462. - PubMed
    1. Bersagliere A., Achermann P. (2010). Slow oscillations in human non−rapid eye movement sleep electroencephalogram: effects of increased sleep pressure. J. Sleep Res. 19 228–237. 10.1111/j.1365-2869.2009.00775.x - DOI - PubMed
    1. Besedovsky L., Ngo H.-V. V., Dimitrov S., Gassenmaier C., Lehmann R., Born J. (2017). Auditory closed-loop stimulation of EEG slow oscillations strengthens sleep and signs of its immune-supportive function. Nat. Commun. 8:1984. 10.1038/s41467-017-02170-3 - DOI - PMC - PubMed