Review
. 2020 Jan 17:10:1534.
doi: 10.3389/fphys.2019.01534. eCollection 2019.

The Many Facets of Erythropoietin Physiologic and Metabolic Response

Affiliations
Review

The Many Facets of Erythropoietin Physiologic and Metabolic Response

Sukanya Suresh et al. Front Physiol. .

Abstract

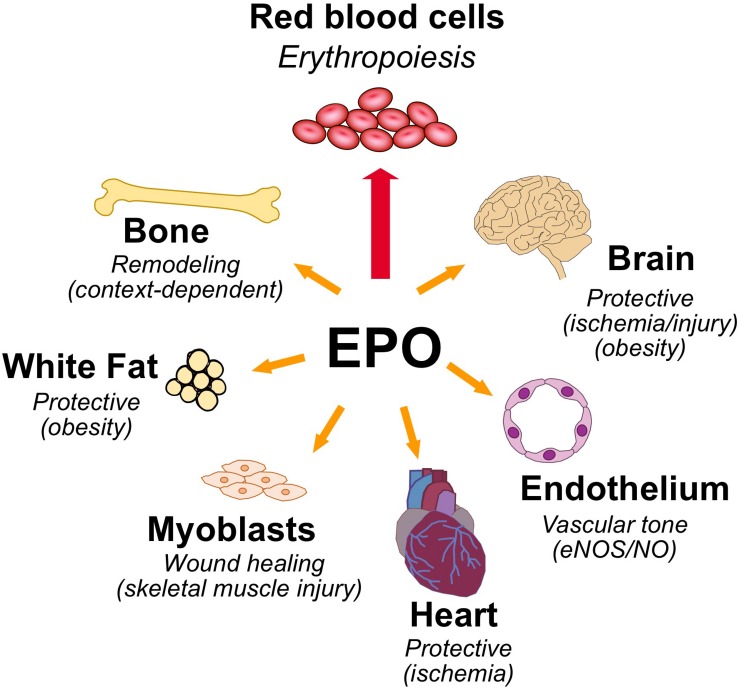
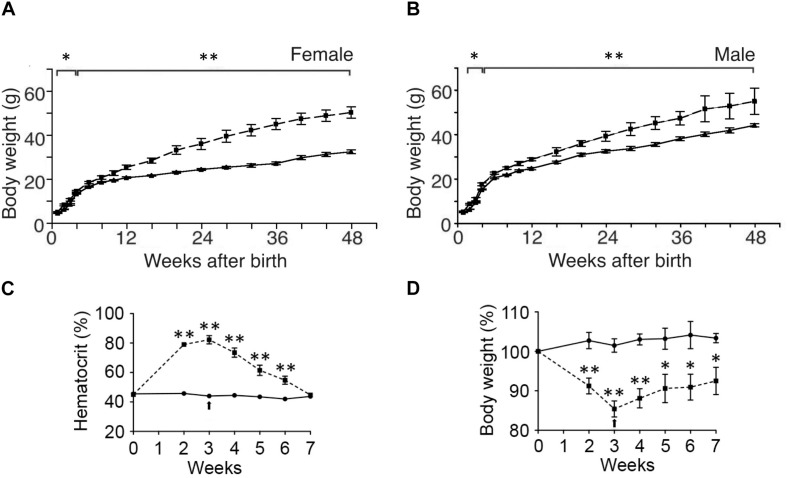
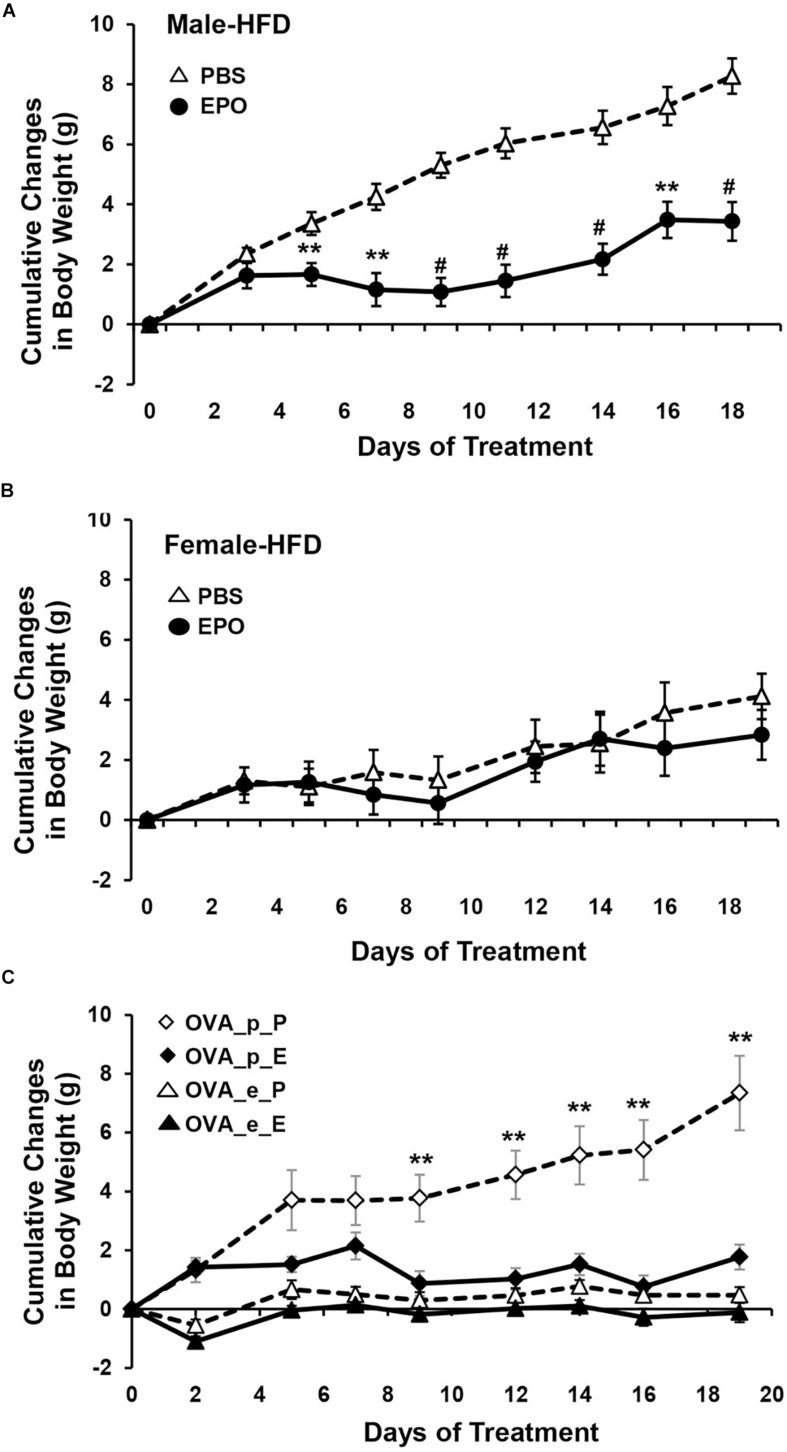
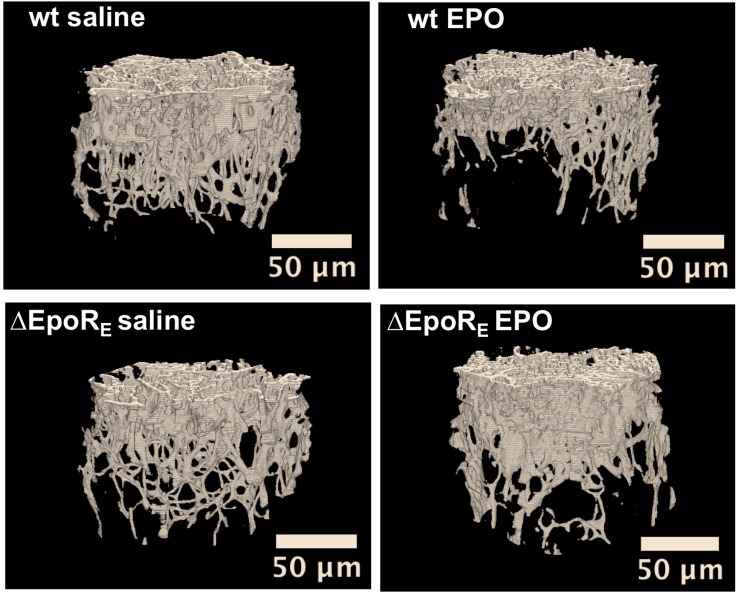
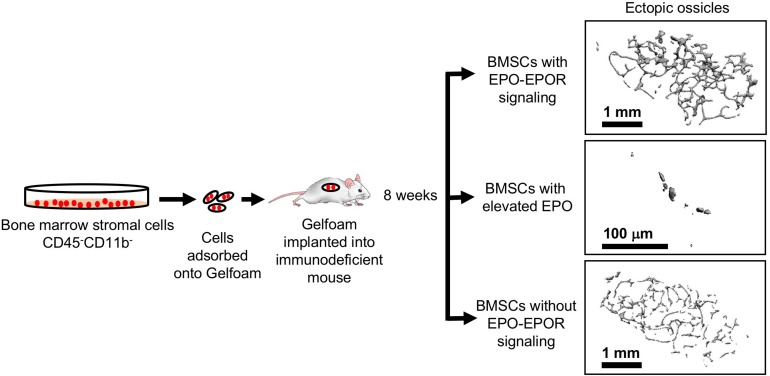
In mammals, erythropoietin (EPO), produced in the kidney, is essential for bone marrow erythropoiesis, and hypoxia induction of EPO production provides for the important erythropoietic response to ischemic stress, such as during blood loss and at high altitude. Erythropoietin acts by binding to its cell surface receptor which is expressed at the highest level on erythroid progenitor cells to promote cell survival, proliferation, and differentiation in production of mature red blood cells. In addition to bone marrow erythropoiesis, EPO causes multi-tissue responses associated with erythropoietin receptor (EPOR) expression in non-erythroid cells such neural cells, endothelial cells, and skeletal muscle myoblasts. Animal and cell models of ischemic stress have been useful in elucidating the potential benefit of EPO affecting maintenance and repair of several non-hematopoietic organs including brain, heart and skeletal muscle. Metabolic and glucose homeostasis are affected by endogenous EPO and erythropoietin administration affect, in part via EPOR expression in white adipose tissue. In diet-induced obese mice, EPO is protective for white adipose tissue inflammation and gives rise to a gender specific response in weight control associated with white fat mass accumulation. Erythropoietin regulation of fat mass is masked in female mice due to estrogen production. EPOR is also expressed in bone marrow stromal cells (BMSC) and EPO administration in mice results in reduced bone independent of the increase in hematocrit. Concomitant reduction in bone marrow adipocytes and bone morphogenic protein suggests that high EPO inhibits adipogenesis and osteogenesis. These multi-tissue responses underscore the pleiotropic potential of the EPO response and may contribute to various physiological manifestations accompanying anemia or ischemic response and pharmacological uses of EPO.

Keywords: bone; erythropoietin; erythropoietin receptor; gender-specific; inflammation; nitric oxide; obesity.


Figures

FIGURE 1
FIGURE 1
Pleiotropic effects of erythropoietin. High level of EPOR on erythroid progenitor cells accounts for the sensitive erythropoietic response in the bone marrow to hypoxic induction of EPO. EPOR expression determines EPO response and expression beyond erythroid tissue provides for EPO response in non-hematopoietic tissues that include the following: brain for a neuroprotective and metabolic response; cardiovascular system for regulating vascular tone and oxygen delivery in endothelium and protection in heart against ischemic injury; skeletal muscle for muscle maintenance and repair; white adipose tissue for protection for inflammation associated with diet-induced obesity and fat mass accumulation, particularly in males; and bone remodeling.
FIGURE 2
FIGURE 2
Expression of EPOR reporter gene in transgenic mice. (A) The proximal promoter region of the human EPOR gene extending to the translation start site with ATG at +135 in the human EPOR gene, contains conserved regulatory binding sites for GATA proteins (AGATAA) and Sp1 (CCGCCC), and 3-E-boxes (CAGCTG) in the 5′ untranslated transcribed region that can bind basic-helix-loop-helix transcription factors such as erythroid TAL1 and skeletal muscle transcription factors Myf5 and MyoD. (B) Transgenic mice containing the human EPOR proximal promoter region extending 1778 bp 5′ of the transcription start site driving the β-galactosidase reporter gene shows EPOR expression in the embryonic brain at embryonic day E9.5 (from Liu et al., 1997, with permission). (C) Reporter gene expression at embryonic day 12.5 (left) and embryonic day 13.5 (right) in the visceral arches, base of limbs, intercostal rib regions, and fetal liver (from Ogilvie et al., 2000, with permission).
FIGURE 3
FIGURE 3
Endogenous and exogenous EPO signaling regulates white fat mass accumulation. (A,B) Body weight to 48 weeks of age are indicated for wild type mice (solid line) and mice with EPOR restricted to erythroid tissue (Suzuki et al., 2002) (ΔEpoRE) (dashed line) for females (A) and males (B). (C,D) Hematocrit (C) and % body weight normalized to starting body weight (D) for male wild type mice subjected to 3 weeks of EPO treatment at 3000 U/kg three times weekly (dashed line) or saline (solid line). Arrow indicates end of EPO treatment. p < 0.05; ∗∗p < 0.01 (from Teng et al., 2011b, with permission).
FIGURE 4
FIGURE 4
EPO regulation of fat mass is gender specific. (A,B) Cumulative body weight change was monitored in male (A) and female (B) mice (16 weeks) fed high fat diet and treated with EPO at 3000 U/kg three times weekly (solid symbol) or saline (open symbol) for 3 weeks. (C) Cumulative body weight change in female ovariectomized (OVA) mice with placebo (p) or estradiol pellet-supplement and treated with EPO (E) or phosphate-buffered saline (P). ∗∗p < 0.01; #p < 0.001 (from Zhang et al., 2017, with permission).
FIGURE 5
FIGURE 5
EPO and % weight change per year were associated in opposing directions in males and females. (A,B) In full-heritage Southwestern Native Americans, the association of plasma EPO concentrations (adjusted for creatinine, hemoglobin, and storage time) and % weight change per year was negative in men (A) (closed squares, N = 41; r = –0.35, p = 0.02). Plasma EPO concentration was positively associated with % weight change per year in females (B) (open circles, N = 38; r = 0.37, p = 0.02) (modified from Reinhardt et al., 2016, with permission).
FIGURE 6
FIGURE 6
Endogenous and exogenous EPO signaling regulates bone formation. Micro-CT 3D images of trabecular bone from wild type (wt) mice and mice with EPOR restricted to erythroid tissue (ΔEpoRE) (Suzuki et al., 2002). Mice (age 8 weeks) were treated with EPO at 1200 U/kg for 10 days (EPO) or saline. Images from saline treatment (left) show reduction in bone formation in ΔEpoRE mice that lack EPOR in non-hematopoietic tissue. Furthermore, the reduction in bone parameters with EPO treatment in wild type mice (top) is not seen in ΔEpoRE mice (bottom), indicating that bone loss with EPO treatment is mediated by non-erythroid response (from Suresh et al., 2019, with permission).
FIGURE 7
FIGURE 7
Ectopic bone formation assay with BMSC. Adherent BMSC were selected from cultures of bone marrow cells harvested from wild type and genetically altered mice. Cells were absorbed into Gelfoam and surgically transplanted into immunocompromised NSG mice (Jackson Laboratory). After 8 weeks, ectopic bone ossicles formed and were analyzed by micro-CT. Ossicles formed in transplants from ΔEpoRE mice that lack EPOR in non-hematopoietic tissue (bottom) showed similar structure to control mice (top) with a trend toward fewer trabeculae, consistent with a reduction in endogenous bone formation in ΔEpoRE mice. Bone formation was markedly reduced with hardly any trabecular bone in ossicles in transplants from transgenic mice expressing high level of human EPO (Ruschitzka et al., 2000) (middle) compared with control mice (top), reflecting the even greater reduction of endogenous bone formation in these transgenic mice compared with ΔEpoRE mice and control mice (modified from Suresh et al., 2019, with permissions).

References

    1. Alnaeeli M., Noguchi C. T. (2015). Erythropoietin and obesity-induced white adipose tissue inflammation: redefining the boundaries of the immunometabolism territory. Adipocyte 4 153–157. 10.4161/21623945.2014.978654 - DOI - PMC - PubMed
    1. Alnaeeli M., Raaka B. M., Gavrilova O., Teng R., Chanturiya T., Noguchi C. T. (2014). Erythropoietin signaling: a novel regulator of white adipose tissue inflammation during diet-induced obesity. Diabetes Metab. Res. Rev. 63 2415–2431. 10.2337/db13-0883 - DOI - PMC - PubMed
    1. Anagnostou A., Lee E. S., Kessimian N., Levinson R., Steiner M. (1990). Erythropoietin has a mitogenic and positive chemotactic effect on endothelial cells. Proc. Natl. Acad. Sci. U.S.A. 87 5978–5982. 10.1073/pnas.87.15.5978 - DOI - PMC - PubMed
    1. Anagnostou A., Liu Z., Steiner M., Chin K., Lee E. S., Kessimian N., et al. (1994). Erythropoietin receptor mRNA expression in human endothelial cells. Proc. Natl. Acad. Sci. U.S.A. 91 3974–3978. 10.1073/pnas.91.9.3974 - DOI - PMC - PubMed
    1. Ang S. O., Chen H., Hirota K., Gordeuk V. R., Jelinek J., Guan Y., et al. (2002). Disruption of oxygen homeostasis underlies congenital Chuvash polycythemia. Nat. Genet. 32 614–621. 10.1038/ng1019 - DOI - PubMed