

Metabolic Pathway Profiling in Intracellular and Extracellular Environments of Streptococcus thermophilus During pH-Controlled Batch Fermentations
- PMID: 32038577
- PMCID: PMC6990133
- DOI: 10.3389/fmicb.2019.03144
Metabolic Pathway Profiling in Intracellular and Extracellular Environments of Streptococcus thermophilus During pH-Controlled Batch Fermentations
Abstract
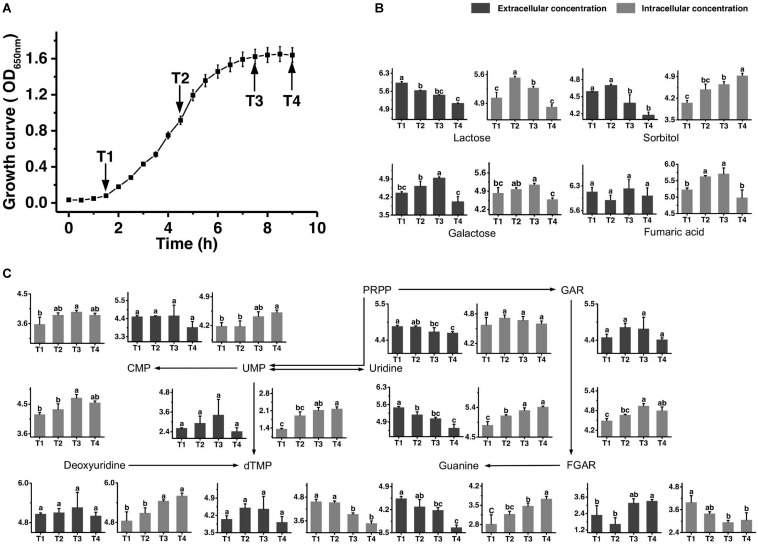
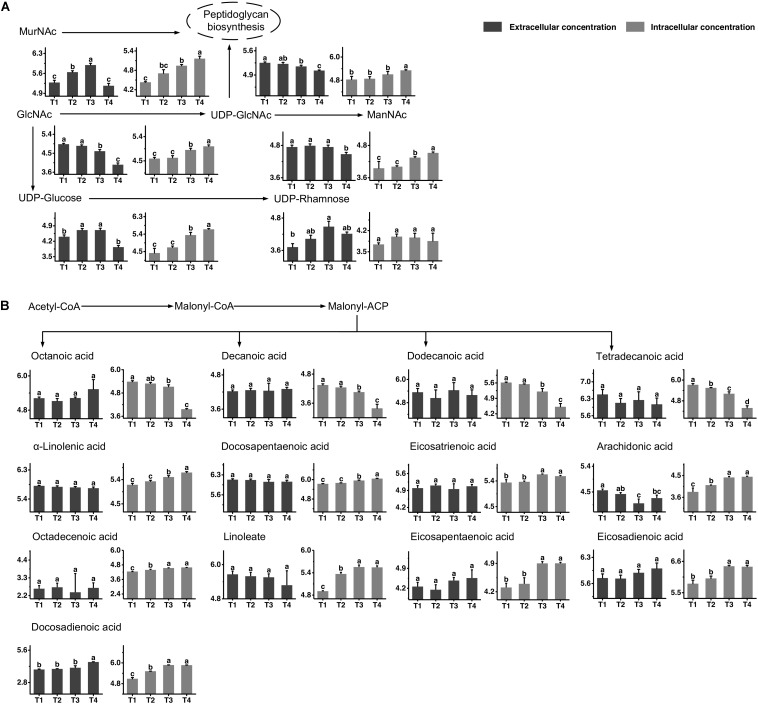
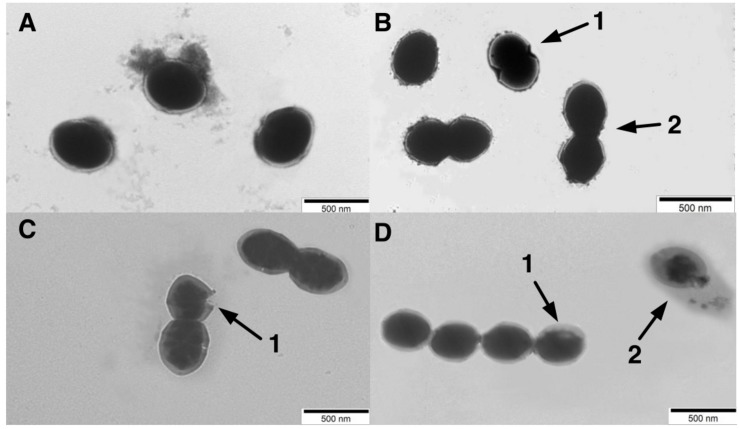
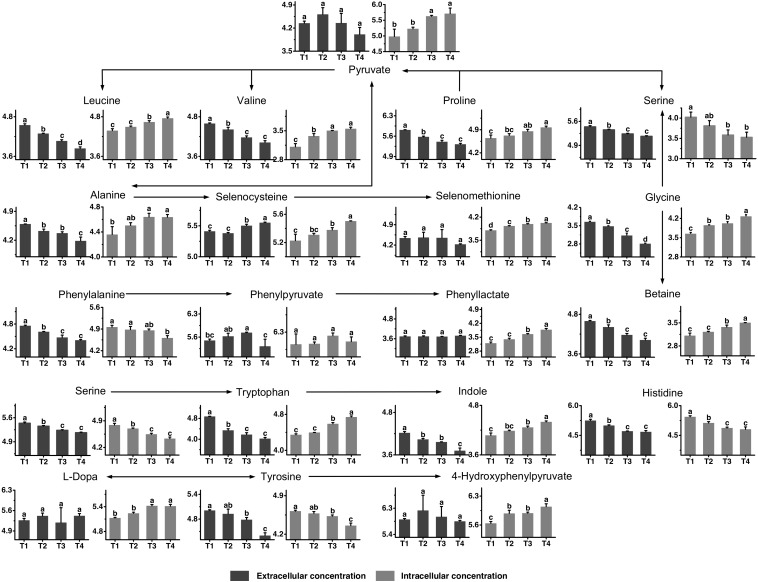
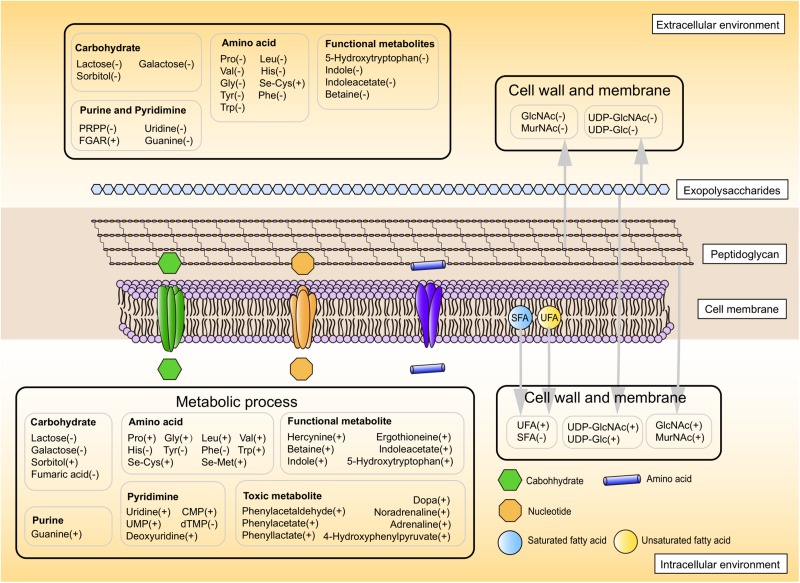
Elucidating the metabolite profiles during the growth of Streptococcus thermophilus is beneficial for understanding its growth characteristics. The changes in the intracellular and extracellular concentrations of carbohydrates, nucleotides, amino sugars, nucleoside sugars, fatty acids, and amino acids, as well as their metabolites over time, were investigated by metabolomics technology. Most metabolites of nucleotides were highly accumulated in the intracellular environment after the mid-exponential phase. Increases in the intracellular unsaturated fatty acids and N-acetyl-glucosamine and N-acetyl-muramoate recycling provided potential evidence that cell envelope remodeling occurred after the mid-exponential phase. At the later fermentation stages, potentially functional metabolite produced by glycine was highly accumulated in the intracellular environment. Additionally, potential toxic metabolites produced by phenylalanine and tyrosine could not be excreted into the extracellular environment in a timely basis. The accumulation of large amounts of these metabolites might be the primary cause of the overconsumption of amino acids and influence the growth of S. thermophilus.
Keywords: Streptococcus thermophilus; extracellular metabolite; intracellular metabolite; metabolic pathway; pH-controlled batch fermentations.
Copyright © 2020 Qiao, Liu, Lv, Fan, Zhang, Meng, Ai and Feng.
Figures
References
-
- Ai Z. W., Lv X. P., Huang S., Liu G. F., Sun X. M., Chen H. Y., et al. (2017). The effect of controlled and uncontrolled pH cultures on the growth of Lactobacillus delbrueckii subsp. Bulgaricus. LWT 77 269–275. 10.1016/j.lwt.2016.11.057 - DOI
-
- Arioli S., Monnet C., Guglielmetti S., Parini C., De Noni I., Hogenboom J., et al. (2007). Aspartate biosynthesis is essential for the growth of Streptococcus thermophilus in milk, and aspartate availability modulates the level of urease activity. Appl. Environ. Microbiol. 73 5789–5796. 10.1128/AEM.00533-07 - DOI - PMC - PubMed
-
- Beloqui A., Pita M., Polaina J., Martinez-Arias A., Golyshina O. V., Zumarraga M., et al. (2006). Novel polyphenol oxidase mined from a metagenome expression library of bovine rumen: biochemical properties, structural analysis, and phylogenetic relationships. J. Biol. Chem. 281 22933–22942. 10.1074/jbc.M600577200 - DOI - PubMed
LinkOut - more resources
Full Text Sources