. 2020 Jan 22:10:3146.
doi: 10.3389/fmicb.2019.03146. eCollection 2019.

Comparative Analysis of Lactobacillus gasseri and Lactobacillus crispatus Isolated From Human Urogenital and Gastrointestinal Tracts

Affiliations

Comparative Analysis of Lactobacillus gasseri and Lactobacillus crispatus Isolated From Human Urogenital and Gastrointestinal Tracts

Meichen Pan et al. Front Microbiol. .

Abstract

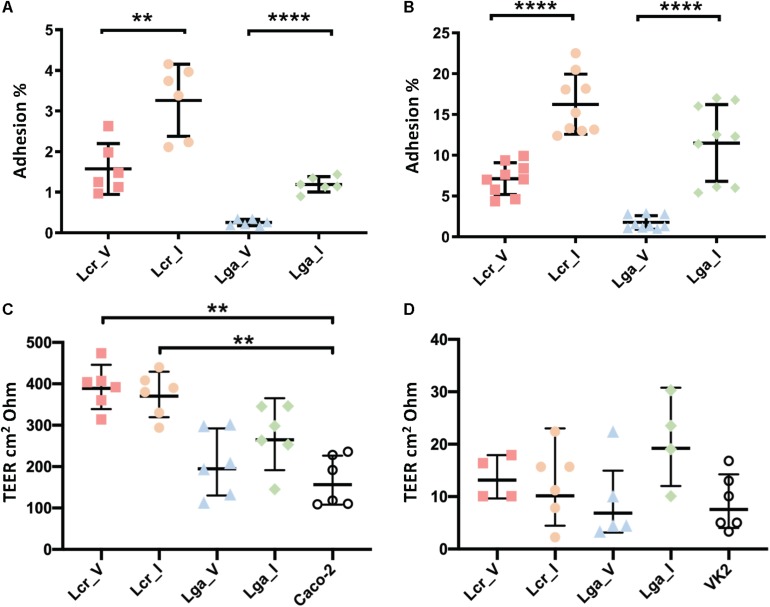
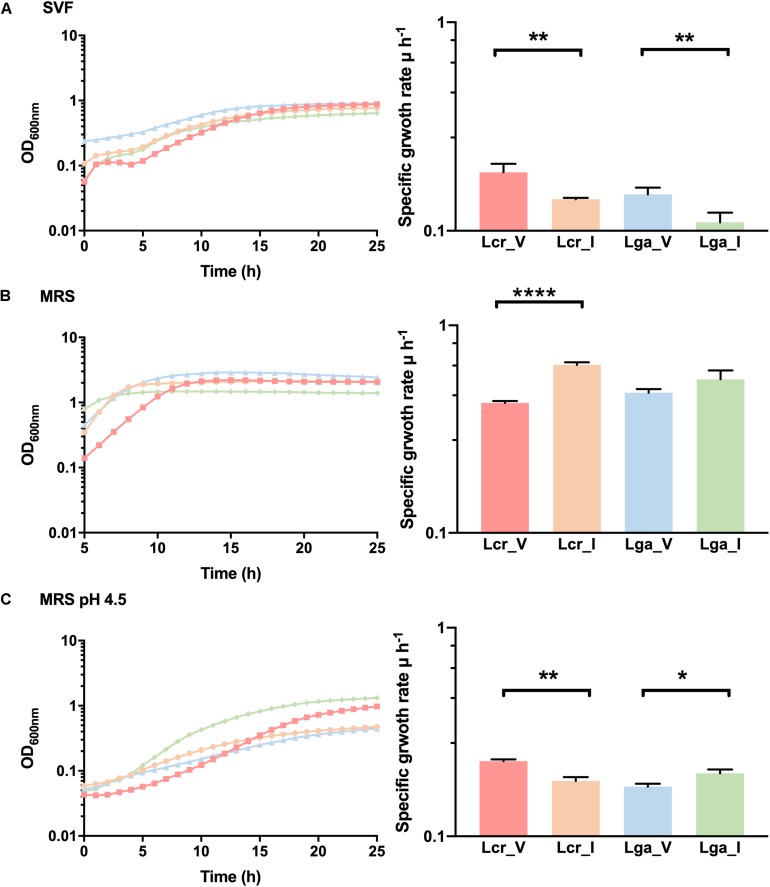
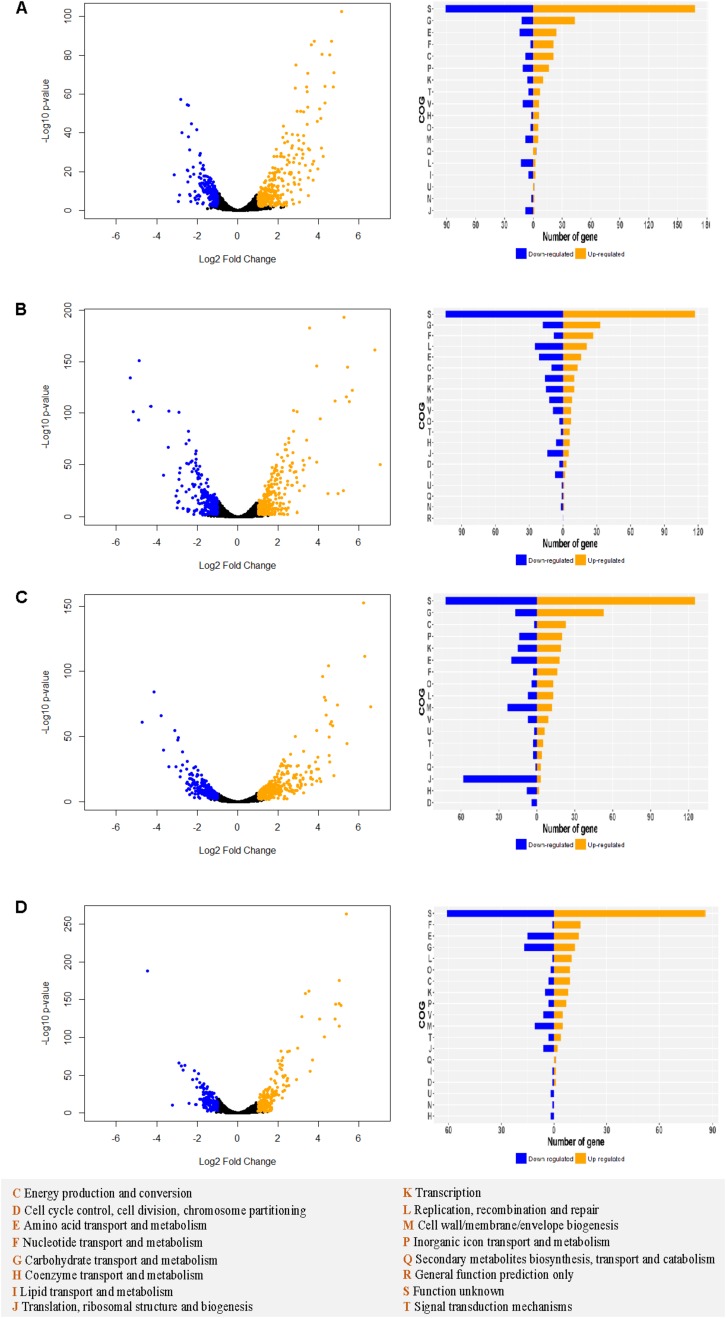
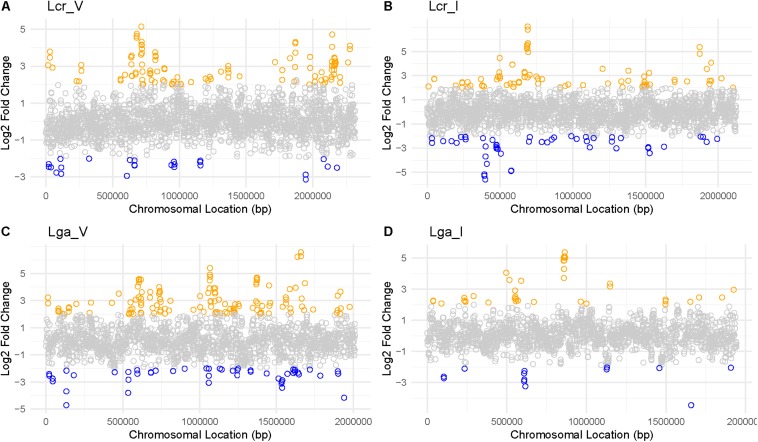
Lactobacillus crispatus and Lactobacillus gasseri are two of the main Lactobacillus species found in the healthy vaginal microbiome and have also previously been identified and isolated from the human gastrointestinal (GI) tract. These two ecological niches are fundamentally different, notably with regards to the epithelial cell type, nutrient availability, environmental conditions, pH, and microbiome composition. Given the dramatic differences between these two environments, we characterized strains within the same Lactobacillus species isolated from either the vaginal or intestinal tract to assess whether they are phenotypically and genetically different. We compared the genomes of the Lactobacillus strains selected in this study for genetic features of interest, and performed a series of comparative phenotypic assays including small intestinal juice and acid resistance, carbohydrate fermentation profiles, lactic acid production, and host interaction with intestinal Caco-2 and vaginal VK2 cell lines. We also developed a simulated vaginal fluid (SVF) to study bacterial growth in a proxy vaginal environment and conducted differential transcriptomic analysis between SVF and standard laboratory MRS medium. Overall, our results show that although strain-specific variation is observed, some phenotypic differences seem associated with the isolation source. We encourage future probiotic formulation to include isolation source and take into consideration genetic and phenotypic features for use at various body sites.

Keywords: Lactobacillus; in vitro vaginal fluid model; niche-specific adaptation; probiotics; women’s health.


Figures

FIGURE 1
FIGURE 1
Comparative genomic analysis of Lactobacillus strains. Genome comparison between strains in Lactobacillus crispatus or Lactobacillus gasseri revealed unique and common genes within each species (A). The EPS cluster genes were identified in each genome except Lcr_V (B). The prophage regions were identified, and the general gene function was annotated (C). The CRISPR-Cas system was identified in each genome (D).
FIGURE 2
FIGURE 2
Stress challenges of the Lactobacillus strains. Survival of Lactobacillus strains in the small intestinal juice (A,B). The L. crispatus (A) and L. gasseri (B) strains at stationary phase were challenged in the small intestinal juice for 4 h at 37°C under anaerobic condition. Survival of Lactobacillus strains exposed to acidified MRS broth (pH 4) with HCl at log phase (C) or stationary phase (D), and survival of Lactobacillus strains exposed to acidified MRS (pH4) at log phase (E) or stationary phase (F). The bacteria were incubated at 37°C anaerobically and sampled at 0, 2, 4, and 18 h. The data represents the means ± standard deviation of the means for three independent biological replicates. The survival rate within each species at each time point was compared for significant differences using t-test. ∗p-value < 0.05, ∗∗p-value < 0.01.
FIGURE 3
FIGURE 3
Heatmap of carbohydrate metabolism of Lactobacillus strains. The carbohydrate metabolism abilities of the Lactobacillus strains were evaluated using API test. Hierarchical clustering was performed based on both strains and type of carbohydrates.
FIGURE 4
FIGURE 4
Growth curves of Lactobacillus strains in semi-defined medium (SDM). Lactobacillus strains were grown in SDM supplemented with 1% of glucose (A), trehalose (B), raffinose (C), maltose (D), lactose (E), and galactose (F). The corresponding sugar operon is shown below each growth curve. The data represents the mean of three biological replicates.
FIGURE 5
FIGURE 5
Interaction of Lactobacillus strains with Caco-2 and VK2 cell lines. Adherence (A,B) and barrier integrity analyses (C,D) were displayed as counts and transepithelial electrical resistance (TEER), respectively. The TEER data represents the change in TEER measurement over 24 h. The data represents the means ± standard errors for three independent biological replicates with technical replicates within each biological replicate. For the TEER test, one-way ANOVA and Tukey test were performed to see if the means were significantly different among groups. The statistical analyses were performed in R studio, v1.2.5001. ∗∗p-value < 0.01, ∗∗∗∗p-value < 0.0001.
FIGURE 6
FIGURE 6
Growth curves and mid-log growth rate of Lactobacillus strains. The growth curves were performed in simulated vaginal fluid (SVF) (A), MRS (B), and lactic acid-acidified MRS at pH 4.5 (C). The growth curves were performed in biological triplicates. The growth rate data represents the mean ± standard deviation for biological triplicates. ∗p-value < 0.05, ∗∗p-value < 0.01, ∗∗∗∗p-value < 0.0001.
FIGURE 7
FIGURE 7
Differential transcriptomic analysis in MRS vs. SVF in Lactobacillus strains. For Lcr_V (A), Lcr_I (B), Lga_V (C), and Lga_I (D), the differentially expressed genes (| Log2 fold change ratio| ≥1 and p-value < 0.01) are labeled in blue (downregulated) or orange (upregulated) on the volcano plot (left panel). The differentially expressed genes for each strain are assigned to cluster of orthologous groups (COGs) (right panel). The COGs legend is provided at the bottom of the figure.
FIGURE 8
FIGURE 8
Log2 fold change ratio mapped to each genome of Lactobacillus strains. For Lcr_V (A), Lcr_I (B), Lga_V (C), and Lga_I (D), the log2 ratio was mapped to the chromosomal location to reveal any differential gene expression hot spots. Highly differentially expressed genes (|Log2 fold change ratio| ≥2 and p-value < 0.01) were labeled in blue (downregulated) or orange (upregulated).
FIGURE 9
FIGURE 9
Upregulated genes in simulated vaginal fluid (SVF) across four Lactobacillus strains. The Venn diagram presentation of the differentially upregulated genes in SVF (Log2 fold change ratio ≥1 and p-value < 0.01) of each strain based on protein ortholog search.

References

    1. Anderson D. J., Marathe J., Pudney J. (2014). The structure of the human vaginal stratum corneum and its role in immune defense. Am. J. Reprod. Immunol. 71 618–623. 10.1111/aji.12230 - DOI - PMC - PubMed
    1. Armenteros J. J. A., Tsirigos K. D., Sonderby C. K., Petersen T. N., Winther O., Brunak S., et al. (2019). SignalP 5.0 improves signal peptide predictions using deep neural networks. Nat. Biotechnol. 37 ages420–ages423. 10.1038/s41587-019-0036-z - DOI - PubMed
    1. Arndt D., Grant J. R., Marcu A., Sajed T., Pon A., Liang Y., et al. (2016). PHASTER: a better, faster version of the PHAST phage search tool. Nucleic Acids Res. 44 W16–W21. 10.1093/nar/gkw387 - DOI - PMC - PubMed
    1. Arumugam M., Raes J., Pelletier E., Le Paslier D., Yamada T., Mende D. R., et al. (2011). Enterotypes of the human gut microbiome. Nature 473 174–180. 10.1038/nature09944 - DOI - PMC - PubMed
    1. Blaskewicz C. D., Pudney J., Anderson D. J. (2011). Structure and function of intercellular junctions in human cervical and vaginal mucosal epithelia. Biol. Reprod. 85 97–104. 10.1095/biolreprod.110.090423 - DOI - PMC - PubMed

LinkOut - more resources