. 2017:17:11107-11133.
doi: 10.5194/acp-17-11107-2017.

Semivolatile POA and parameterized total combustion SOA in CMAQv5.2: impacts on source strength and partitioning

Affiliations

Semivolatile POA and parameterized total combustion SOA in CMAQv5.2: impacts on source strength and partitioning

Benjamin N Murphy et al. Atmos Chem Phys. 2017.

Abstract

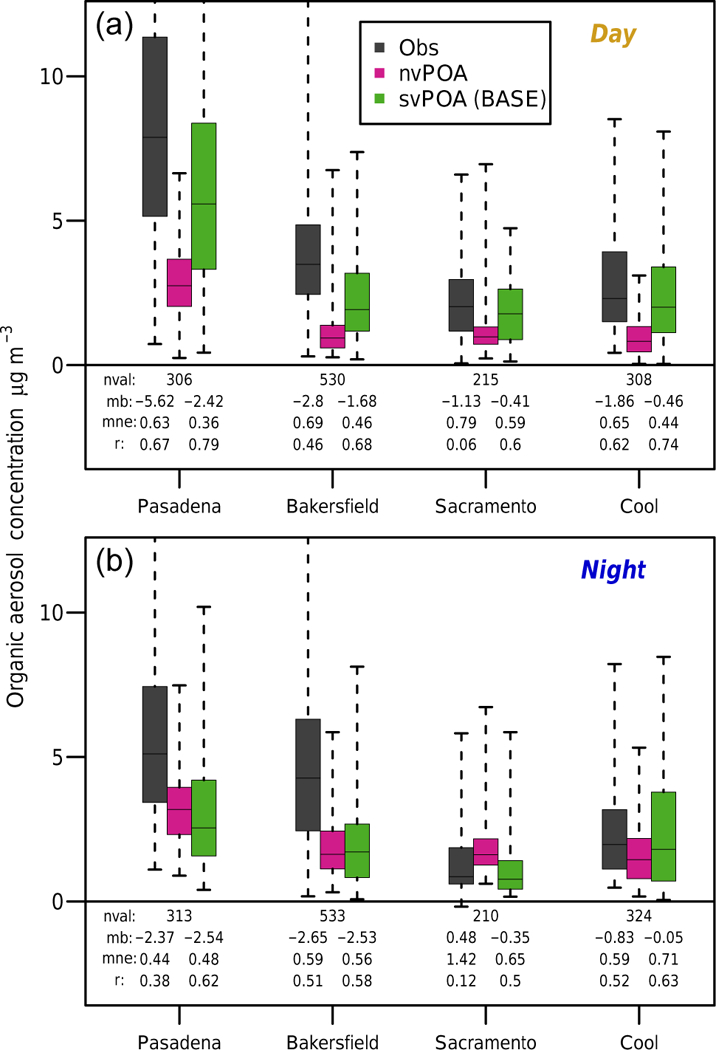
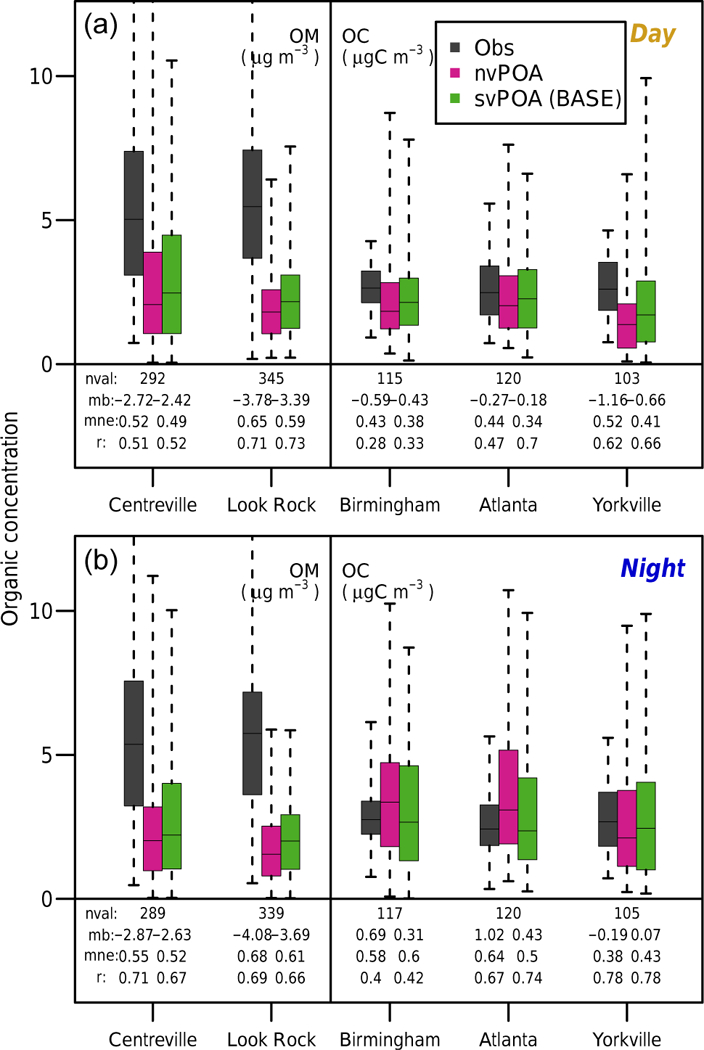
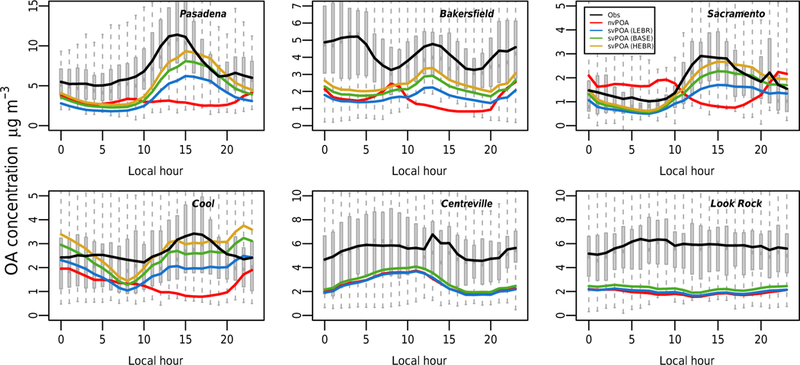
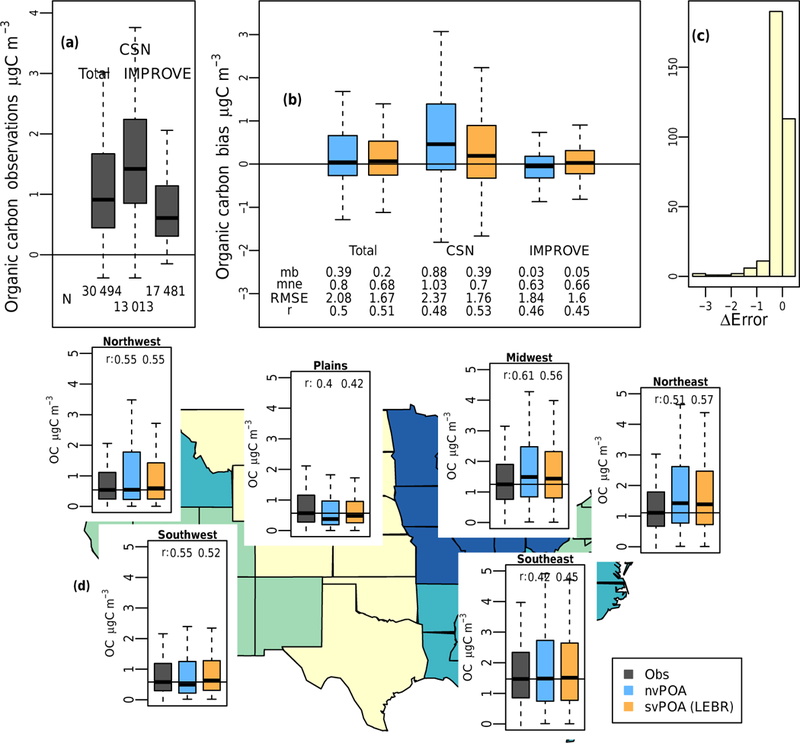
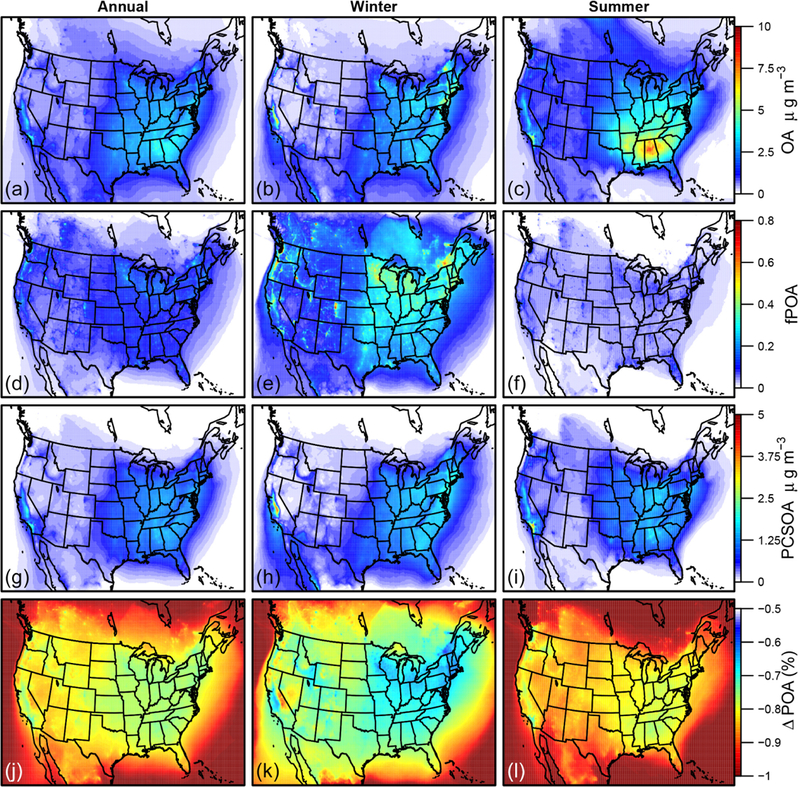
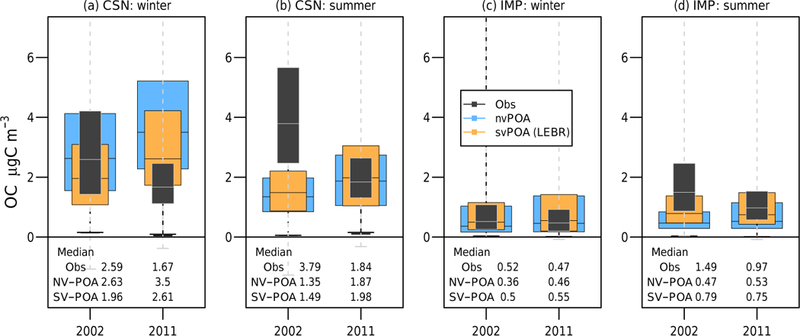
Mounting evidence from field and laboratory observations coupled with atmospheric model analyses shows that primary combustion emissions of organic compounds dynamically partition between the vapor and particulate phases, especially as near-source emissions dilute and cool to ambient conditions. The most recent version of the Community Multiscale Air Quality model version 5.2 (CMAQv5.2) accounts for the semivolatile partitioning and gas-phase aging of these primary organic aerosol (POA) compounds consistent with experimentally derived parameterizations. We also include a new surrogate species, potential secondary organic aerosol from combustion emissions (pcSOA), which provides a representation of the secondary organic aerosol (SOA) from anthropogenic combustion sources that could be missing from current chemical transport model predictions. The reasons for this missing mass likely include the following: (1) unspeciated semivolatile and intermediate volatility organic compound (SVOC and IVOC, respectively) emissions missing from current inventories, (2) multigenerational aging of organic vapor products from known SOA precursors (e.g., toluene, alkanes), (3) underestimation of SOA yields due to vapor wall losses in smog chamber experiments, and (4) reversible organic compounds-water interactions and/or aqueous-phase processing of known organic vapor emissions. CMAQ predicts the spatially averaged contribution of pcSOA to OA surface concentrations in the continental United States to be 38.6 and 23.6 % in the 2011 winter and summer, respectively. Whereas many past modeling studies focused on a particular measurement campaign, season, location, or model configuration, we endeavor to evaluate the model and important uncertain parameters with a comprehensive set of United States-based model runs using multiple horizontal scales (4 and 12 km), gas-phase chemical mechanisms, and seasons and years. The model with representation of semivolatile POA improves predictions of hourly OA observations over the traditional nonvolatile model at sites during field campaigns in southern California (CalNex, May-June 2010), northern California (CARES, June 2010), the southeast US (SOAS, June 2013; SEARCH, January and July, 2011). Model improvements manifest better correlations (e.g., the correlation coefficient at Pasadena at night increases from 0.38 to 0.62) and reductions in underprediction during the photochemically active afternoon period (e.g., bias at Pasadena from -5.62 to -2.42 μg m-3). Daily averaged predictions of observations at routine-monitoring networks from simulations over the continental US (CONUS) in 2011 show modest improvement during winter, with mean biases reducing from 1.14 to 0.73μg m-3, but less change in the summer when the decreases from POA evaporation were similar to the magnitude of added SOA mass. Because the model-performance improvement realized by including the relatively simple pcSOA approach is similar to that of more-complicated parameterizations of OA formation and aging, we recommend caution when applying these more-complicated approaches as they currently rely on numerous uncertain parameters. The pcSOA parameters optimized for performance at the southern and northern California sites lead to higher OA formation than is observed in the CONUS evaluation. This may be due to any of the following: variations in real pcSOA in different regions or time periods, too-high concentrations of other OA sources in the model that are important over the larger domain, or other model issues such as loss processes. This discrepancy is likely regionally and temporally dependent and driven by interferences from factors like varying emissions and chemical regimes.


Conflict of interest statement

Competing interests. The authors declare that they have no conflict of interest.

Figures

Figure 1.
Figure 1.
Organic aerosol concentrations (μg m−3) observed (gray) with the HR-ToF-AMS at sites in California in 2010 (Pasadena, Bakersfield, Sacramento, and Cool). Also shown are the model-predicted distributions at each site using the nonvolatile (pink) and base-case semivolatile (green) configurations. The boxes denote the 25th and 75th percentiles of each dataset, while the whiskers extend to the most extreme points. (a) and (b) show data for daytime (08:00–20:00 LT) and nighttime hours, respectively. Model values are projected to PM1 to correspond roughly to the size cutoff of the AMS.
Figure 2.
Figure 2.
Observed (gray) and modeled (pink, green) organic aerosol (μg m−3) and organic carbon (μgC m−3) concentrations at sites in the southeast US. OA concentrations at the SOAS sites, Centreville and Look Rock, were measured with HR-ToF-AMS, while OC concentrations at the SEARCH sites, Birmingham, Atlanta, and Yorkville were inferred as the difference between total carbon measured by ambient particulate carbon monitors and elemental carbon measured by aethalometers. Also shown are the model-predicted distributions at each site using the nonvolatile (pink) and base-case semivolatile (green) configurations. The boxes denote the 25th and 75th percentiles of each dataset, while the whiskers extend to the most extreme points. (a) and (b) show data for daytime (08:00–20:00) and nighttime hours, respectively. Model values for the SOAS sites are projected to PM1 to correspond roughly to the size cutoff of the AMS, while for the SEARCH sites the sum of the Aitken and accumulation modes was applied. All model data are produced from the EUS simulation, which uses SAPRC07tic and occurs during June 2013.
Figure 3.
Figure 3.
Comparison of OA factors derived from positive matrix factorization (PMF) of HR-ToF-AMS observations (gray) at sites in California (Pasadena, Bakersfield, and Cool). Also shown are the model-predicted concentrations of each factor at each site using the nonvolatile (pink) and base-case semivolatile (green) configurations. (a) compares estimations for hydrocarbon-like OA (HOA) and (b) for oxygenated OA (OOA). The boxes denote the 25th and 75th percentiles of each dataset, while the whiskers extend to the most extreme points.
Figure 4.
Figure 4.
OOA concentrations (μg m−3) at California sites as a function of the measured Ox (O3 + NO2) concentration. A background concentration, Ox (BG), of 13.5 ppbv is assumed, consistent with Hayes et al. (2015). The boxes behind each trend indicate the 25th and 75th percentiles of the data. The whiskers extend to the 10th and 90th percentiles. The solid horizontal lines in each box identify the median, and the solid curves indicate the means of each model run. Model values are projected to PM1 to correspond roughly to the size cutoff of the AMS.
Figure 5.
Figure 5.
Diurnal OA concentration profile (μg m−3) observed (black line, gray bars) with the HR-ToF-AMS at sites investigated during the CalNex, CARES, and SOAS campaigns. Also shown are the model-predicted distributions for the nvPOA case, the BASE case, and two sensitivity cases (LEBR and HEBR). The boxes behind each trend indicate the 25th and 75th percentiles of the data. The whiskers extend to the 10th and 90th percentiles. The solid horizontal lines in each box identify the median, and the solid curves indicate the means of each model run. Model values are projected to PM1 to correspond roughly to the size cutoff of the AMS.
Figure 6.
Figure 6.
Evaluation of the effect of uncertain parameters for pcSOA formation, emission factor, and OH reaction rate constant for the CAL domain. The normalized mean bias factor (NMBF) and normalized mean error factor (NMEF) symmetrically represent both under- and overprediction.
Figure 7.
Figure 7.
Evaluation of the effect of uncertain parameters for pcSOA formation, emission factor, and OH reaction rate constant against OC measurements from IMPROVE and CSN networks. Data from January and July only of the CONUS11 simulations were used for this analysis.
Figure 8.
Figure 8.
Continent-wide organic carbon (OC) evaluation of the nvPOA case and the best-performing sensitivity case (LEBR) against routine-monitoring data from IMPROVE and CSN sites for an annual simulation during 2011. (a) Distribution of OC observations from both networks individually and combined. (b) Distributions of OC bias for each network and combined. (c) Histogram of error changes from the nvPOA to the svPOA (LEBR) case at specific stations aggregated throughout the year. (d) Regional distribution of OC observations and predictions throughout the annual simulation
Figure 9.
Figure 9.
Monthly model performance for the nvPOA (blue) and LEBR (orange) cases throughout the 2011 simulation. The top panel indicates the mean OC bias, while the bottom panel indicates the correlation coefficient of each model run with the CSN and IMPROVE observations.
Figure 10.
Figure 10.
Regional and seasonal model performance at routine-monitoring stations for the CONUS11 simulation as a function of the normalized mean bias factor (NMBF) and normalized mean error factor (NMEF) for OC predictions. Plotted regions include the northeast (NE), Midwest (MW), southeast (SE), Plains (PL), northwest (NW), southwest (SW), and total (T) and are defined as visualized in Fig. 8.
Figure 11.
Figure 11.
Spatial distribution of products form the LEBR CONUS11 simulation. Products include the OA concentration (row 1), fraction of POA (row 2), pcSOA concentration (row 3), and change in model-predicted POA from the nonvolatile POA model to the semivolatile POA model (row 4). Maps illustrate the median of all annual surface data (a, d, g, j), winter months (December, January, February; b, e, h, k), and summer months (June, July, August; c, f, i, l).
Figure 12.
Figure 12.
Organic carbon (OC) distributions for routine-monitoring stations and model predictions at the same locations and times. The meaning of the boxes and whiskers is explained in Fig. 5.
Figure 13.
Figure 13.
Organic carbon bias for CSN summer time data during 2002 and 2011 (combined) as a function of observed sulfate concentrations (a) and observed NOx concentrations (b). The meaning of boxes and whiskers is explained in Fig. 5. Blue (2011) and black (2002) solid lines quantify the number of data points for each year as functions of the observed pollutants.

References

    1. Ahmadov R, McKeen SA, Robinson AL, Bahreini R, Mid- dlebrook AM, de Gouw JA, Meagher J, Hsie EY, Edgerton E, Shaw S, and Trainer M: A volatility basis set model for summertime secondary organic aerosols over the eastern United States in 2006, J. Geophys. Res.-Atmos., 117, D06301, 10.1029/2011JD016831, 2012. - DOI
    1. Aiken AC, Decarlo PF, Kroll JH, Worsnop DR, Huffman JA, Docherty KS, Ulbrich IM, Mohr C, Kimmel JR, and Sueper D: O/C and OM/OC ratios of primary, secondary, and ambient organic aerosols with high-resolution time-of-flight aerosol mass spectrometry, Environ. Sci. Technol, 42, 4478–4485, 2008. - PubMed
    1. Appel KW, Napelenok SL, Foley KM, Pye HOT, Hogrefe C, Luecken DJ, Bash JO, Roselle SJ, Pleim JE, Foroutan H, Hutzell WT, Pouliot GA, Sarwar G, Fahey KM, Gantt B, Gilliam RC, Heath NK, Kang D, Mathur R, Schwede DB, Spero TL, Wong DC, and Young JO: Description and evaluation of the Community Multiscale Air Quality (CMAQ) modeling system version 5.1, Geosci. Model Dev, 10, 1703–1732, 10.5194/gmd-10-1703-2017, 2017. - DOI - PMC - PubMed
    1. Bahreini R, Middlebrook A, Gouw J. d., Warneke C, Trainer M, Brock C, Stark H, Brown S, Dube W, and Gilman J: Gasoline emissions dominate over diesel in formation of secondary organic aerosol mass, Geophys. Res. Lett, 39, L06805, 10.1029/2011GL050718, 2012. - DOI
    1. Baker KR, Misenis C, Obland MD, Ferrare RA, Scarino AJ, and Kelly JT: Evaluation of surface and upper air fine scale WRF meteorological modeling of the May and June 2010 CalNex period in California, Atmos. Environ., 80, 299–309, 10.1016/j.atmosenv.2013.08.006, 2013. - DOI