Review
. 2021 Mar;53(3):686-702.
doi: 10.1002/jmri.27070. Epub 2020 Feb 10.

Fast Imaging for Hyperpolarized MR Metabolic Imaging

Affiliations
Review

Fast Imaging for Hyperpolarized MR Metabolic Imaging

Jeremy W Gordon et al. J Magn Reson Imaging. 2021 Mar.

Abstract

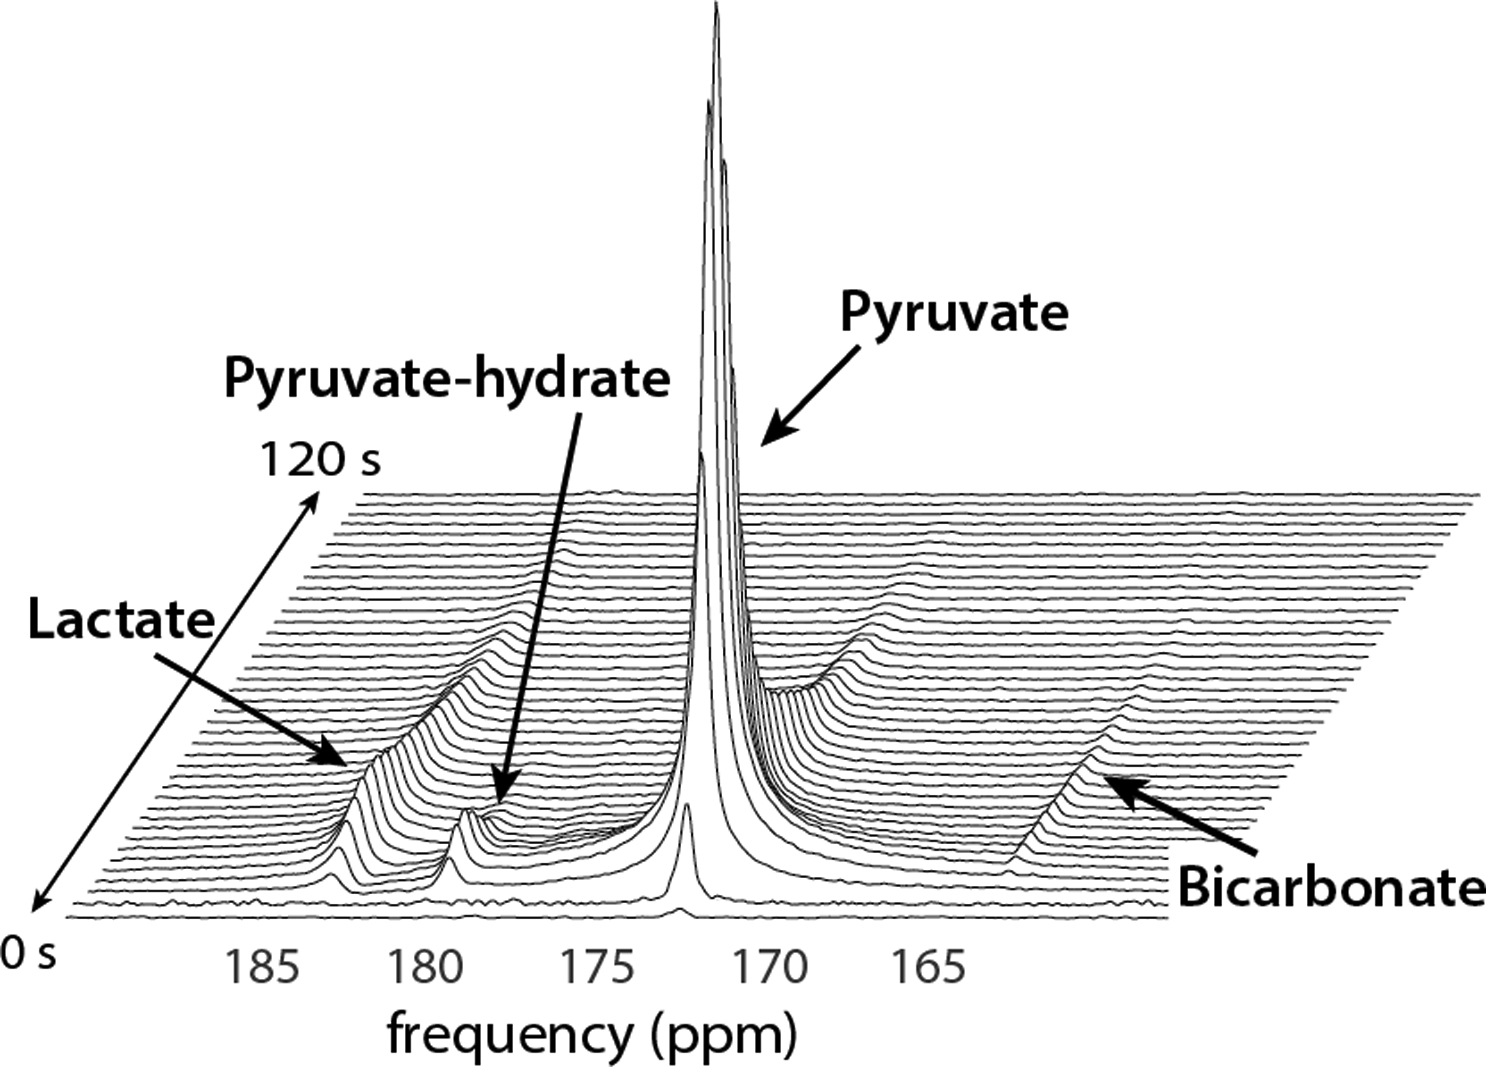
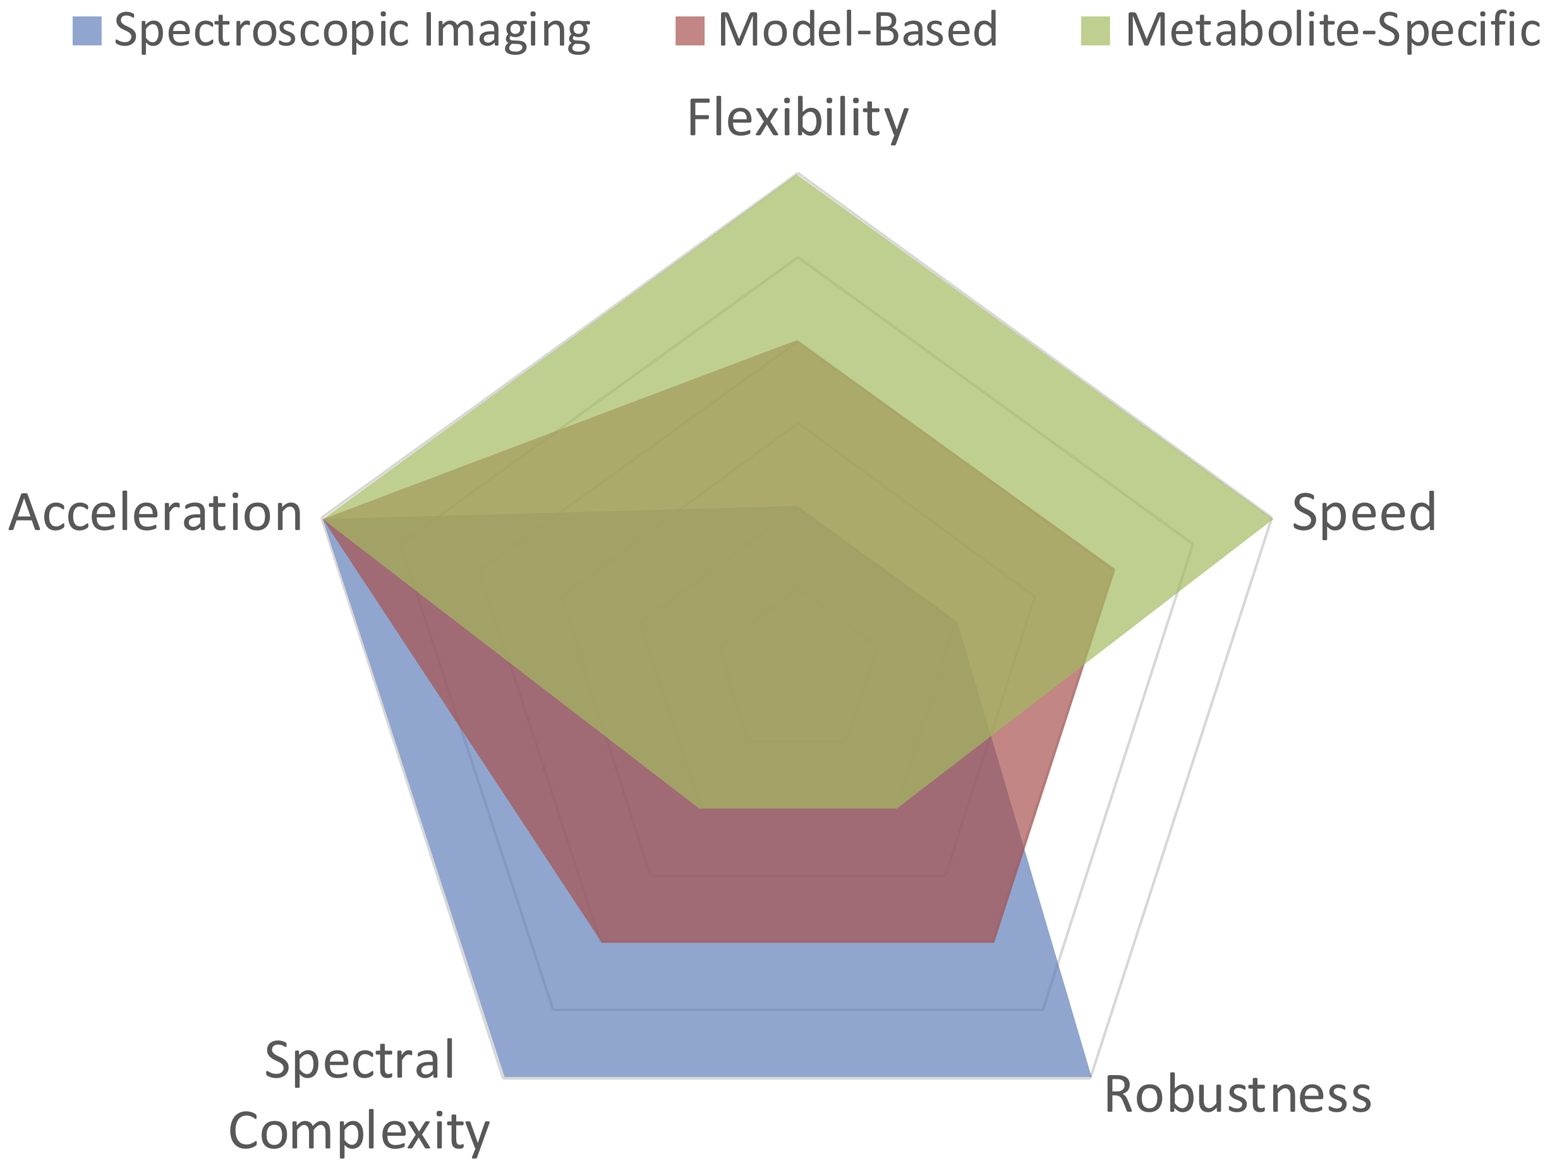
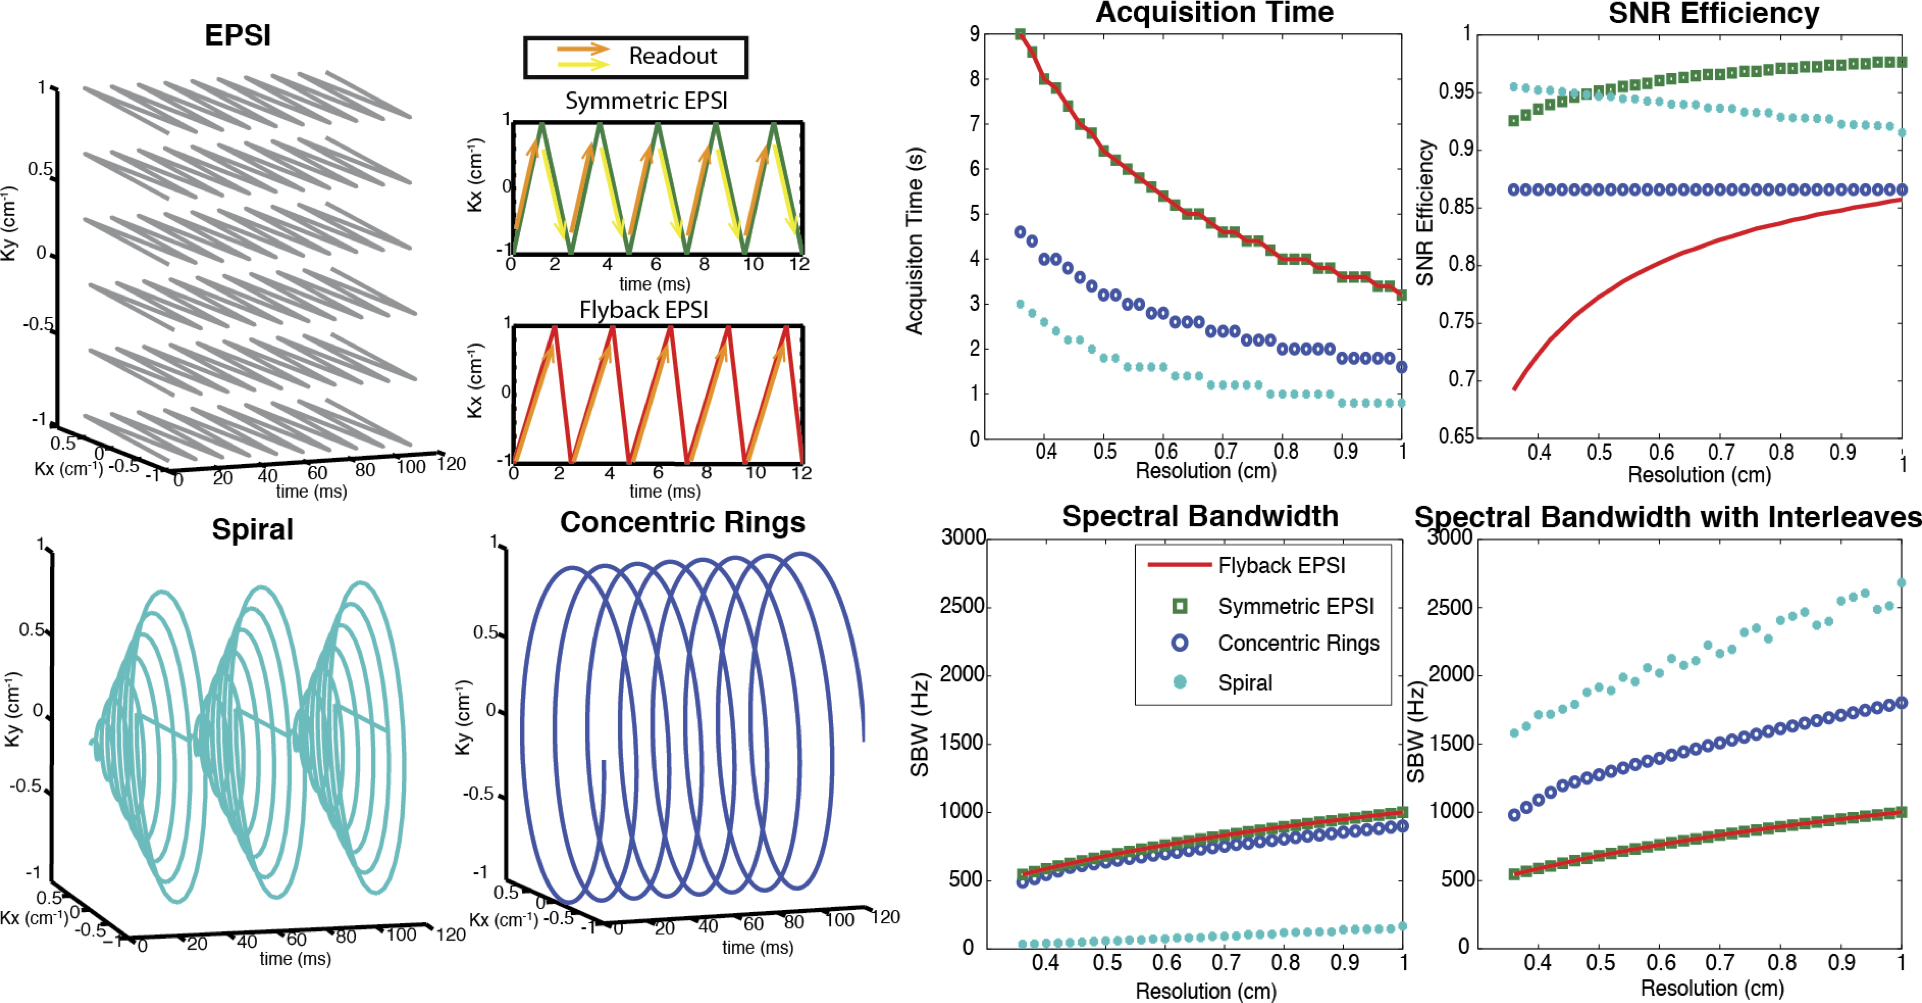
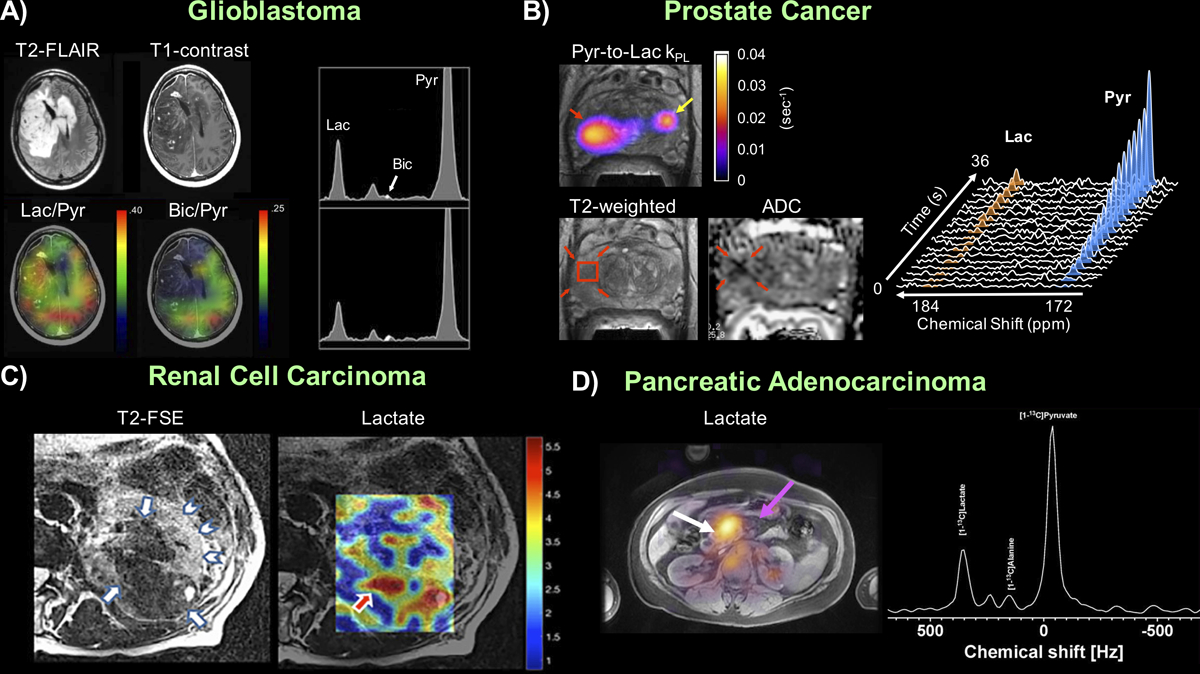
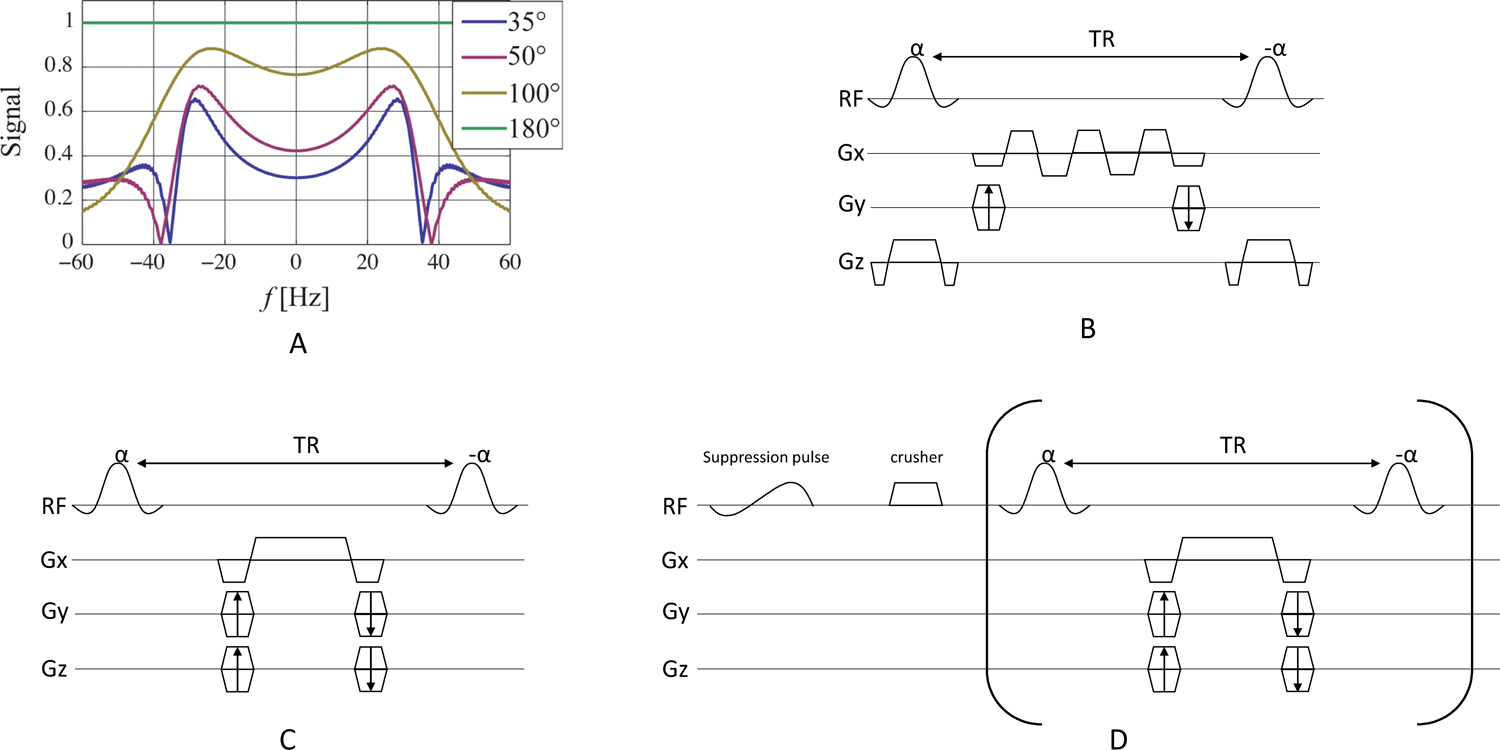
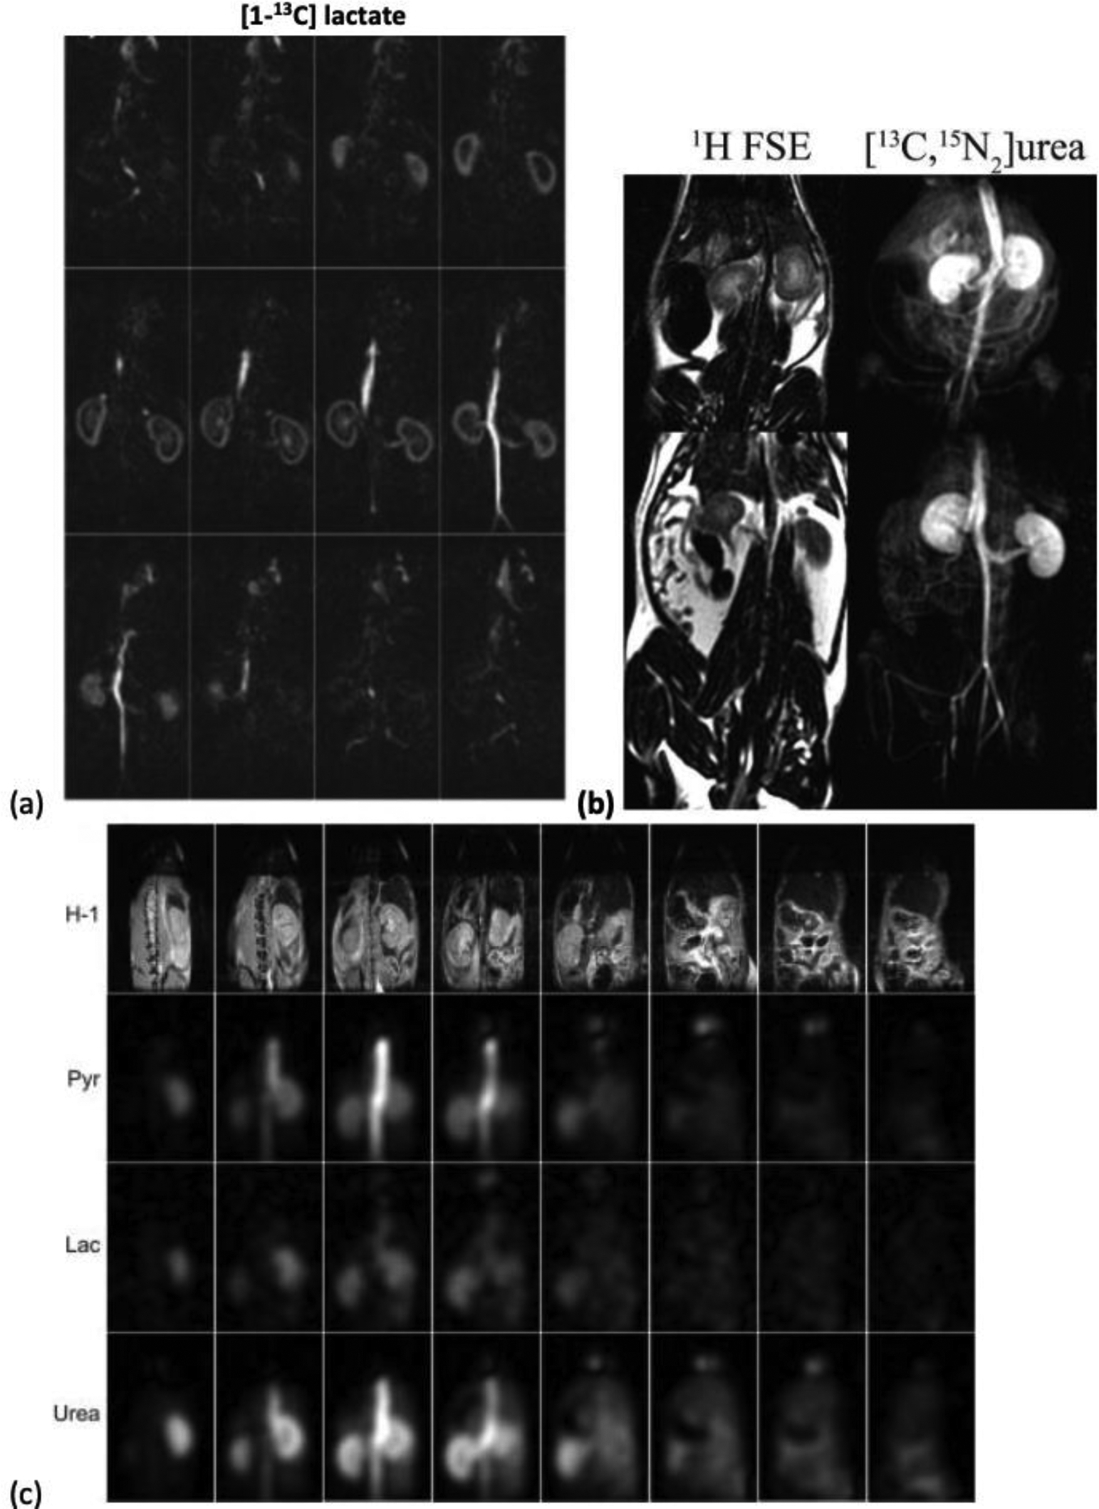
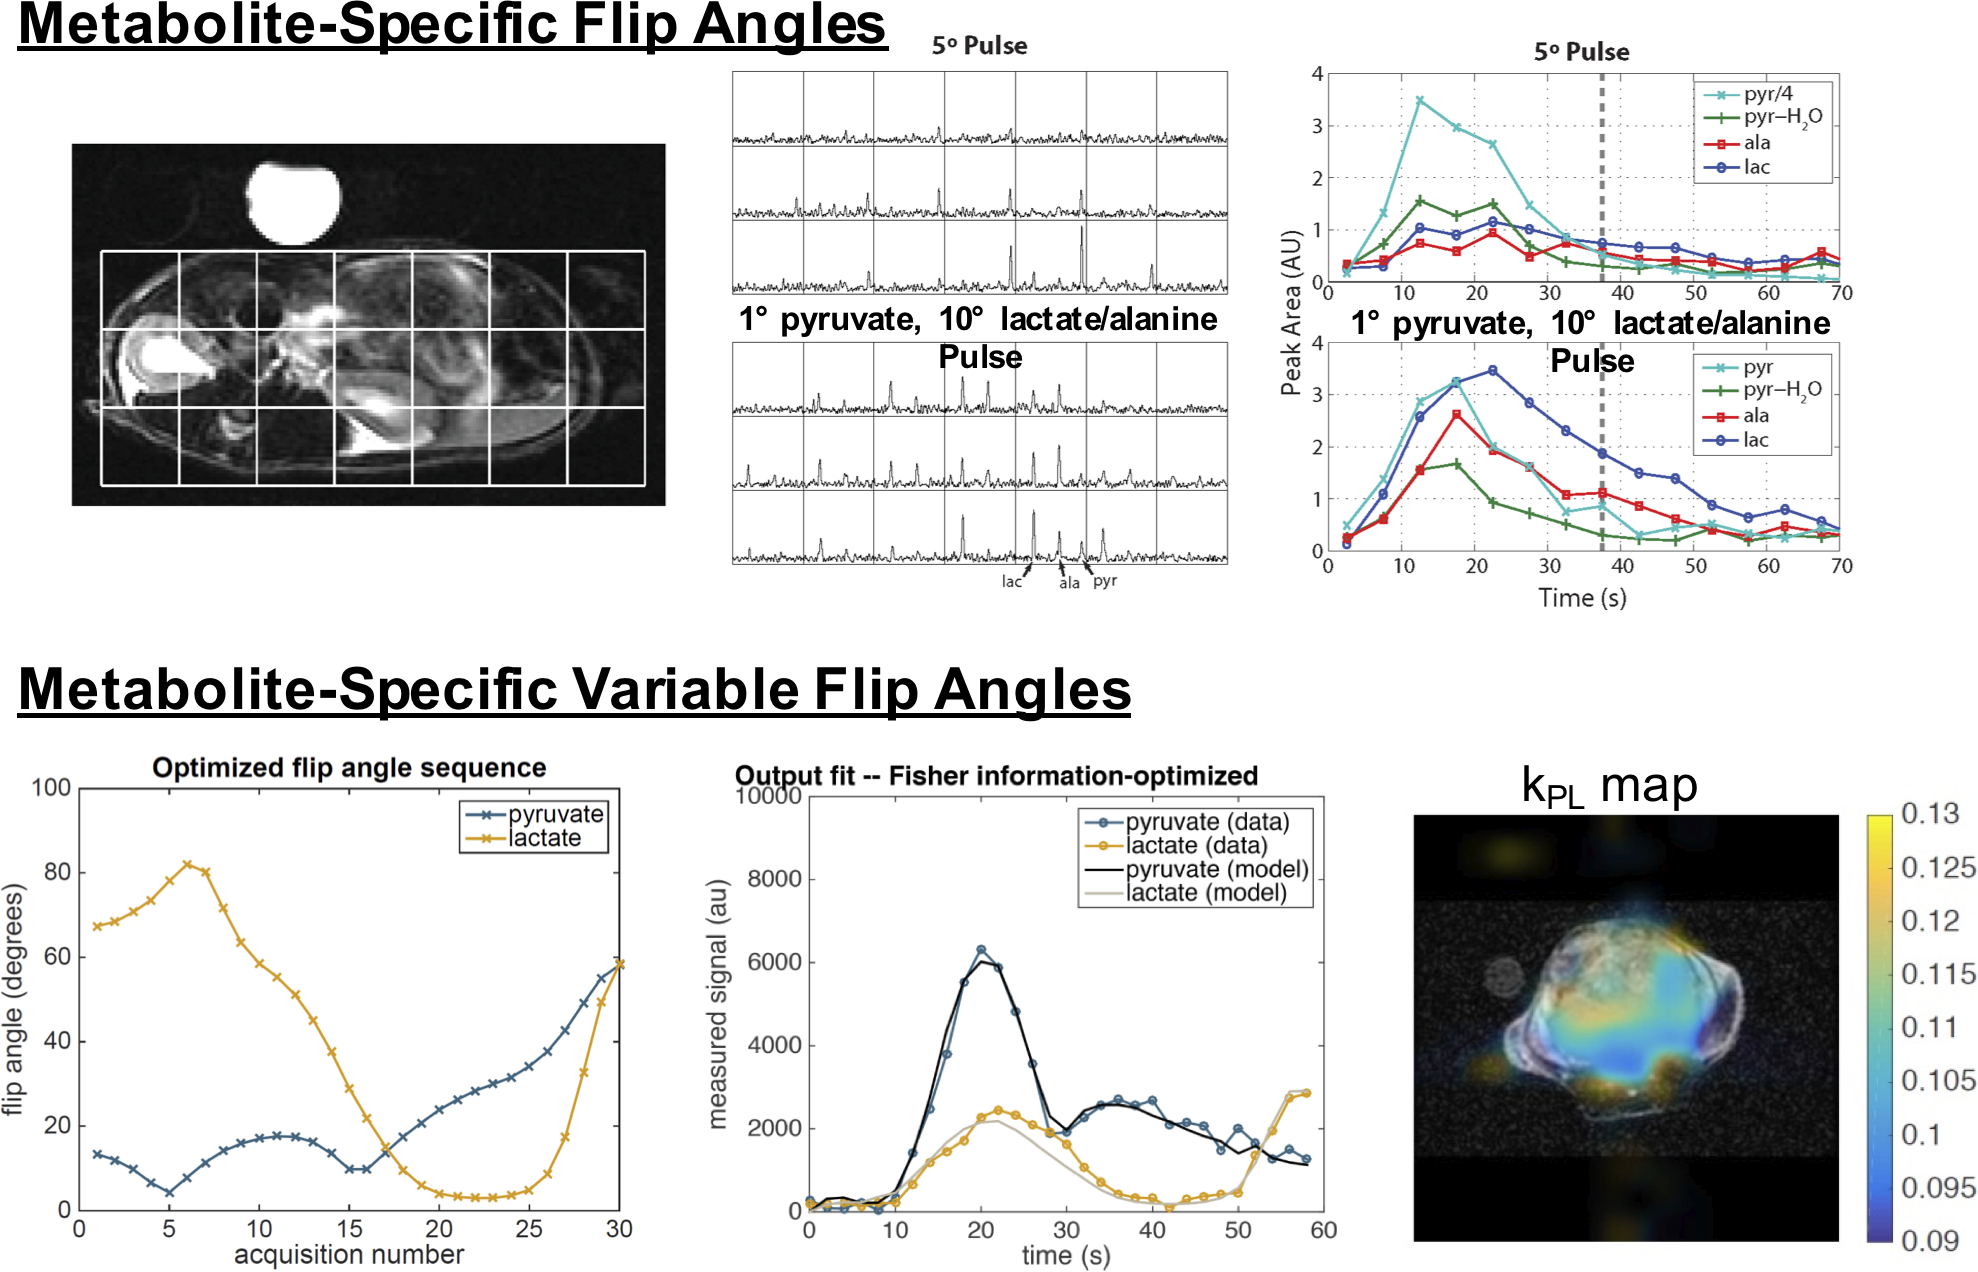
MRI with hyperpolarized carbon-13 agents has created a new type of noninvasive, in vivo metabolic imaging that can be applied in cell, animal, and human studies. The use of 13 C-labeled agents, primarily [1-13 C]pyruvate, enables monitoring of key metabolic pathways with the ability to image substrate and products based on their chemical shift. Over 10 sites worldwide are now performing human studies with this new approach for studies of cancer, heart disease, liver disease, and kidney disease. Hyperpolarized metabolic imaging studies must be performed within several minutes following creation of the hyperpolarized agent due to irreversible decay of the net magnetization back to equilibrium, so fast imaging methods are critical. The imaging methods must include multiple metabolites, separated based on their chemical shift, which are also undergoing rapid metabolic conversion (via label exchange), further exacerbating the challenges of fast imaging. This review describes the state-of-the-art in fast imaging methods for hyperpolarized metabolic imaging. This includes the approach and tradeoffs between three major categories of fast imaging methods-fast spectroscopic imaging, model-based strategies, and metabolite specific imaging-as well additional options of parallel imaging, compressed sensing, tailored RF flip angles, refocused imaging methods, and calibration methods that can improve the scan coverage, speed, signal-to-noise ratio (SNR), resolution, and/or robustness of these studies. To date, these approaches have produced extremely promising initial human imaging results. Improvements to fast hyperpolarized metabolic imaging methods will provide better coverage, SNR, resolution, and reproducibility for future human imaging studies. LEVEL OF EVIDENCE: 5 TECHNICAL EFFICACY STAGE: 1.

Keywords: chemical shift encoding; hyperpolarized carbon-13; metabolic imaging; metabolite-specific imaging; real-time calibration; spectroscopic imaging.


Figures

Figure 1:
Figure 1:
Representative dynamic HP-13C spectra illustrates the metabolic conversion of the injected substrate ([1-13C]pyruvate) into products of interest ([1-13C]lactate, [13C]bicarbonate, and [1-13C]pyruvate-hydrate) in the human brain. Conversion to alanine is also observable within the timescale of the experiment in other organs. Their temporal profiles reflect the rapid enzymatic conversion of pyruvate throughout the timeframe of HP-13C studies. Figure adapted from Ref. (33).
Figure 2:
Figure 2:
Overview of the main categories of fast hyperpolarized metabolic imaging methods and their corresponding advantages and disadvantages. Acceleration refers to compatibility with compressed sensing/parallel imaging; Flexibility refers to the available acquisition and tailored flip angle schemes; Speed refers to acquisition time; Robustness refers to sensitivity to bulk frequency errors and B0 inhomogeneity; Spectral complexity refers to compatibility with substrates that have complicated spectra (i.e. numerous resonances, poor spectral separation, j-coupling, etc.). The tradeoffs between the categories are described in greater detail in Table 1 as well as throughout the text.
Figure 3:
Figure 3:
Illustration and comparison of several rapid MRSI methods employing switched/time-dependent read-out gradients. Left two columns: k-space trajectories for EPSI (symmetric and flyback), spiral and concentric rings spectroscopic imaging. Right two columns: Design tradeoffs between spatial resolution, spectral bandwidth, acquisition time, and SNR efficiency, assuming typical clinical MRI system gradients with a maximum amplitude of 40 mT/m and maximum slew rate of 150 mT/m/ms. EPSI is the slowest, but symmetric EPSI trajectories have very high SNR efficiency. The concentric rings method requires half of the total acquisition time compared with the EPSI trajectories, offers about 87% SNR efficiency, and provides much wider spectral bandwidth than either flyback or symmetric EPSI. Although spirals are nominally the most efficient trajectories (offering the fastest acquisition time and highest spectral bandwidth while sacrificing the least SNR), they are limited by their sensitivity to gradient infidelities. (Adapted from Ref (25)).
Figure 4:
Figure 4:
Proof-of-concept human studies based on fast spectroscopic imaging approaches applied in (A) Brain tumor (B) Primary prostate cancer (C) Renal cell carcinoma and (D) Pancreatic cancer with example images and spectra, highlighting the ability to extract spatially-resolved information of metabolism without a priori knowledge of the product identities. Figure adapted from (33,37,39,40).
Figure 5:
Figure 5:
Schematic illustrating the acquisition and reconstruction of a model-based spiral pulse sequence. In this illustration, data is acquired with a long duration spiral readout that is spoiled at each TR. Each subsequent excitation is shifted in time by ΔTE. For non-Cartesian approaches, a matrix decomposition occurs in k-space, yielding k-space data for each metabolite. A subsequent gridding or non-uniform fast Fourier Transform (nuFFT) step yields spectral images for each hyperpolarized metabolite.
Figure 6:
Figure 6:
Graphical depiction of the SPICE acquisition. The acquisition is comprised of two stages. The first stage acquires a low-spatial resolution/high spectral bandwidth dataset (D1) with a CSI sequence. The data of this stage is used to identify the spectral signals images. The second stage acquires a high-spatial resolution/low spectral bandwidth dataset (D2) with an EPSI sequence. These two datasets are combined to generate spectroscopic images with high spatial and spectral resolution.
Figure 7:
Figure 7:
Depiction of a multi-slice metabolite-specific acquisition using EPI. The sequence provides volumetric coverage for all metabolites of interest by shifting the spectral-spatial (SPSP) passband to separately excite and encode each resonance. This is repeated through time to acquire a volumetric and dynamic dataset for all metabolites of interest. Figure adapted from (62).
Figure 8:
Figure 8:
Area under the curve (sum through time) images of pyruvate, lactate, and bicarbonate for the eight slices covering the entire brain. In this experiment, a spectral-spatial RF pulse was used to separately excite each metabolite, which was then encoded with a single-shot echoplanar readout. Artifact-free data can be acquired with rapid imaging readouts in the clinical setting, enabling volumetric coverage of the whole brain with a temporal resolution (3 s) equivalent to that of single slice EPSI. Figure adapted from Ref (64).
Figure 9:
Figure 9:
Simulated SSFP signal as a function of frequency and flip angle for TR = 14.3 ms (A). The choice of flip angle in the bSSFP sequence is a tradeoff between alleviating banding artifacts with high flip angles and preserving magnetization for dynamic imaging with lower flip angles. Pulse sequence diagrams for bSSFP, including (B) multi-echo readouts to decompose spectral information, (C) metabolite specific acquisition, and (D) metabolite specific acquisition with spectral suppression of undesired signal at the beginning of the acquisition. Portions of this figure are adapted from Ref. (73).
Figure 10:
Figure 10:
Representative bSSFP results from prior works. (a) Rat 3D kidney images of [1-13C]lactate at 3T (75) (b) Rat kidney projection image of [13C-, 15N2]urea at 3T (73). (c) 3D kidney images of co-polarized [1-13C]pyruvate and [13C, 15N2]urea at 14 T (74).
Figure 11:
Figure 11:
(top) Metabolite-specific flip angles, implemented in a MRSI acquisition using multiband spectral-spatial RF pulses, show substantial improvements over constant flip angle pulses. In this example, the multiband pulse applied a 1-degree flip angle to pyruvate (substrate) and 10-degree flip angle to the metabolic products of lactate and alanine to improve their SNR while maintaining adequate pyruvate SNR (65). (bottom) A metabolite-specific variable flip angle schedule implemented in a metabolite-specific EPI acquisition, optimized for estimation of the pyruvate to lactate conversion rate, kPL for an expected set of experimental parameters. Fitting to data acquired with metabolite-specific imaging and the resulting kPL map in a prostate tumor mouse show high quality fits (91).

References

    1. Kurhanewicz J, Vigneron DB, Brindle K, Chekmenev EY, Comment A, Cunningham CH, DeBerardinis RJ, Green GG, Leach MO, Rajan SS, Rizi RR, Ross BD, Warren WS, Malloy CR. Analysis of Cancer Metabolism by Imaging Hyperpolarized Nuclei: Prospects for Translation to Clinical Research. Neoplasia 2011;13(2):81–97. - PMC - PubMed
    1. Vander Heiden MG, Cantley LC, Thompson CB. Understanding the Warburg Effect: The Metabolic Requirements of Cell Proliferation. Science 2009;324(5930):1029–1033. - PMC - PubMed
    1. Guglielmetti C, Chou A, Krukowski K, Najac C, Feng X, Riparip L-K, Rosi S, Chaumeil MM. In vivo metabolic imaging of Traumatic Brain Injury. Scientific Reports 2017;7(1):17525. - PMC - PubMed
    1. DeVience SJ, Lu X, Proctor J, Rangghran P, Melhem ER, Gullapalli R, Fiskum GM, Mayer D. Metabolic imaging of energy metabolism in traumatic brain injury using hyperpolarized [1-(13)C]pyruvate. Scientific reports 2017;7(1):1907–1907. - PMC - PubMed
    1. Guglielmetti C, Najac C, Didonna A, Van der Linden A, Ronen SM, Chaumeil MM. Hyperpolarized 13C MR metabolic imaging can detect neuroinflammation in vivo in a multiple sclerosis murine model. Proceedings of the National Academy of Sciences 2017;114(33):E6982. - PMC - PubMed

Publication types