. 2020 Mar 2;130(3):1233-1251.
doi: 10.1172/JCI131048.

Chronic mTOR activation induces a degradative smooth muscle cell phenotype

Affiliations

Chronic mTOR activation induces a degradative smooth muscle cell phenotype

Guangxin Li et al. J Clin Invest. .

Abstract

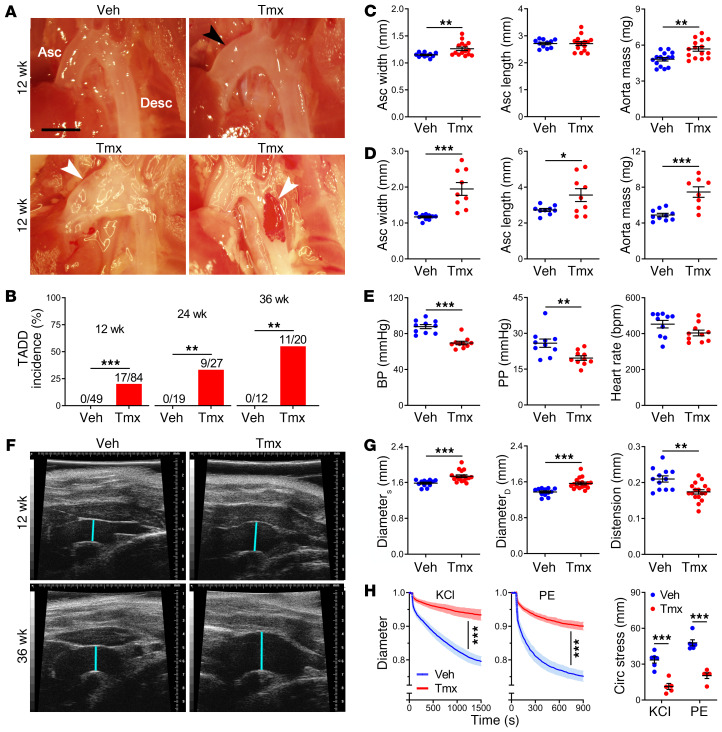
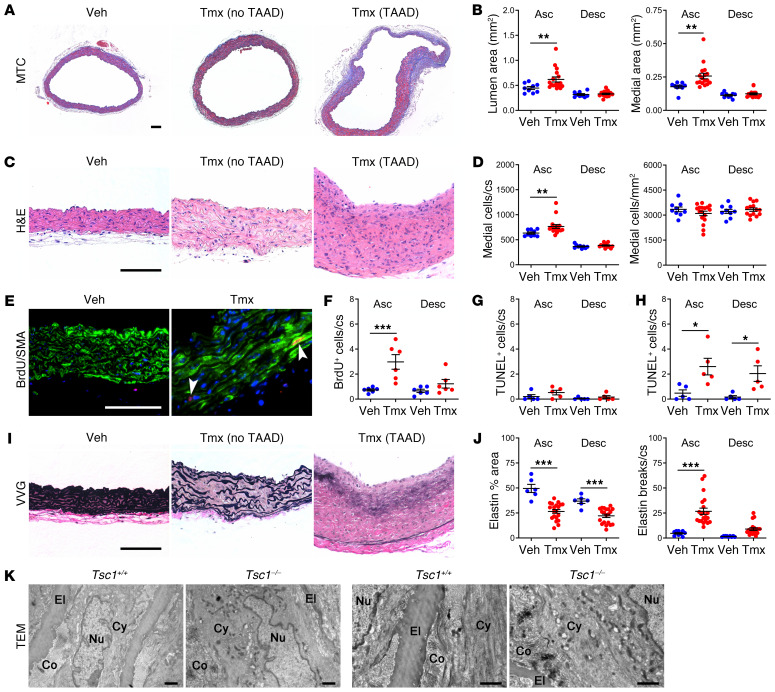
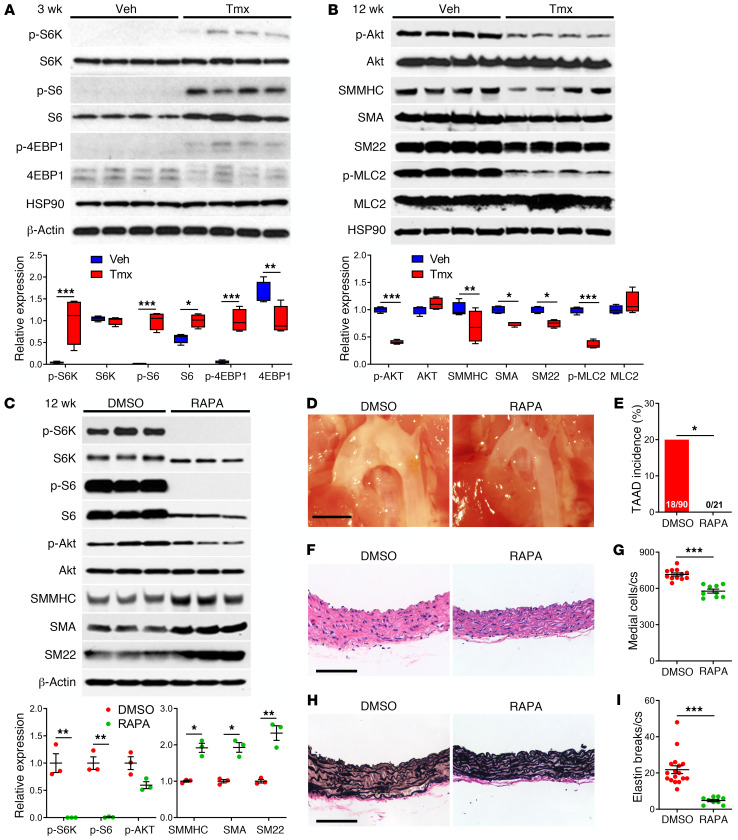
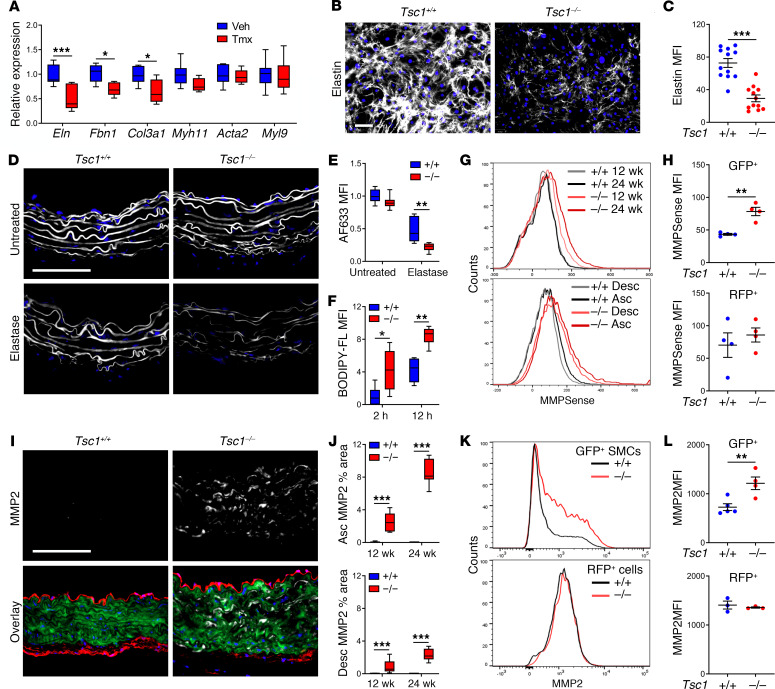
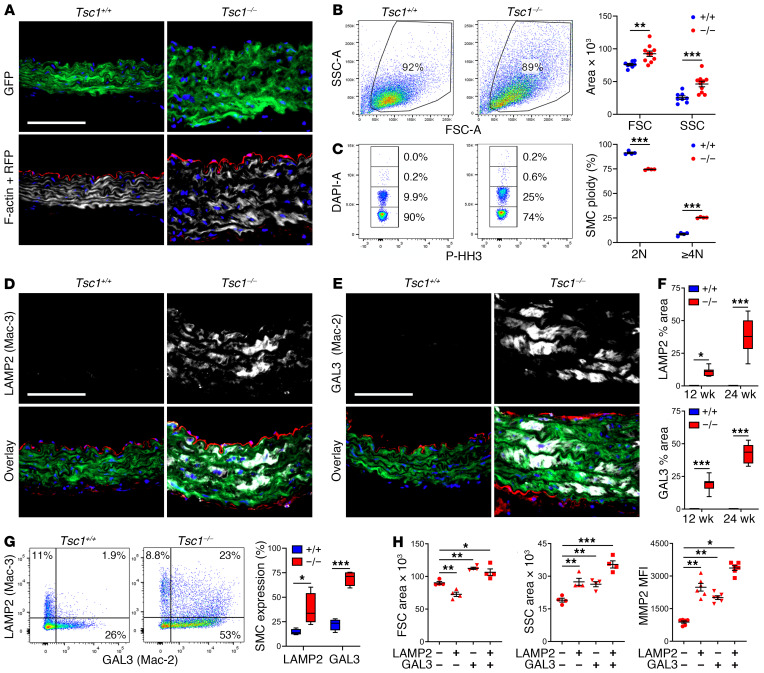
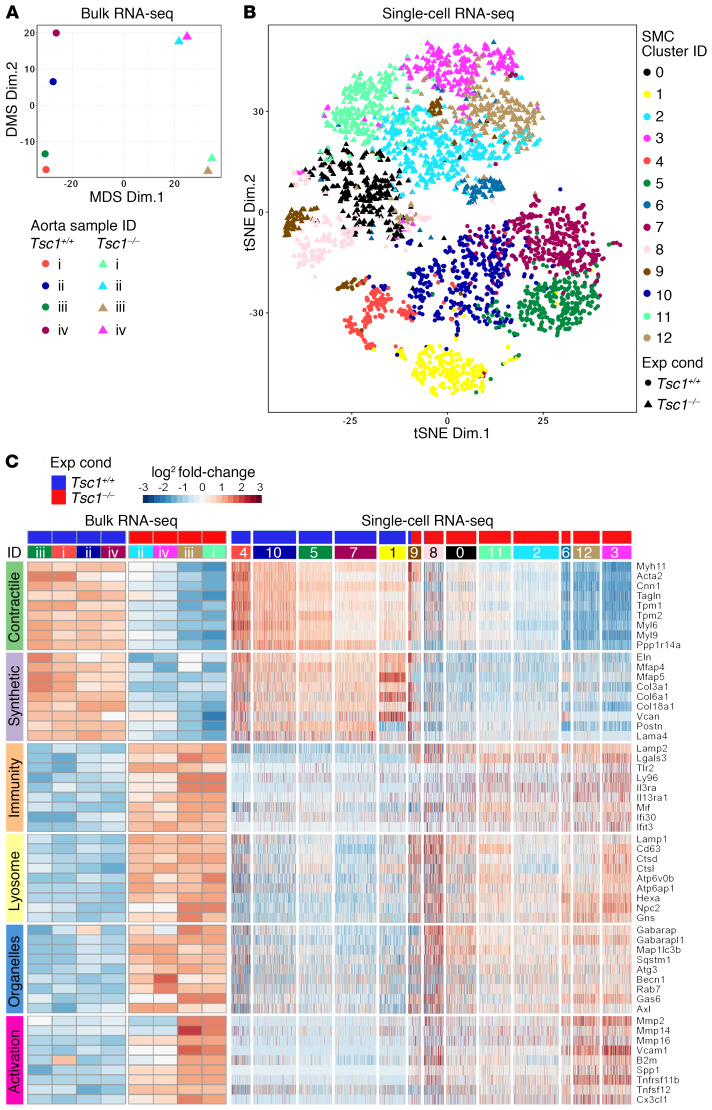
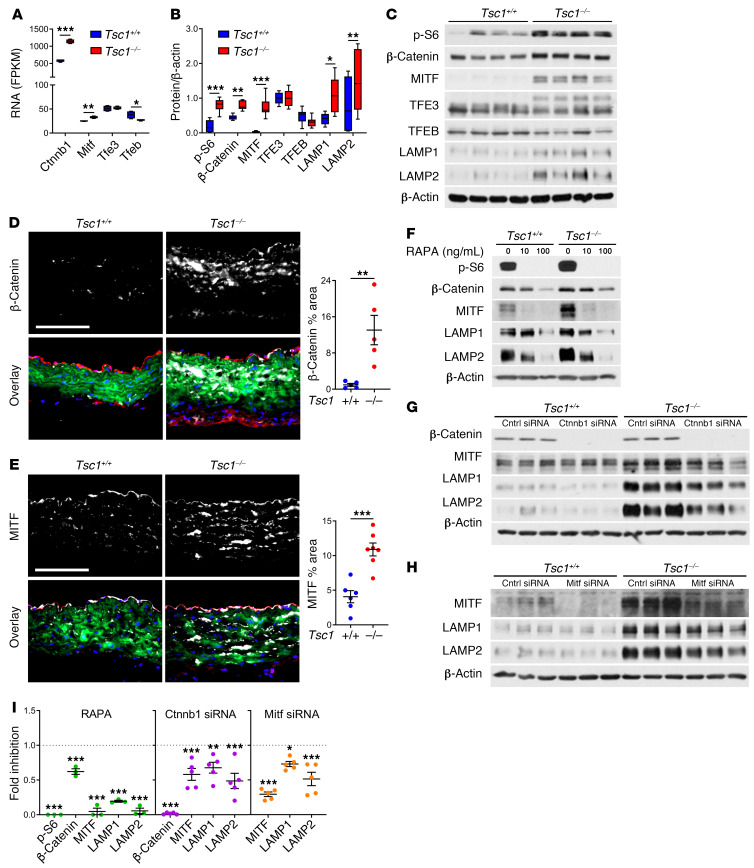
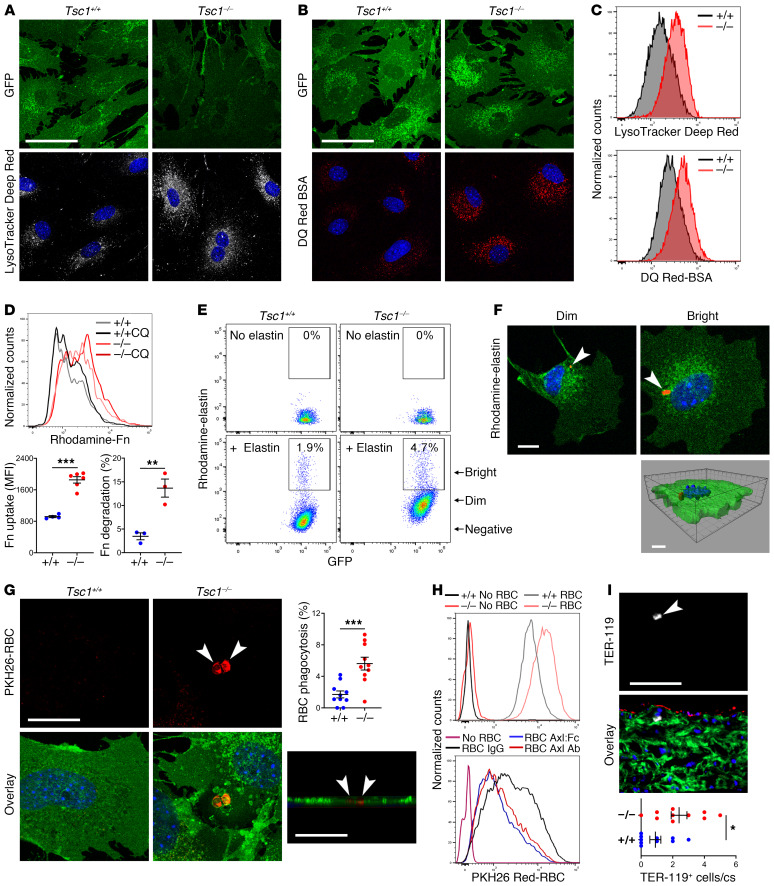
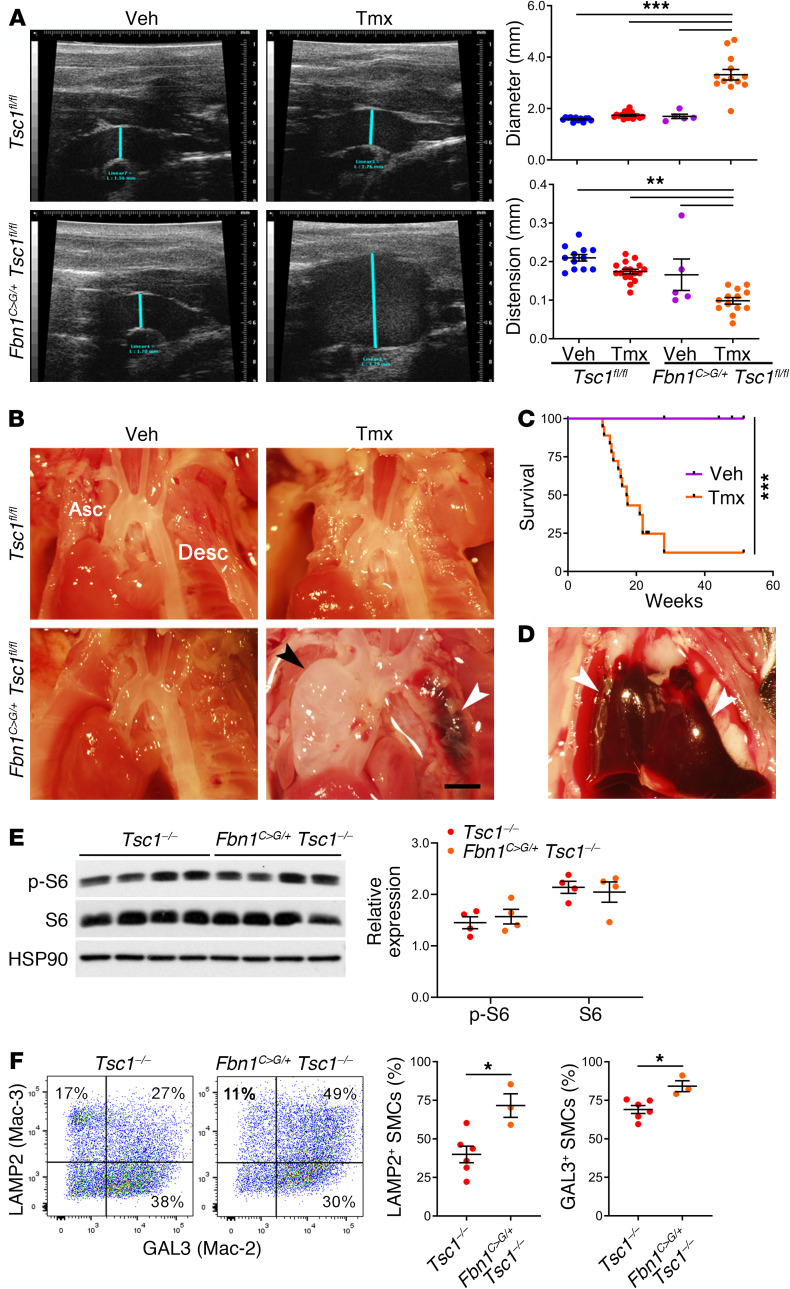
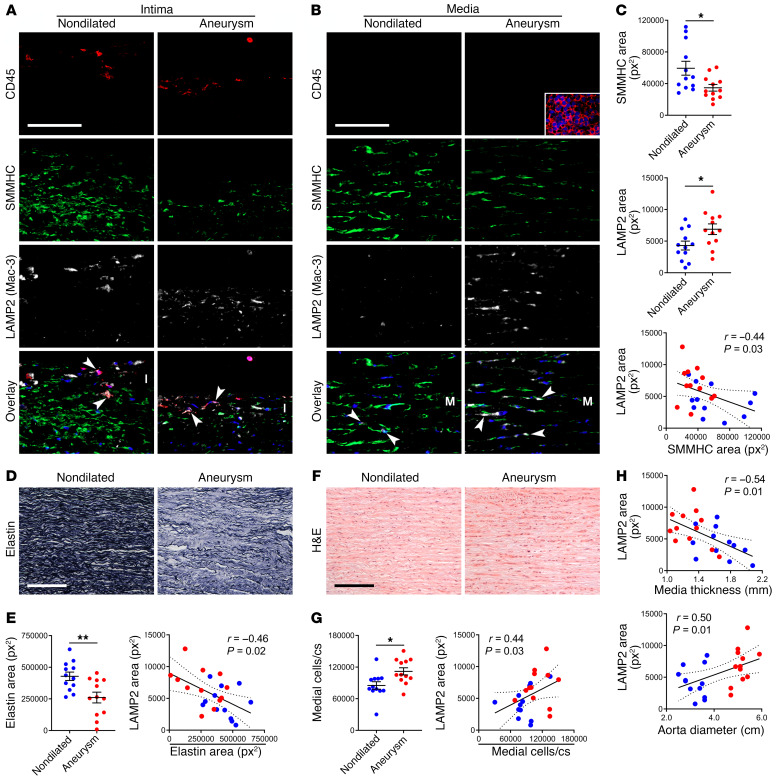
Smooth muscle cell (SMC) proliferation has been thought to limit the progression of thoracic aortic aneurysm and dissection (TAAD) because loss of medial cells associates with advanced disease. We investigated effects of SMC proliferation in the aortic media by conditional disruption of Tsc1, which hyperactivates mTOR complex 1. Consequent SMC hyperplasia led to progressive medial degeneration and TAAD. In addition to diminished contractile and synthetic functions, fate-mapped SMCs displayed increased proteolysis, endocytosis, phagocytosis, and lysosomal clearance of extracellular matrix and apoptotic cells. SMCs acquired a limited repertoire of macrophage markers and functions via biogenesis of degradative organelles through an mTOR/β-catenin/MITF-dependent pathway, but were distinguishable from conventional macrophages by an absence of hematopoietic lineage markers and certain immune effectors even in the context of hyperlipidemia. Similar mTOR activation and induction of a degradative SMC phenotype in a model of mild TAAD due to Fbn1 mutation greatly worsened disease with near-uniform lethality. The finding of increased lysosomal markers in medial SMCs from clinical TAAD specimens with hyperplasia and matrix degradation further supports the concept that proliferation of degradative SMCs within the media causes aortic disease, thus identifying mTOR-dependent phenotypic modulation as a therapeutic target for combating TAAD.

Keywords: Cardiovascular disease; Vascular Biology.


Conflict of interest statement

Conflict of interest: The authors have declared that no conflict of interest exists.

Figures

Figure 1
Figure 1. Tsc1 deletion in SMCs results in progressive aortic disease and dysfunction.
Tsc1fl/fl Myh11-CreERT2 mT/mG mice were treated with tamoxifen (Tmx) or vehicle (Veh) at 1.5 weeks of age and their thoracic aortas were serially examined. (A) In situ examination of ascending (Asc) and descending (Desc) thoracic aortas showing frequent mild dilatation (black arrow) with occasional aneurysms or dissections (white arrows) at 12 weeks. Scale bar: 2 mm. (B) Incidence of TAAD at 12, 24, and 36 weeks. (C) Width and length of unpressurized ascending segments and mass of thoracic aortas at 12 weeks (n = 11–15). (D) Aortic dimensions at 36 weeks (n = 8–10). (E) Mean blood pressure (BP), pulse pressure (PP), and heart rate at 12 weeks (n = 10). (F) Ultrasound examination showing ascending aorta diameter (blue lines) at 12 and 36 weeks. (G) In vivo ascending aorta diameter at end-systole (DiameterS), end-diastole (DiameterD), and distension at 12 weeks (n = 12–17). (H) Ascending aorta outer diameter, normalized to pretreatment value, measured ex vivo in response to 100 mM KCl or 1 μM phenylephrine (PE) and the associated percentage reduction in circumferential (Circ) stress at 12 weeks (n = 5–6). Data are represented as individual values with mean ± SEM bars or as line plots with SEM. *P < 0.05, **P < 0.01, ***P < 0.001 for Tmx vs. Veh by Fisher’s exact test (B), t test (CE and G), 2-way repeated-measures ANOVA (H, left and middle), or 2-way ANOVA (H, right).
Figure 2
Figure 2. Aortic pathology is characterized by SMC proliferation and elastin fragmentation.
Tsc1fl/fl Myh11-CreERT2 mT/mG mice were treated with tamoxifen (Tmx) or vehicle (Veh) at 1.5 weeks of age and their ascending (Asc) and proximal descending (Desc) thoracic aortas were examined by histology at 12 weeks of age; representative photomicrographs of ascending aortas without or with TAAD are shown. Scale bars: 100 μm. (A) Masson’s trichrome (MTC) stains and (B) lumen and media area (n = 9–17). (C) H&E stains and (D) number of medial cells per cross section (cs) or area (n = 9–17). (E) BrdU reactivity (red color marked by arrows), SMA expression (green color), and DAPI-labeled nuclei (blue color) in subset of mice receiving BrdU for 2 weeks and (F) number of BrdU+ medial cells per cross section (n = 6). Number of TUNEL+ medial cells per cross section at (G) 12 weeks and (H) 24 weeks (n = 5). (I) Verhoeff–Van Gieson (VVG) stains and (J) elastin fraction of media area and number of elastin breaks per cross section at 12 weeks (n = 6–21). Data are represented as individual values with mean ± SEM bars. *P < 0.05, **P < 0.01, ***P < 0.001 for Tmx vs. Veh by 2‑way ANOVA. (K) Transmission electron microscopy (TEM) of ascending aortas from tamoxifen-treated Tsc1fl/fl Myh11-CreERT2 mT/mG (Tsc1−/−) and Myh11-CreERT2 mT/mG (Tsc1+/+) mice at 24 weeks showing elastin attenuation, loss of cytoplasmic filaments, and more cytoplasmic organelles extending from perinuclear region to periphery. El, elastin; Co, collagen; Nu, nucleus; Cy, cytoplasm. Scale bars: 1 μm.
Figure 3
Figure 3. mTOR activation and inhibition in Tsc1-deficient aortas.
Tsc1fl/fl Myh11-CreERT2 mT/mG mice were treated with tamoxifen (Tmx) or vehicle (Veh) at 1.5 weeks of age and their thoracic aortas were analyzed at various times. (A) Western blots for indicated proteins at 3 weeks with densitometry of protein bands relative to loading controls (n = 4). (B) Similar analyses at 12 weeks (n = 4). Alternatively, tamoxifen-induced mice were treated with 1% DMSO or rapamycin (RAPA) at 2 mg/kg/d i.p. from 2 to 12 weeks and their thoracic aortas were analyzed. (C) Western blots for indicated proteins at 12 weeks with densitometry of phospho-proteins relative to total proteins and contractile proteins to loading controls (n = 3). (D) In situ examination (scale bar: 2 mm) and (E) TAAD incidence. (F) H&E stains of ascending aortas (scale bar: 100 μm) and (G) number of medial cells per cross section (cs). (H) Verhoeff–Van Gieson stains of ascending aortas (scale bar: 100 μm) and (I) number of elastin breaks per cross section (n = 9–17 per group, DMSO results pooled with similar results of untreated Cre-induced mice for greater statistical power). Data are represented as individual values with mean ± SEM bars or as box-and-whisker plots with interquartile range, median, minimum, and maximum. *P < 0.05; **P < 0.01; ***P < 0.001 for Tmx vs. Veh or RAPA vs. DMSO by 2‑way ANOVA (AC), Fisher’s exact test (E), or t test (G and I).
Figure 4
Figure 4. Tsc1 deletion in SMCs causes impaired elastogenesis and greater elastolysis.
Tsc1fl/fl Myh11-CreERT2 mT/mG mice were treated with tamoxifen (Tmx) or vehicle (Veh), while Myh11-CreERT2 mT/mG (Tsc1+/+) and Tsc1fl/fl Myh11-CreERT2 mT/mG (Tsc1/) mice were treated with tamoxifen at 1.5 weeks of age. (A) Transcript expression in thoracic aortas of 3-week-old mice relative to Hprt (n = 6–7). (B) Elastin (white) and nuclei (blue) in aortic SMC cultures from 3-week-old mice (scale bar: 100 μm) and (C) quantified as mean fluorescence intensity (MFI) (n = 12). (D) Elastic fibers labeled with Alexa Fluor 633 hydrazide (AF633) in thoracic aortas of 12-week-old mice untreated or treated with elastase ex vivo (scale bar: 100 μm) and (E) the relative intensity was quantified (n = 7–8). (F) Relative intensity of cleavage products from BODIPY FL–conjugated DQ elastin incubated with thoracic aorta lysates from 24-week-old mice for 2–12 hours (n = 6). (G) Flow cytometry for MMPSense 645 activation by GFP+ SMCs isolated from ascending (Asc) or descending (Desc) aortas of 12- and 24-week-old mice and (H) quantified at 24 weeks (n = 4). (I) Immunostaining for MMP2 (white) with RFP, GFP, and DAPI overlay in ascending aortas at 24 weeks (scale bar: 100 μm) and (J) quantified in ascending and descending aortas of 12- and 24-week-old mice (n = 8). (K) Flow cytometry for MMP2 expression in GFP+ SMCs and RFP+ cells isolated from thoracic aortas of 24-week-old mice and (L) quantified at 24 weeks (n = 3–5). Data are represented as individual values with mean ± SEM bars or as box-and-whisker plots with interquartile range, median, minimum, and maximum. Additional experimental details can be found in the supplemental methods. *P < 0.05; **P < 0.01; ***P < 0.001 by 2‑way ANOVA (A, E, F, and J) or t test (C, H, and L).
Figure 5
Figure 5. Morphologically abnormal SMCs acquire limited macrophage markers.
Myh11-CreERT2 mT/mG (Tsc1+/+) and Tsc1fl/fl Myh11-CreERT2 mT/mG (Tsc1/) mice were treated with tamoxifen at 1.5 weeks and the thoracic aortas were analyzed at 24 weeks. (A) Immunofluorescence microscopy of ascending aortas identified SMCs by GFP expression (green), nuclei by DAPI labeling (blue), cells other than SMCs by RFP expression (red), and F-actin filaments by phalloidin binding (white). Scale bar: 100 μm. (B) Flow cytometry of enzymatically dispersed GFP+ SMCs determined forward scatter (FSC, indicator of cell size) and side scatter (SSC, indicator of cell granularity) (n = 8–10) and (C) fraction of diploid (2N) and polyploid (≥4N) nuclei by DAPI labeling in nonproliferating, phospho-histone H3–negative (p-HH3–negative) single cells (n = 5). (D) Immunostaining for LAMP2 (also known as Mac-3) and (E) GAL3 (also known as Mac-2) (white) with GFP, RFP, and DAPI overlay in ascending aortas (scale bars: 100 μm) and (F) quantified as percentage area (n = 8). (G) Flow cytometry for intracellular expression of LAMP2 (Mac-3) and GAL3 (Mac-2) by GFP+ SMCs (n = 4) and (H) forward, side scatter area, and MMP2 expression by subpopulations of LAMP2/GAL3–expressing cells (n = 4–6). Data are represented as individual values with mean ± SEM bars or as box-and-whisker plots with interquartile range, median, minimum, and maximum. *P < 0.05; **P < 0.01; ***P < 0.001 by 2-way ANOVA (B, C, F, and G) or 1-way ANOVA (H).
Figure 6
Figure 6. SMCs with downregulated contractile and synthetic molecules are characterized by markers of degradative organelles and cellular activation.
Myh11-CreERT2 mT/mG (Tsc1+/+) and Tsc1fl/fl Myh11-CreERT2 mT/mG (Tsc1/) mice were treated with tamoxifen at 1.5 weeks and the thoracic aortas and isolated GFP+ SMCs were analyzed at 24 weeks. (A) Multidimensional scaling (MDS) of bulk RNA-seq data (n = 4) shows clear delineation of Tsc1+/+ (circular symbols) from Tsc1/ (triangular symbols) experimental conditions (Exp Cond). (B) T-distributed stochastic neighbor embedding (tSNE) of single-cell RNA-seq data identifying 13 cell clusters by a deep learning framework using a filtered data matrix of 2,788 cells by 8,645 genes shows clear delineation of Tsc1+/+ (circular symbols) from Tsc1/ (triangular symbols) experimental conditions. (C) Heatmaps reflecting bulk and single-cell RNA expression changes for genes of interest representing contractile, synthetic, innate immunity, lysosome, other degradative organelles (autophagosomes, endosomes, and phagosomes), and cell activation (proteases, adhesion molecules, and cytokines) phenotypes. There was coordinated upregulation or downregulation of functionally related genes among Tsc1+/+ (blue header bars) versus Tsc1/ (red header bars) aortas (numbered i–iv for each experimental condition) and SMC clusters (numbered 0–12).
Figure 7
Figure 7. mTOR/β-catenin/MITF regulation of lysosomal biogenesis in SMCs.
Myh11-CreERT2 mT/mG (Tsc1+/+) and Tsc1fl/fl Myh11-CreERT2 mT/mG (Tsc1/) mice were treated with tamoxifen at 1.5 weeks and the thoracic aortas were analyzed at 24 weeks. (A) Selected transcript expression by bulk RNA-seq. (B and C) Protein expression by Western blot (n = 8). (D and E) β-Catenin and MITF expression (white) with RFP (red), GFP (green), and DAPI (blue) overlay (scale bars: 100 μm), and quantified as medial percentage area (n = 5–7). Alternatively, cultured GFP+ SMCs were analyzed by P3. (F) Expression of signaling molecules and lysosomal membrane proteins after treatment with rapamycin (RAPA) at 0–100 ng/mL for 6 days in serum-supplemented medium. (G and H) Effects of Ctnnb1 and Mitf knockdown by siRNA versus control (Cntrl) for 3 days. (I) Fold inhibition after rapamycin or siRNA treatment relative to control treatment (dotted lines) in Tsc1/ cells (n = 3–5). Data are represented as individual values with mean ± SEM bars or as box-and-whisker plots with interquartile range, median, minimum, and maximum. *P < 0.05; **P < 0.01; ***P < 0.001; FDR‑adjusted P values (A), 2-way ANOVA (B and I), or t test (D and E).
Figure 8
Figure 8. SMCs gain degradative functions.
SMCs were cultured from thoracic aortas of 24-week-old, tamoxifen-treated Myh11-CreERT2 mT/mG (Tsc1+/+) and Tsc1fl/fl Myh11-CreERT2 mT/mG (Tsc1/) mice. Confocal microscopy of GFP+ SMCs (green) incubated with (A) LysoTracker Deep Red (white) that accumulates in perinuclear vesicles or (B) DQ Red–conjugated BSA (red) that is visualized after hydrolysis of the probe. See supplemental methods for details. Scale bars: 50 μm. (C) Fluorescence intensity of the cells by flow cytometry. (D) Flow cytometry of GFP+ SMCs cultured with rhodamine-labeled fibronectin (Fn) with or without chloroquine (CQ) to distinguish endocytosis-dependent uptake (n = 4–6) from lysosomal degradation (n = 3). (E) Flow cytometry of GFP+ SMCs cultured with or without rhodamine-labeled elastin and (F) confocal microscopy of cells sorted for dim or bright rhodamine fluorescence revealing elastin fragments (red, arrows) confirmed as intracellular by Z‑stack image. Scale bar: 10 μm. (G) Confocal microscopy of GFP+ SMCs (green) cultured with PKH26-labeled, heat-damaged erythrocytes (red, arrows) confirmed as intracellular by Z-stack image (scale bars: 25 μm); percentage GFP+ SMCs containing erythrocytes (n = 10). (H) Flow cytometry of GFP+ SMCs cultured without or with erythrocytes in the presence of control IgG, Axl-neutralizing Ab, or Axl:Fc chimeric protein. (I) Immunofluorescence microscopy of ascending aorta for erythrocyte antigen, TER-119 (white, arrow) with GFP (green), RFP (red), and DAPI (blue) overlay (scale bar: 100 μm); number of medial TER-119+ cells per cross section (cs) (n = 10). Data are represented as individual values with mean ± SEM bars. *P < 0.05, **P < 0.01, ***P < 0.001 for Tsc1/ vs. Tsc1+/+ by t test.
Figure 9
Figure 9. Degradative SMCs exacerbate TAAD in a murine model of Marfan syndrome.
Tsc1fl/fl Myh11-CreERT2 mT/mG (Tsc1fl/fl) and Fbn1C1039G/+ Tsc1fl/fl Myh11-CreERT2 mT/mG (Fbn1C>G Tsc1fl/fl) mice were treated with tamoxifen (Tmx) or vehicle (Veh) at 1.5 weeks of age and their thoracic aortas examined at 12 weeks. (A) Ultrasound examination of ascending aortas (blue line) and measurements of in vivo diameter and distension (n = 5–17). (B) In situ examination of ascending (Asc) and descending (Desc) aortas (scale bar: 2 mm) showing aneurysm (black arrow) and dissection (white arrow). (C) Survival of Fbn1C>G Tsc1fl/fl mice treated with tamoxifen or vehicle (n = 17–18) and (D) hemopericardium (arrows) in animal with premature death. (E) mTOR signaling in thoracic aortas of tamoxifen-treated mice by Western blot and expression of phospho-S6 and S6 relative to HSP90 (n = 4). (F) Flow cytometry for LAMP2 (Mac-3) and GAL3 (Mac-2) expression by GFP+ SMCs in tamoxifen-treated mice (n = 3–6). Data are represented as individual values with mean ± SEM bars. *P < 0.05; **P < 0.01; ***P < 0.001 by 2‑way ANOVA (A and E), log-rank test (C), or t test (F).
Figure 10
Figure 10. Degradative SMCs in human TAAD.
Ascending aortas were procured from 24 subjects undergoing aortic surgery (Aneurysm) or from organ donors (Nondilated). (A and B) Immunofluorescence analysis for CD45 (red), SMMHC (green), LAMP2 (also known as Mac-3; white), and overlays with DAPI-labeled nuclei (blue) showing LAMP2+ leukocytes (arrows) in the intima (I) and LAMP2+ SMCs (arrows) in the media (M); inset of spleen positive control (scale bars: 100 μm). (C) Expression of SMMHC and LAMP2 (n = 12) and correlation of SMMHC to LAMP2 (n = 24). px2, pixels squared. (D) Verhoeff stain of aortic media for elastin (scale bar: 200 μm). (E) Elastin expression (n = 12) and correlation of elastin loss to LAMP2 (n = 24). (F) H&E stain of media (scale bar: 200 μm). (G) Number of medial cells per cross section (cs) (n = 12) and correlation of medial cells to LAMP2 (n = 24). (H) Correlation of media thickness and aorta diameter to LAMP2 (n = 24). Data are represented as individual values with mean ± SEM bars or linear regression lines. *P < 0.05, **P < 0.01 by t test (C, E, and G) or Spearman’s test for r correlation coefficient (C, E, G, and H).

Comment in

References

    1. El-Hamamsy I, Yacoub MH. Cellular and molecular mechanisms of thoracic aortic aneurysms. Nat Rev Cardiol. 2009;6(12):771–786. doi: 10.1038/nrcardio.2009.191. - DOI - PubMed
    1. Klima T, et al. The morphology of ascending aortic aneurysms. Hum Pathol. 1983;14(9):810–817. doi: 10.1016/S0046-8177(83)80303-7. - DOI - PubMed
    1. Tang PC, et al. Hyperplastic cellular remodeling of the media in ascending thoracic aortic aneurysms. Circulation. 2005;112(8):1098–1105. doi: 10.1161/CIRCULATIONAHA.104.511717. - DOI - PubMed
    1. Rabkin SW. Accentuating and opposing factors leading to development of thoracic aortic aneurysms not due to genetic or inherited conditions. Front Cardiovasc Med. 2015;2:21. - PMC - PubMed
    1. Lyon CA, et al. Aneurysm severity is increased by combined Mmp-7 deletion and N-cadherin mimetic (EC4-Fc) over-expression. Sci Rep. 2017;7(1):17342. doi: 10.1038/s41598-017-17700-8. - DOI - PMC - PubMed

Publication types

MeSH terms

Substances