. 2020 Feb 10;20(2):1.
doi: 10.1167/jov.20.2.1.

Impairment of cyclopean surface processing by disparity-defined masking stimuli

Affiliations

Impairment of cyclopean surface processing by disparity-defined masking stimuli

Ross Goutcher et al. J Vis. .

Abstract

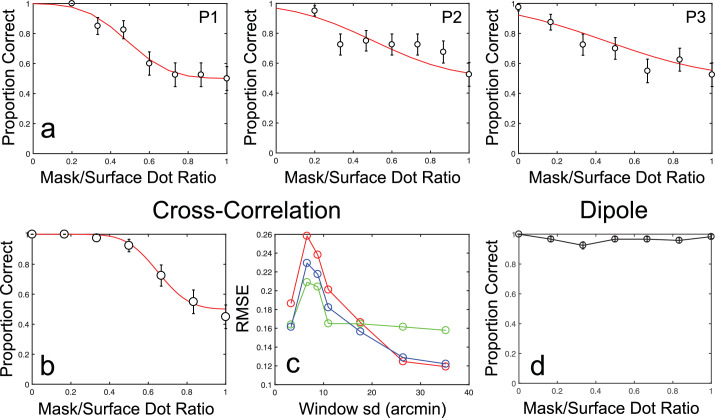
Binocular disparity signals allow for the estimation of three-dimensional shape, even in the absence of monocular depth cues. The perception of such disparity-defined form depends, however, on the linkage of multiple disparity measurements over space. Performance limitations in cyclopean tasks thus inform us about errors arising in disparity measurement and difficulties in the linkage of such measurements. We used a cyclopean orientation discrimination task to examine the perception of disparity-defined form. Participants were presented with random-dot sinusoidal modulations in depth and asked to report whether they were clockwise or counter-clockwise rotated. To assess the effect of different noise structures on measurement and linkage processes, task performance was measured in the presence of binocular, random-dot masks, structured as either antiphase depth sinusoids, or as random distributions of dots in depth. For a fixed number of surface dots, the ratio of mask-to-surface dots was varied to obtain thresholds for orientation discrimination. Antiphase masks were found to be more effective than random depth masks, requiring a lower mask-to-surface dot ratio to inhibit performance. For antiphase masks, performance improved with decreased cyclopean frequency, increased disparity amplitude, and/or an increase in the total number of stimulus dots. Although a cross-correlation model of disparity measurement could account for antiphase mask performance, random depth masking effects were consistent with limitations in relative disparity processing. This suggests that performance is noise-limited for antiphase masks and complexity-limited for random masks. We propose that use of differing mask types may prove effective in understanding these distinct forms of impairment.


Conflict of interest statement

Commercial relationships: none.

Figures

Figure 1.
Figure 1.
Illustration of absolute disparity measurement through cross-correlation and the effects of noise. (a) An example stereogram containing a sinusoidal modulation in depth, similar to the stimuli presented to participants in our experiments. Circles show local windowed patches to be compared by cross-correlation mechanisms. (b) y, disparity coordinate cross-section of the cross-correlation output for the example stimulus, using a smaller window standard deviation of 6.6 arcmin. The sinusoidal modulation is clearly visible. (c) Examples of the effects of antiphase and random disparity masking stimuli (see General methods for details). At low mask-to-surface dot ratios of the antiphase mask the wave form is still visible but is more difficult to discern at the limiting ratio of 1. For random disparity masks the waveform is still visible at this ratio but is more difficult to discern at much higher ratios. Note that the examples here have large disparity amplitudes (5.5 arcmin) and are for illustrative purposes only. They are not directly indicative of cross-correlation model performance.
Figure 2.
Figure 2.
Summary of the stimulus manipulations used across all four experiments. Target surfaces are illustrated as black sinusoidal curves, while illustrations of mask stimuli are shown in red. Stimuli in the experiments were disparity-defined random-dot sinusoidal surfaces, oriented ±20˚ from vertical.
Figure 3.
Figure 3.
Example templates from (a) the cross-correlation model and (b,c) the dipole model. (a) An example template for a clockwise oriented depth sinusoid at a disparity of 1.1 arcmin. The template shows a “no mask” condition, for a window standard deviation of 17.6 arcmin. (b) An example template for the dipole model, showing the joint probability of dipole elevation and orientation, for dipole lengths of between 14 and 22 arcmin. (c) An example dipole template for longer dipoles of between 163 and 172 arcmin.
Figure 4.
Figure 4.
Results from Experiment 1. (a) Results for individual participants (P1 is author RG), together with fitted scaled cumulative Gaussian functions. Error bars show binomial standard errors. (b) Example results from the cross-correlation model, at a window standard deviation of 17.6 arcmin. (c) Cross-correlation model prediction error shown as RMSE against window standard deviation. Each color shows the error for an individual participant. (d) Dipole model performance as a function of mask-to-surface dot ratio.
Figure 5.
Figure 5.
Psychophysical and modeling results for Experiment 2. (a) Results for an example participant (P4) showing increases in proportion correct scores with decreasing cyclopean frequency and increasing disparity amplitude. (b) Results for each participant (P1 is author RG) shown as 75% correct disparity amplitude thresholds across each level of cyclopean frequency. Error bars show the standard deviation of best-fitting thresholds, obtained via bootstrapped resampling. (c) Results for the cross-correlation model with a window standard deviation of 17.6 arcmin (close to the best-fitting window size; see Experiment 2 Results and discussion for details). (d) Prediction error for the cross-correlation model, shown as RMSE against window standard deviation. Each color shows the errors for a different participant. (e) Results for the dipole model, showing ceiling-level performance at all cyclopean frequencies and disparity amplitudes.
Figure 6.
Figure 6.
Results of Experiment 3. (a) Results for each participant (P1 is author RG), together with fitted scaled cumulative Gaussian functions. Error bars show binomial standard errors. (b) Example results for the cross-correlation model with a window standard deviation of 26.4 arcmin (close to the best-fitting window size; see Experiment 3 Results and discussion for details). (c) Prediction errors for the cross-correlation model, plotted as RMSE against window standard deviation for each participant. (d) Dipole model performance. As in Experiments 1 and 2, the dipole model performs at ceiling-level across all tested conditions.
Figure 7.
Figure 7.
Psychophysical and modeling results for Experiment 4. (a) Results for an example participant (P1 is author RG), showing proportion correct scores against mask-to-surface dot ratios for three quantities of surface dot numbers. Error bars show binomial standard errors. (b) Threshold mask-to-surface dot ratios for each participant, as a function of the number of surface dots. Error bars show the standard deviation of best-fitting thresholds, obtained via bootstrapped resampling. (c) Example psychometric functions for the cross-correlation model at a window standard deviation of 30.8 arcmin (close to the best-fitting window size; see Experiment 4 Results and discussion for details). Error bars show binomial standard errors. (d) Prediction errors for the cross-correlation model, shown for each participant as RMSE against window standard deviation. (e) Results of the dipole model, plotted as proportion correct scores against mask-to-surface dot ratios for different number of surface dots. Error bars show binomial standard errors.

Similar articles

References

    1. Allenmark F., & Read J. C. A. (2010). Detectability of sine-versus square-wave disparity gratings: A challenge for current models of depth perception. Journal of Vision, 10(8):17, 1–16, 10.1167/10.8.17. - DOI - PubMed
    1. Allenmark F., & Read J. C. A. (2011). Spatial stereoresolution for depth corrugations may be set in primary visual cortex. PLoS Computational Biology, 7(8): e1002142, 10.1371/journal.pcbi.1002142. - DOI - PMC - PubMed
    1. Assee A., & Qian N. (2007). Solving da Vinci stereopsis with depth-edge-selective V2 cells. Vision Research, 47, 2585–2602. - PMC - PubMed
    1. Banks M. S., Gepshtein S., & Landy M. S. (2004). Why is spatial stereoresolution so low? Journal of Neuroscience, 24(9), 2077–2089. - PMC - PubMed
    1. Brainard D. H. (1997). The psychophysics toolbox. Spatial Vision, 10, 433–436. - PubMed