

A Targeted Metabolomics-Based Assay Using Human Induced Pluripotent Stem Cell-Derived Cardiomyocytes Identifies Structural and Functional Cardiotoxicity Potential
- PMID: 32040181
- PMCID: PMC7098380
- DOI: 10.1093/toxsci/kfaa015
A Targeted Metabolomics-Based Assay Using Human Induced Pluripotent Stem Cell-Derived Cardiomyocytes Identifies Structural and Functional Cardiotoxicity Potential
Abstract
Implementing screening assays that identify functional and structural cardiotoxicity earlier in the drug development pipeline has the potential to improve safety and decrease the cost and time required to bring new drugs to market. In this study, a metabolic biomarker-based assay was developed that predicts the cardiotoxicity potential of a drug based on changes in the metabolism and viability of human induced pluripotent stem cell-derived cardiomyocytes (hiPSC-CM). Assay development and testing was conducted in 2 phases: (1) biomarker identification and (2) targeted assay development. In the first phase, metabolomic data from hiPSC-CM spent media following exposure to 66 drugs were used to identify biomarkers that identified both functional and structural cardiotoxicants. Four metabolites that represent different metabolic pathways (arachidonic acid, lactic acid, 2'-deoxycytidine, and thymidine) were identified as indicators of cardiotoxicity. In phase 2, a targeted, exposure-based biomarker assay was developed that measured these metabolites and hiPSC-CM viability across an 8-point concentration curve. Metabolite-specific predictive thresholds for identifying the cardiotoxicity potential of a drug were established and optimized for balanced accuracy or sensitivity. When predictive thresholds were optimized for balanced accuracy, the assay predicted the cardiotoxicity potential of 81 drugs with 86% balanced accuracy, 83% sensitivity, and 90% specificity. Alternatively, optimizing the thresholds for sensitivity yields a balanced accuracy of 85%, 90% sensitivity, and 79% specificity. This new hiPSC-CM-based assay provides a paradigm that can identify structural and functional cardiotoxic drugs that could be used in conjunction with other endpoints to provide a more comprehensive evaluation of a drug's cardiotoxicity potential.
Keywords: in vitro; cardiotoxicity; drug discovery and development; hiPSC-CM; metabolites.
© The Author(s) 2020. Published by Oxford University Press on behalf of the Society of Toxicology. All rights reserved. For permissions, please e-mail: journals.permissions@oup.com.
Figures
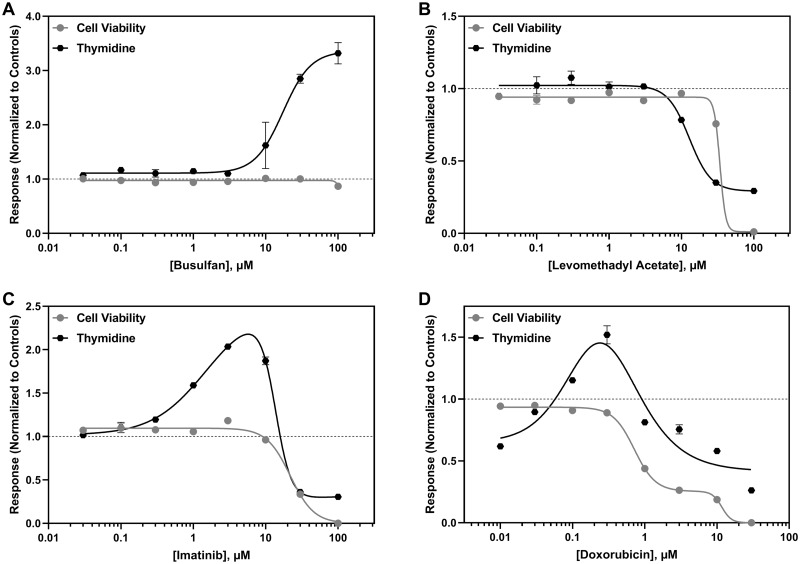
 ) and cell viability (●) are shown for (A) busulfan, (B) levomethadyl acetate, (C) imatinib, and (D) doxorubicin. The x-axis is the drug concentration (µM) and the y-axis is the solvent control-normalized (fold change) value for thymidine or cell viability. Data represent mean ± SEM (n = 3). If not shown, error bars are smaller than the size of the symbol.
References
-
- Accord Healthcare Inc. (2017). Fluorouracil injection, solution In DailyMed [Internet]. 2005. National Library of Medicine (US; ), Bethesda, MD: Available at: https://dailymed.nlm.nih.gov/dailymed/drugInfo.cfm?setid=66d451fe-2436-4.... Accessed January 6, 2020.
-
- Accord Healthcare Inc. (2019). Amitriptyline hydrocloride tablet, film coated In DailyMed [Internet]. 2005. National Library of Medicine (US; ), Bethesda, MD: Available at: https://dailymed.nlm.nih.gov/dailymed/drugInfo.cfm?setid=1e6d2c80-fbc8-4.... Accessed December 27, 2019.
-
- Acetris Health LLC. (2019). Zidovudine capsule In DailyMed [Internet]. 2005. National Library of Medicine (US; ), Bethesda, MD: Available at: https://dailymed.nlm.nih.gov/dailymed/drugInfo.cfm?setid=54e21b7b-939c-4.... Accessed January 2, 2020.
-
- Alfasigma USA Inc. (2019). Tegaserod tablet In DailyMed [Internet]. 2005. National Library of Medicine (US; ), Bethesda, MD: Available at: https://dailymed.nlm.nih.gov/dailymed/drugInfo.cfm?setid=6a44eefe-fbe8-4.... Accessed January 3, 2020.
-
- Althurwi H. N., Maayah Z. H., Elshenawy O. H., El-Kadi A. (2015). Early changes in cytochrome P450s and their associated arachidonic acid metabolites play a crucial role in the initiation of cardiac hypertrophy induced by isoproterenol. Drug Metab. Dispos. 43, 1254–1266. - PubMed
Publication types
MeSH terms
Substances
Grants and funding
LinkOut - more resources
Full Text Sources
Other Literature Sources
Medical
