. 2020 Feb 10;10(1):8.
doi: 10.1186/s13550-020-0591-9.

Quantitative 18F-FDG PET-CT scan characteristics correlate with tuberculosis treatment response

Affiliations

Quantitative 18F-FDG PET-CT scan characteristics correlate with tuberculosis treatment response

Stephanus T Malherbe et al. EJNMMI Res. .

Abstract

Background: There is a growing interest in the use of F-18 FDG PET-CT to monitor tuberculosis (TB) treatment response. Tuberculosis lung lesions are often complex and diffuse, with dynamic changes during treatment and persisting metabolic activity after apparent clinical cure. This poses a challenge in quantifying scan-based markers of burden of disease and disease activity. We used semi-automated, whole lung quantification of lung lesions to analyse serial FDG PET-CT scans from the Catalysis TB Treatment Response Cohort to identify characteristics that best correlated with clinical and microbiological outcomes.

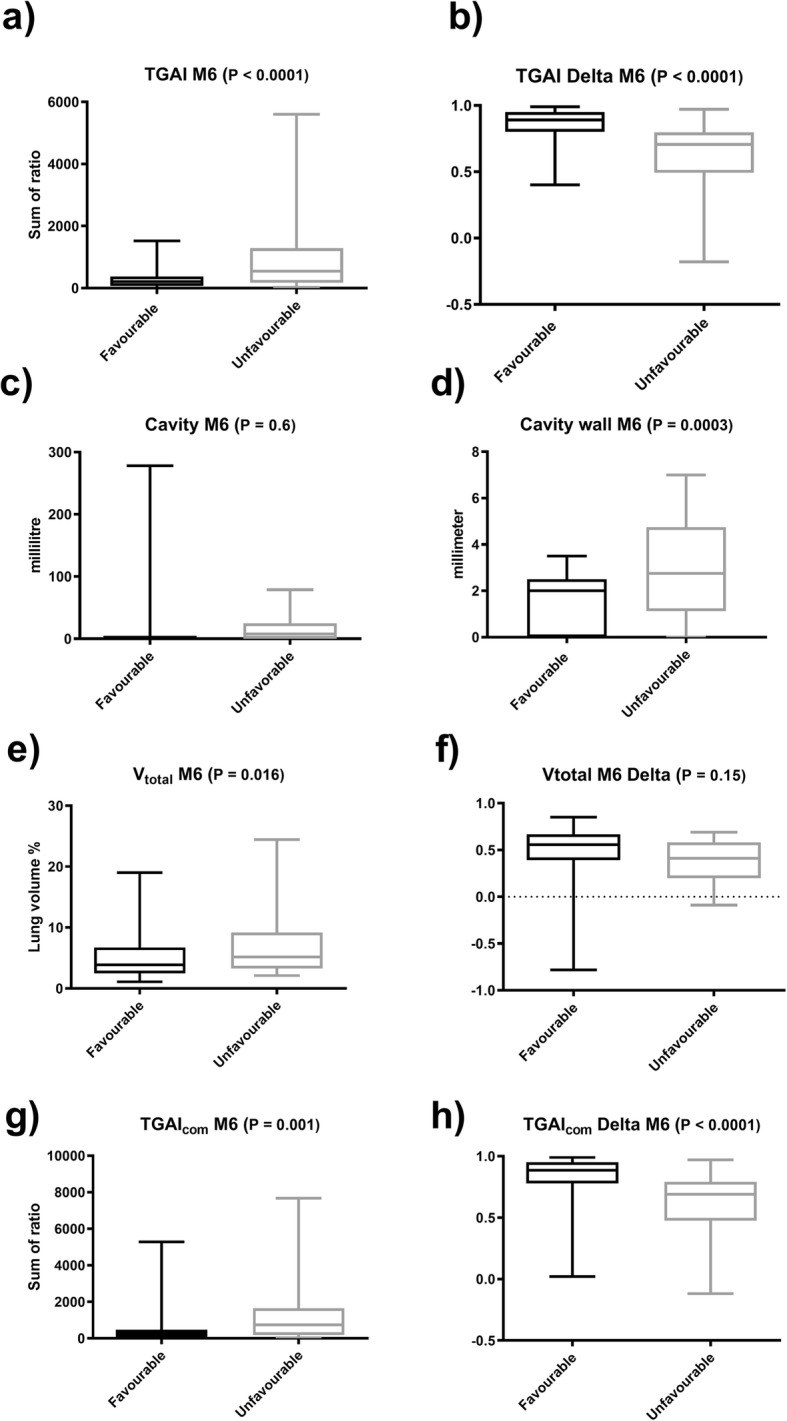
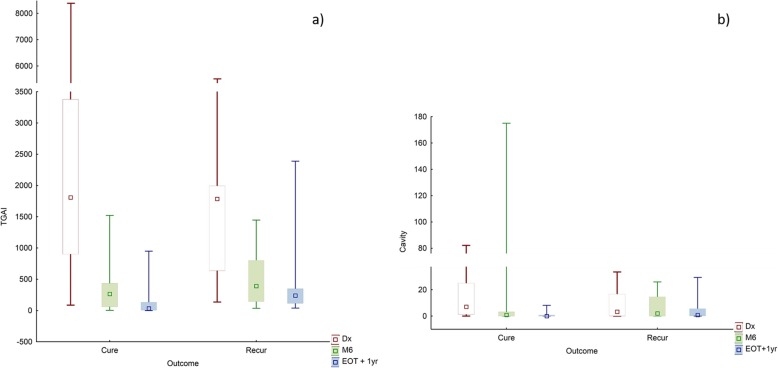
Results: Quantified scan metrics were already associated with clinical outcomes at diagnosis and 1 month after treatment, with further improved accuracy to differentiate clinical outcomes after standard treatment duration (month 6). A high cavity volume showed the strongest association with a risk of treatment failure (AUC 0.81 to predict failure at diagnosis), while a suboptimal reduction of the total glycolytic activity in lung lesions during treatment had the strongest association with recurrent disease (AUC 0.8 to predict pooled unfavourable outcomes). During the first year after TB treatment lesion burden reduced; but for many patients, there were continued dynamic changes of individual lesions.

Conclusions: Quantification of FDG PET-CT images better characterised TB treatment outcomes than qualitative scan patterns and robustly measured the burden of disease. In future, validated metrics may be used to stratify patients and help evaluate the effectiveness of TB treatment modalities.

Keywords: 18F-FDG; Mycobacterium tuberculosis; PET-CT; Quantified lung analysis; Quantitative imaging analysis; Tuberculosis; Tuberculosis treatment response.


Conflict of interest statement

The authors declare that they have no competing interests.

Figures

Fig. 1
Fig. 1
Flow diagram of study design and participants included in analysis
Fig. 2
Fig. 2
Dx, M1, M6 and EOT + 1y FDG PET-CTs for three representative cases that received 6 months of standard treatment and maintained cure. Three-dimensional anterior and transverse slices at the level of horizontal blue line. a Residual cavity with moderate FDG avidity at M6 improves over the next year, leaving nodular infiltrate with mild activity. b New nodule with high intensity seen at M6. It resolved at EOT + 1y, but two new nodules have formed. c All lesions resolved at M6, but three new areas with small nodular and tree-in-bud infiltrates seen at EOT + 1y
Fig. 3
Fig. 3
FDG PET-CTs for three representative cases that received 6 months of standard treatment. Three-dimensional anterior and transverse slices at the level of horizontal blue line. a Bilateral upper lobe cavitation at Dx, which demonstrate increased intensity at M1. At M6, the left cavity has changed to fibrotic tissue with mild uptake, but the right cavity still has a thick wall and high uptake. b Failed treatment case with bilateral upper lobe cavities that retain very high intensity at M6. c Case diagnosed with recurrent disease subsequent to EOT + 1y scan. All lesions improved to moderate intensity uptake at M6, but a large new area of patchy consolidation is seen at EOT + 1y
Fig. 4
Fig. 4
Mean (± SE) log10 transformed values of principal PET and CT parameters over time by time to negativity group and recurrent cases. Total glycolytic activity index in a absolute values [ANOVA P = 0.002 at Dx and <  0.001 at M1 and M6] and b change from baseline [ANOVA P = 0.031 at M1 and P = 0.002 at M6]. Cavity volume in c millilitres [ANOVA P < 0.001 at Dx, M1, and M6] and d change from baseline [ANOVA P = 0.68 at M1 and P = 0.165 at M6]. Total high-density CT lesions in e percentage of lung volume [ANOVA P = 0.013 at Dx, P = 0.6 at M1, and P = 0.037 at M6] and f change from baseline [ANOVA P = 0.093 at M1 and P = 0.57 M6]
Fig. 5
Fig. 5
Box and whisker plots showing median, 25th and 75th percentile (box), and range (whiskers) of scan metrics at M6, grouped by favourable and unfavourable treatment outcome. P values calculated by Student’s T test for independent samples. a Total glycolytic activity index (TGAI). b Change in TGAI from Dx to M6. c Total cavity volume. d Cavity wall thickness. e Total abnormal density lung volume. f Change in total abnormal density lung volume from Dx to M6. g TGAIcom at M6. h Change in TGAIcom from Dx to M6
Fig. 6
Fig. 6
Box and whisker plots showing median, quartiles, and range, grouped in cured and recurrent patients. Y-axis truncated. a TGAI at Dx, M6, and EOT + 1y. b Total cavity volume at Dx, M6, and EOT + 1y

References

    1. WHO . Global tuberculosis report 2018. 2018.
    1. de SE NS, Mancuzo EV, Sulmonetti N, Sacchi FPC, de Souza Viana V, Netto EM, Miranda SS, Croda J. Chronic symptoms and pulmonary dysfunction in post-tuberculosis Brazilian patients. Braz J Infect Dis. 2015;19(5):492–497. doi: 10.1016/j.bjid.2015.06.005. - DOI - PMC - PubMed
    1. Pasipanodya JG, Miller TL, Vecino M, Munguia G, Bae S, Drewyer G, Weis SE. Using the St. George Respiratory Questionnaire to ascertain health quality in persons with treated pulmonary tuberculosis. Chest. 2007;132(5):1591–1598. doi: 10.1378/chest.07-0755. - DOI - PubMed
    1. Wejse C, Gustafson P, Nielsen J, Gomes VF, Aaby P, Andersen PL, Sodemann M. TBscore: signs and symptoms from tuberculosis patients in a low-resource setting have predictive value and may be used to assess clinical course. Scand J Infect Dis. 2008;40(2):111–120. doi: 10.1080/00365540701558698. - DOI - PubMed
    1. Pasipanodya JG, Miller TL, Vecino M, Munguia G, Garmon R, Bae S, Drewyer G, Weis SE. Pulmonary impairment after tuberculosis. Chest. 2007;131(6):1817–1824. doi: 10.1378/chest.06-2949. - DOI - PubMed

LinkOut - more resources