. 2020 Mar;579(7800):609-614.
doi: 10.1038/s41586-020-2027-0. Epub 2020 Feb 10.

Virtual discovery of melatonin receptor ligands to modulate circadian rhythms

Affiliations

Virtual discovery of melatonin receptor ligands to modulate circadian rhythms

Reed M Stein et al. Nature. 2020 Mar.

Abstract

The neuromodulator melatonin synchronizes circadian rhythms and related physiological functions through the actions of two G-protein-coupled receptors: MT1 and MT2. Circadian release of melatonin at night from the pineal gland activates melatonin receptors in the suprachiasmatic nucleus of the hypothalamus, synchronizing the physiology and behaviour of animals to the light-dark cycle1-4. The two receptors are established drug targets for aligning circadian phase to this cycle in disorders of sleep5,6 and depression1-4,7-9. Despite their importance, few in vivo active MT1-selective ligands have been reported2,8,10-12, hampering both the understanding of circadian biology and the development of targeted therapeutics. Here we docked more than 150 million virtual molecules to an MT1 crystal structure, prioritizing structural fit and chemical novelty. Of these compounds, 38 high-ranking molecules were synthesized and tested, revealing ligands with potencies ranging from 470 picomolar to 6 micromolar. Structure-based optimization led to two selective MT1 inverse agonists-which were topologically unrelated to previously explored chemotypes-that acted as inverse agonists in a mouse model of circadian re-entrainment. Notably, we found that these MT1-selective inverse agonists advanced the phase of the mouse circadian clock by 1.3-1.5 h when given at subjective dusk, an agonist-like effect that was eliminated in MT1- but not in MT2-knockout mice. This study illustrates the opportunities for modulating melatonin receptor biology through MT1-selective ligands and for the discovery of previously undescribed, in vivo active chemotypes from structure-based screens of diverse, ultralarge libraries.


Conflict of interest statement

Competing Financial Interests: B.K.S. and J.J.I. are founders of a company, BlueDolphin LLC, that works in the area of molecular docking. All other authors declare no competing interests.

Figures

Extended Data Fig. 1.
Extended Data Fig. 1.. Concentration-response curves of initial 15 compounds in cAMP assays.
hMT1- (a,c,e) or hMT2-mediated (b,d,f) inhibition of isoproterenol-stimulated cAMP in HEK cells by melatonin and 15 initial compounds. Data normalized to melatonin response represent mean ± s.e.m. of four biologically independent experiments (n=4) run in triplicate, unless otherwise indicated, which is indicated in parenthesis next to each compound name.
Extended Data Fig. 2.
Extended Data Fig. 2.. Concentration-response curves of interesting analogs based on initial hits in cAMP assays.
hMT1- (a,c,e) or hMT2-mediated (b,d,f) inhibition of isoproterenol-stimulated cAMP in HEK cells by melatonin and select analogs. Data normalized to melatonin response represent mean ± s.e.m. of four biologically independent experiments (n=4) run in triplicate, unless otherwise indicated, which is indicated in parenthesis next to each compound name.
Extended Data Fig. 3.
Extended Data Fig. 3.. Small changes in ligand structure have large effects on melatonin receptor activity and selectivity.
a, Docked pose of ‘9032, an MT1-selective direct docking hit. b, Docked pose of ‘1360, a close analog of ‘9032 that switches 2-fold selectivity for MT2 over MT1. c, Docked pose of ‘2780, an analog where MT2 selectivity climbs to 89-fold over MT1. d, Docked pose of ‘2623, which adds a bulkier 2-chloro-3-methylthiophene into a proposed MT2-selective hydrophobic cleft, resulting in a fully MT2-selective agonist without detectable MT1 activity. All docked poses are overlaid onto the crystallographic pose of 2-phenylmelatonin in transparent blue. e, Concentration-response curves the four analogs at MT1 and MT2. Data normalized to melatonin response represent mean ± s.e.m. of four biologically independent experiments (n=4) run in triplicate. f, Bias plots of ‘0041 and ‘6688 relative to melatonin signaling. Mean values (Supplementary Table 3) are presented as solid lines and the 95% confidence interval for the line is shaded. Data are normalized to melatonin response and represent mean ± s.e.m. of three biologically independent experiments (n=3) run in triplicate, except for ‘6688 for Gi activation (n=4).
Extended Data Fig. 4.
Extended Data Fig. 4.. MT1-selective inverse agonists decelerate re-entrainment rate in vivo via MT1 receptors.
a - e, Representative actograms of running wheel (RW) activity in wild type (WT) C3H/HeN (C3H) mice treated with VEH (a), 30 μg/mouse MLT (b), UCSF7447 (c), UCSF3384 (d), as well as 300 μg/mouse LUZ (e) just prior to the new dark onset (black dots) following an abrupt 6h advance of dark onset in a 12:12 light-dark cycle (gray: dark phase; white: light phase). Compounds were administered once a day for 3 days (see Methods for additional details). Corresponding quantification found in Fig. 3b,c. f - k, Representative actograms of RW activity for VEH [WT (a), MT1KO (c), MT2KO (e)] or inverse agonist ‘7447 [WT (b), MT1KO (d), MT2KO (f)] treated C3H mice following a 6 h advance of dark onset. Mice were kept in a 12:12 light-dark cycle. ‘7447 (30 μg/mouse) was administered for 3 consecutive days just prior to the new dark onset (black dots). l, Inverse agonist ‘3384 decelerates the rate of re-entrainment of RW activity rhythm onset in C3H WT mice. Data expressed in hours advanced each day for VEH vs. ‘3384 (two-way repeated measures ANOVA; treatment x time interaction: F16,647 = 1.99 P = 0.0122). m, Inverse agonist ‘7447 does not modulate the rate of re-entrainment of RW activity rhythm onset in C3H MT1KO mice. Data expressed in hours advanced each day for MT1KO mice treated with VEH vs. ‘7447 (mixed-effect two-way repeated measures ANOVA; treatment x time interaction: F16,474 = 1.44 P =0.117). n, Inverse agonist ‘7447 decelerates the rate of re-entrainment of RW activity rhythm onset in C3H MT2KO mice. Data expressed in hours advanced each day for MT2KO mice treated with VEH vs. ‘7447 (mixed-effect two-way repeated measures ANOVA; treatment x time interaction: F16,683 = 2.57 P = 0.000686). Extension of Fig. 3a - c, Extended Data Fig 3a - d. Data represents mean ± s.e.m. *P < 0.05, **P < 0.01, for multiple comparisons by Tukey’s post test (P < 0.05). Dotted line in j - k refers to the new dark onset. Additional details of all statistical analyses as well as n for each condition can be found in Methods (Statistics & Reproducibility). Vehicle (VEH), melatonin (MLT), luzindole (LUZ), UCSF7447 (‘7447), UCSF3384 (‘3384). All treatments were given via s.c. injection.
Extended Data Fig. 5.
Extended Data Fig. 5.. MT1-selective inverse agonists phase advance circadian activity at CT 10 via MT1 in vivo.
a - e, Representative actograms of RW activity from individual C3H WT mice kept in constant dark (gray bars) treated with VEH (a), MLT (b), UCSF7447 (c), UCSF3384 (d) or LUZ (e). All treatments were 30 μg/mouse except for LUZ which was 300 μg/mouse as described in Methods. Mice were treated at dusk (CT 10; 2 hours prior to onset of RW activity) for three consecutive days (black dots). Red lines indicate best-fit line of pre-treatment onsets and blue lines indicate best-fit line of post treatment onsets both used for phase shift determinations (see Methods for more details). Corresponding quantification found in Fig. 3d. f - h, Representative actograms of RW activity from individual C3H WT mice kept in constant dark treated with VEH (f), MLT (g), or ‘7447 (h, all treatments 0.9 μg/mouse) at CT 10. Corresponding quantification found in Fig. 3d. i - k, Representative actograms of RW activity from individual C3H WT mice kept in constant dark treated with MLT (i) at CT 2 (10 hours prior to RW onset) or VEH (j) vs. ‘7447(k, all treatments at 30 μg/mouse) at CT 6 (6 hours prior to RW onset). Corresponding quantification found in Extended Data Fig. 7. Extension of Fig. 3d - f. l - q, Representative actograms of running wheel (RW) activity from individual C3H WT (l, m), MT1KO (n, o), and MT2KO (p, q) mice kept in constant dark treated with VEH (white; l, n, p) or UCSF7447(blue; m, o, q; 30 μg/mouse) at CT 10. Corresponding quantification found in Fig. 3e. r - w, Representative actograms of RW activity from individual C3H WT (r, s), MT1KO (t, u), and MT2KO (v, w) mice kept in constant dark treated with VEH (white; r, t, v) or UCSF7447(blue; s, u, w; 30 μg/mouse) at CT 2. Corresponding quantification found in Fig. 3f. Vehicle (VEH), melatonin (MLT), luzindole (LUZ), UCSF7447 (‘7447), UCSF3384 (‘3384). All treatments were given via s.c. injection.
Extended Data Fig. 6.
Extended Data Fig. 6.. Concentration-response curves and Schild-plots of the inverse agonists ‘7447 and ‘3384 in cAMP assays.
a-d, Modulation of hMT1- (a,d) or hMT2- (b,e) mediated inhibition of isoproterenol-stimulated cAMP in HEK cells by melatonin in the presence of ‘7447 (a,b) or ‘3384 (d,e) over a range of concentrations. Data normalized to effect of isoproterenol alone represent mean ± s.e.m. of three biologically independent experiments (n=3) run in triplicate. c,f. Schild plots depicting competitive antagonism of melatonin by ‘7447 (c) and ‘3384 (f). Schild analysis at hMT1 (purple) and hMT2 (teal) reveal competitive antagonism for ‘7447 (hMT1 pKB: 7.4 ± 0.1, slope: 0.98 ± 0.03; hMT2 pKB: 6.2 ± 0.1, slope: 1.3 ± 0.4) (c), and ‘3384 (hMT1 pA2: 7.9 ± 0.1, slope: 0.80 ± 0.04; hMT2pKB: 6.7 ± 0.1, slope: 1.0 ± 0.1 ) (f). Data represent mean ± s.e.m. of three biologically independent experiments (n=3) run in triplicate. UCSF7447 (‘7447), UCSF3384 (‘3384)
Extended Data Fig. 7.
Extended Data Fig. 7.. a - c, Differential phase shift profile for inverse agonist ‘7447 compared to the agonist melatonin and a prototype antagonist luzindole across the circadian cycle.
C3H/HeN mice were kept in constant dark and treated with VEH, MLT, LUZ, or ‘7447 (all treatments 30 μg/mouse except for LUZ which was 300 μg/mouse, s.c.). Mice were treated at CT 2, 6, or 10 (10, 6, or 2 hours prior to onset of RW activity) for three consecutive days (see details in Methods). a, CT 2 phase shift data was compared via one-way ANOVA (F3,11 = 28.16 P = 1.85 × 10⁻⁵). b, CT 6 phase shift data was compared via one-way ANOVA (F3,26 = 0.61 P = 0.61). c, CT 10 phase shift data was compared via one-way ANOVA (F3,17 = 35.13 P = 1.66 × 10⁻⁷). All multiple comparisons made to VEH using Dunnet’s post hoc test (P < 0.05). Values for MLT & ‘7447 at CT 10 pooled from previous data for comparison to LUZ. Data shown represent mean ± s.e.m. ****P < 0.0001 for comparisons with VEH. Vehicle (VEH), melatonin (MLT), luzindole (LUZ), UCSF7447 (‘7447). All treatments were given via s.c. injection.
Figure 1.
Figure 1.. Large library docking finds novel, potent melatonin receptor ligands.
a, Docking for new melatonin receptor chemotypes from the make-on-demand library. b, Docked pose of ‘0207, an hMT1/hMT2 non-selective agonist with low nanomolar activity. c, Docked pose of ‘5999, an MT2-selective inverse agonist. In b-c, the crystallographic geometry of 2-phenylmelatonin is shown in transparent blue, for context. d, The initial 15 docking actives are shown, highlighting groups that correspond to melatonin’s acetamide side chain (blue) and its 5-methoxy-indole (red) in their docked poses and receptor interactions. Shaded molecules are inverse agonists.
Fig. 2.
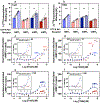
Fig. 2.. Affinity, efficacy, and potency of MT1-selective inverse agonists on human (h) and mouse (m) MT1 and MT2 receptors.
(a,b) Affinity (pKi) of inverse agonists ‘7447 (a) and ‘3384 (b) by 2-[125I]-iodomelatonin competition for hMT1, hMT2, mMT1, and mMT2 receptors stably expressed in CHO cells. Binding was measured in the absence and presence of 100 μM GTP, 1 mM EDTA.Na2, and 150 mM NaCl. GTP uncouples G proteins from melatonin receptors promoting inactive conformations and higher affinity for inverse agonists; thus, the solid bars show higher affinity than the paired checker bars. Connected symbols represent pKi values of individual determinations run in parallel. Ki values were derived from competition binding curves (see Supplementary Data Fig. 3). Bars represent the averages of five independent determinations. Statistical significance between pKi averages were calculated by two-tailed paired student t test (t, df and P values under described under Data Analysis in Methods). *P < 0.05; **P < 0.01; ***P < 0.001; ****P < 0.0001 when compared with corresponding pKi averages values derived in the absence of GTP. (c - f) Concentration-response curves on hMT1, hMT2, mMT1, and mMT2 receptors transiently-expressed in HEK cells, monitoring isoproterenol-stimulated cAMP production with ‘7447 c: hMT1 pEC50: 7.39 ± 0.10, Emax: −62 ± 13%, n = 8; hMT2 pEC50: 5.66 ± 0.10, Emax: −84 ± 9%, n = 8, and e: mMT1 pEC50: 7.20 ± 0.17, Emax: -56 ± 5 %, n = 5; mMT2 pEC50: n/d, n=5, Emax: n/d, n = 5) and d: ‘3384: hMT1pEC50: 7.68 ± 0.09, Emax: −47 ± 12%, n = 13; hMT2 pEC50: 6.18 ± 0.04, Emax: −153 ± 14 %, n = 12; and f: mMT1 pEC50: 7.00 ± 0.22, Emax: -49 ± 3 %, n = 5; and mMT2 pEC50: n/d, Emax: n/d, n = 5) treatment. Data for ‘7447 and ‘3384 was normalized to isoproterenol-stimulated basal activity. Inset graphs represent data normalized to maximal ligand effect. Data represent mean ± s.e.m. from the indicated number (n) of biologically independent experiments run in triplicate. UCSF7447 (‘7447); UCSF3384 (‘3384)
Figure 3.
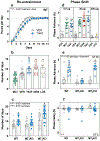
Figure 3.. In vivo, MT1-selective inverse agonists decelerate re-entrainment rate (a-c) and phase advance circadian activity when administered at dusk (CT 10) (d-f).
a - b, Inverse agonists ‘3384 and ‘7447 decelerate re-entrainment rate [a, VEH vs ‘7447 (30 μg/mouse); mixed-effect two-way repeated measures ANOVA (treatment x time interaction: F16,735 = 3.39 P = 8.20 × 10⁻⁶], and increase number of days to re-entrainment after 6 h advance of dark onset in the “east-bound jet-lag” paradigm [b, VEH vs. MLT, ‘3384, and ‘7447 (30 μg/mouse) or LUZ (300 μg/mouse); one-way ANOVA (F4,92 = 16.97 P = 1.86 × 10⁻¹⁰)]. c, Inverse agonist ‘7447 targets MT1 receptors to increase number of days to re-entrainment [VEH (white) vs. ‘7447 (blue; 30 μg/mouse); two-way ANOVA (treatment: F1,120 = 24.82 P = 2.14 × 10⁻⁶, genotype: F2,120 = 23.44 P = 2.55 × 10⁻⁹)]. d, Inverse agonists ‘3384 and ‘7447 phase advance circadian wheel activity onset in constant dark at CT 10 (dusk), resembling agonist melatonin [left: VEH vs. MLT or ‘7447 (0.9 μg/mouse); one-way ANOVA (F2,26 = 13.60 P = 9.08 × 10⁻⁵); center: VEH vs. MLT, ‘3384 or ‘7447 (30 μg/mouse); one-way ANOVA (F3,52 = 32.05 P = 7.15 × 10⁻¹²); right: VEH vs LUZ (300 μg/mouse); two-tailed unpaired students t test (t = 0.92 df = 7 P = 0.39)]. e, The phase advance of wheel activity onset by ‘7447 is mediated via the MT1 receptor at CT 10 (dusk) [VEH (white) vs. ‘7447 (blue; 30 μg/mouse); two-way ANOVA (treatment x genotype interaction: F2,49 = 4.46 P = 0.0166)]. f, Inverse agonist ‘7447, unlike melatonin, did not phase delay in constant dark at CT 2 (dawn) [VEH (white) vs. ‘7447 (blue; 30 μg/mouse); two-way ANOVA (treatment x genotype interaction: F2,49 = 0.384 P = 0.684)]. Panel f has 1 value not shown due to scale, but is included in the analysis (value = 0.91 h). Data shown represent mean ± s.e.m. *P < 0.05, **P < 0.01, ***P < 0.001 for comparisons to WT VEH. &P < 0. 001 for comparisons to MT2KO VEH. Post-test analysis used Sidak’s (a), Tukey’s (c, e, f), or Dunnet’s (b & d; all P < 0.05). Details for all statistical analyses and reporting of n values for each condition (depicted as scatter dot plots where appropriate) are found in Methods (Statistics & Reproducibility). Vehicle (VEH), melatonin (MLT), luzindole (LUZ), UCSF7447 (‘7447), UCSF3384 (‘3384). All treatments were given via s.c. injection.

Comment in

References

    1. Zisapel N New perspectives on the role of melatonin in human sleep, circadian rhythms and their regulation. Br J Pharmacol 175, 3190–3199, doi:10.1111/bph.14116 (2018). - DOI - PMC - PubMed
    1. Dubocovich ML et al. International Union of Basic and Clinical Pharmacology. LXXV. Nomenclature, classification, and pharmacology of G protein-coupled melatonin receptors. Pharmacol Rev 62, 343–380, doi:10.1124/pr.110.002832 (2010). - DOI - PMC - PubMed
    1. Liu J et al. MT1 and MT2 Melatonin Receptors: A Therapeutic Perspective. Annu Rev Pharmacol Toxicol 56, 361–383, doi:10.1146/annurev-pharmtox-010814-124742 (2016). - DOI - PMC - PubMed
    1. Dubocovich ML Melatonin receptors: role on sleep and circadian rhythm regulation. Sleep Med 8 Suppl 3, 34–42, doi:10.1016/j.sleep.2007.10.007 (2007). - DOI - PubMed
    1. Mundey K, Benloucif S, Harsanyi K, Dubocovich ML & Zee PC Phase-dependent treatment of delayed sleep phase syndrome with melatonin. Sleep 28, 1271–1278, doi:10.1093/sleep/28.10.1271 (2005). - DOI - PubMed

MeSH terms