. 2020 Feb 6;9(2):374.
doi: 10.3390/cells9020374.

Excess TPX2 Interferes with Microtubule Disassembly and Nuclei Reformation at Mitotic Exit

Affiliations

Excess TPX2 Interferes with Microtubule Disassembly and Nuclei Reformation at Mitotic Exit

Francesco D Naso et al. Cells. .

Abstract

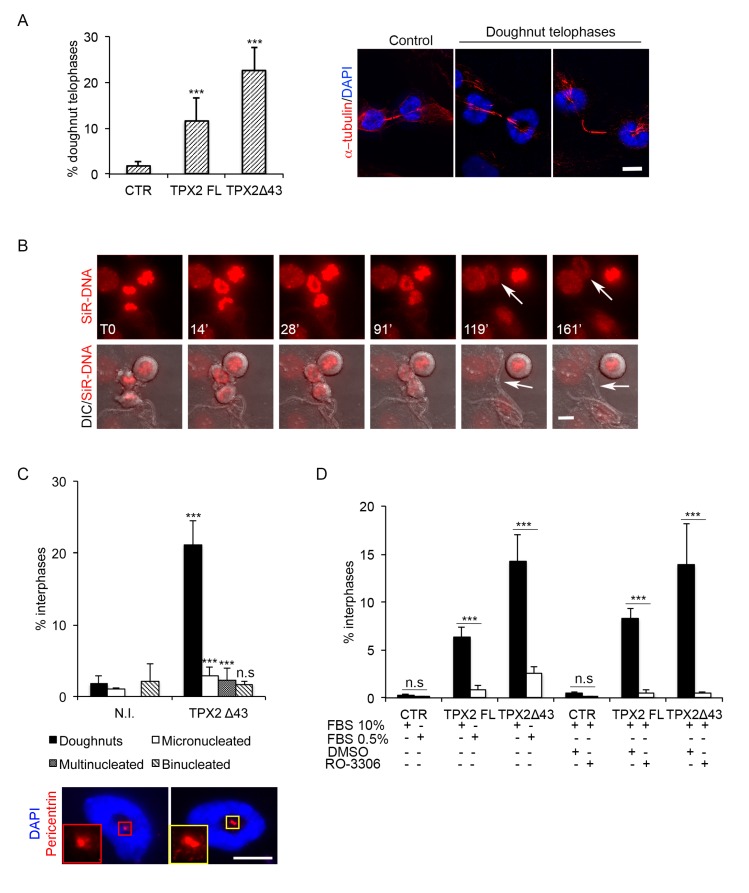
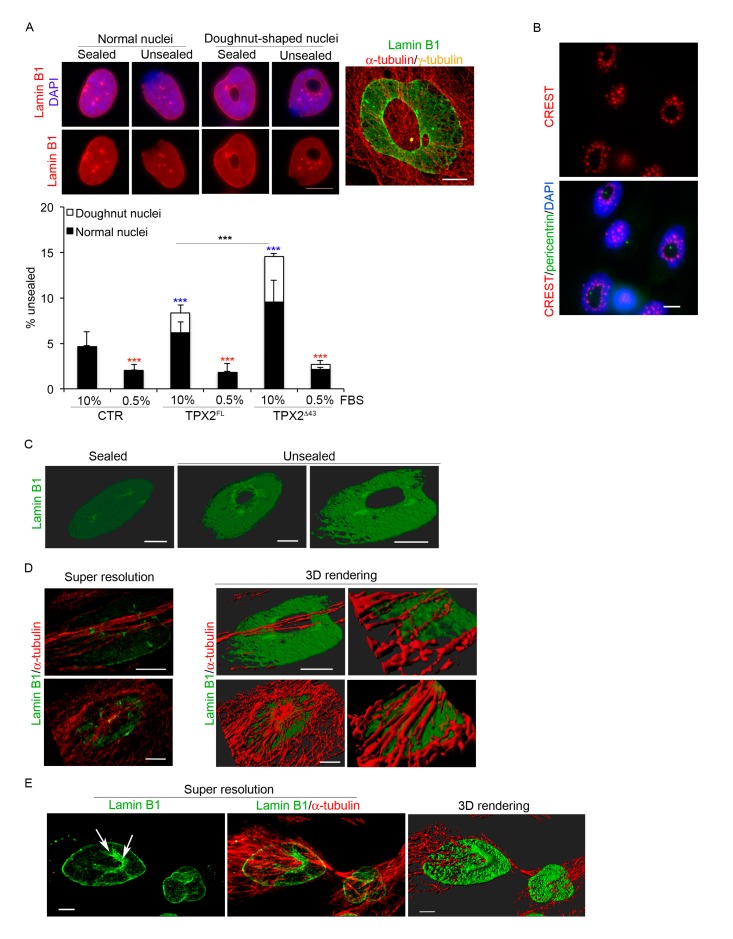
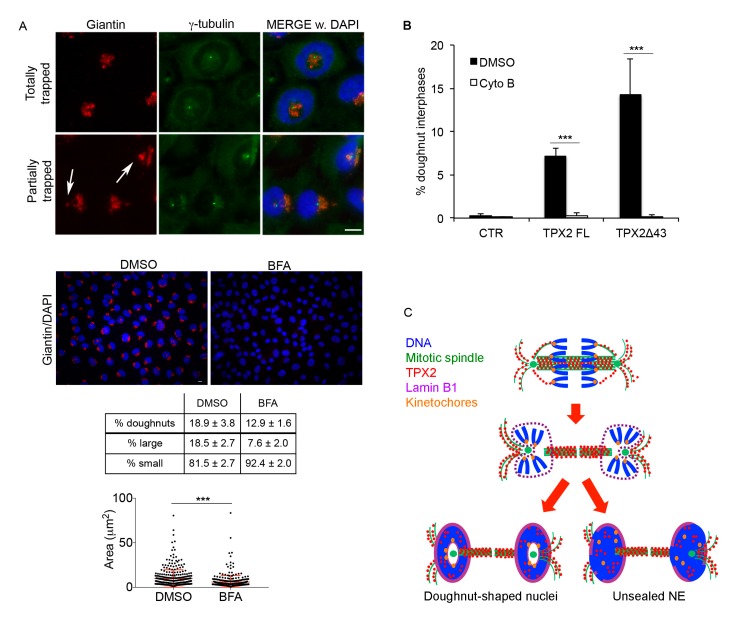
The microtubule-associated protein TPX2 is a key mitotic regulator that contributes through distinct pathways to spindle assembly. A well-characterised function of TPX2 is the activation, stabilisation and spindle localisation of the Aurora-A kinase. High levels of TPX2 are reported in tumours and the effects of its overexpression have been investigated in cancer cell lines, while little is known in non-transformed cells. Here we studied TPX2 overexpression in hTERT RPE-1 cells, using either the full length TPX2 or a truncated form unable to bind Aurora-A, to identify effects that are dependent-or independent-on its interaction with the kinase. We observe significant defects in mitotic spindle assembly and progression through mitosis that are more severe when overexpressed TPX2 is able to interact with Aurora-A. Furthermore, we describe a peculiar, and Aurora-A-interaction-independent, phenotype in telophase cells, with aberrantly stable microtubules interfering with nuclear reconstitution and the assembly of a continuous lamin B1 network, resulting in daughter cells displaying doughnut-shaped nuclei. Our results using non-transformed cells thus reveal a previously uncharacterised consequence of abnormally high TPX2 levels on the correct microtubule cytoskeleton remodelling and G1 nuclei reformation, at the mitosis-to-interphase transition.

Keywords: TPX2; mitosis; nuclear envelope; spindle.


Conflict of interest statement

The authors declare no conflict of interest.

Figures

Figure 1
Figure 1
Generation of hTERT RPE-1 stable cell lines overexpressing TPX2 full length (FL) or Δ43. (A) Western blotting (WB) analysis shows exogenous TPX2 (FLAG-tagged) in the indicated cell lines, after 12 and 24 h of dox induction. Levels of the fluorescent VENUS protein are also shown; actin is used as loading control. (B) Upper immunofluorescence (IF) panels show the localisation of Aurora-A and FLAG-tagged proteins in mitosis in the indicated cell lines (the green signal comes from anti-FLAG staining, while VENUS fluorescence was lost due to methanol fixation); in situ proximity ligation assay (isPLA) signals corresponding to the FLAG/Aurora-A interaction are shown in the panels below. Arrows indicate the position of spindle poles, as assessed by α-tubulin staining. Quantification of the number of isPLA spots within the spindle area under the different conditions are also shown (measures from at least 40 mitoses from three independent experiments; standard deviations (s.d.) are shown; *** p < 0.0001, n.s. (not significant) p ≥ 0.05, one-way ANOVA, Tukey’s multiple comparisions test. (C) Total levels of TPX2 in the indicated cell lines in extracts from interphasic (I) and mitotic (M) cells, 12 h after induction with dox; cyclin B1 is used as a cell cycle control, actin as a loading control. Average fold increase (f.i.) of TPX2 levels in mitotic extracts is shown; subscripts indicate s.d. Molecular weights are indicated on the right side of the WB panels (A,C). (D) IF panels show interphase localisation and increased level of total TPX2 in the indicated cell lines after 12 h of dox induction. Scale bars: 10 μm.
Figure 2
Figure 2
Mitotic localisation of TPX2 in overexpressing cell lines. Localisation of TPX2 at spindle microtubules (MTs) in VENUS (control—CTR) and TPX2-overexpressing cell lines in late prometa/metaphase (IF panels in (A)) or telophase (IF panels in (B)) cells (12 h induction, formaldehyde-fixed). Enhanced deconvolved panels are shown on the right column of each panel, to depict TPX2-positive astral MTs (white arrows) that are not present in the control cell line. Scale bars: 10 μm. Histograms below show the percentage of late prometa/metaphases (A) or telophases (B) displaying TPX2 staining at astral MTs. At least 50 cells per condition were counted, from three independent experiments. Bars indicate standard deviations. *** p < 0.0001, chi-square (and Fisher’s exact) test.
Figure 3
Figure 3
TPX2 overexpression delays progression through prometa/metaphase in non-transformed cells and yields cell division failure. (A) Histograms display the distribution in the indicated cell lines of mitotic cells in pro/prometa/metaphase (P/PM/M) or ana/telophase (A/T) after induction (24 h). A total of 300 mitotic cells were counted per condition, from three independent experiments; s.d. are shown. (B) TPX2 overexpression (24 h induction, methanol-fixed) leads to aberrant mitotic spindle organisation; quantification of scored defects (monopolar spindle, MT organisation defects, short spindles) exemplified in the IF panels (4,6-diamidino-2-phenylindole (DAPI) in blue; α-tubulin in purple), is shown in the histograms below. At least 250 prometa/metaphases (PM/M) were counted per condition, from three independent experiments; s.d. are shown. *** p < 0.0001, chi-square (and Fisher’s exact) test. The table below indicates the pole-to-pole distance (p.p.d.) measured in bipolar spindles only, in late prometaphases/metaphases under the indicated conditions. At least 90 spindles were measured per condition, from three independent experiments. *** p < 0.0001; one-way ANOVA, Tukey’s multiple comparisons test. (C) Time lapse video recording of VENUS (CTR) and TPX2 (FL or Δ43)-overexpressing cells, from the time of induction for the following 48 h. Differential interference contrast (DIC) still frames show a normal mitosis (top), and two examples of delayed prometaphase, either followed by cell division (middle) or by re-adhesion without chromosome segregation (lower panels). Minutes from round-up (t0) are indicated. Phenotypes (%) are shown in the table, while the dot plot indicates the time required (minutes) from round-up to the first signs of chromosome segregation (single measures, as well as the average values and s.d., are shown). Each dot represents a single mitosis; at least 100 cells were analysed per condition, from three independent experiments. Cells spending “>average control time + 2 s.d.” (>40 min) in a prometa/metaphase state were considered as delayed. Scale bars: 10 μm.
Figure 4
Figure 4
TPX2-overexpressing cells display abnormal intercellular bridges. (A) Intercellular bridge (i.c.b.) length was measured in late telophases (displaying decondensed chromatin) in the indicated cell lines; single measures, as well as the average value and s.d., are shown in the dot plot. About 65 telophases for each cell line were analysed, from three independent experiments. *** p < 0.0001; one-way ANOVA, Tukey’s multiple comparisons test. (B) Telophases displaying γ-tubulin at the i.c.b. were scored in the indicated cell lines; examples are shown in the IF panels. (C) Cells showing residual acetylated tubulin at the i.c.b. after treatment with nocodazole (NOC) on ice were counted, in the indicated cell lines; IF panels show the cultures under the different experimental conditions. About 300 telophases were analysed for each cell line, from three independent experiments; s.d. are shown. *** p < 0.0001, chi-square (and Fisher’s exact) test. In (B,C) the green signal comes from α-tubulin staining, while VENUS fluorescence was lost due to methanol fixation. Scale bars: 10 μm.
Figure 5
Figure 5
Doughnut-shaped nuclei formation requires passage through telophase. (A) Telophase cells with doughnut-shaped reforming nuclei, shown in the IF panels, appear in the indicated cell lines, as quantified in the histograms on the left (12 h induction). (B) Generation of doughnut-shaped nuclei in telophase was recorded by time lapse microscopy in the FLAG-TPX2Δ43 cell line not overexpressing VENUS (see Supplementary Figure S2); chromosomes are in red (SiR-DNA fluorescent label) and DIC images are merged in the lower panels. The first recorded telophase frame is indicated as T0. White arrows in the upper panels indicate the forming doughnut, while those in the lower panels indicate the intercellular bridge. (C) The percentage of defective interphases after mitotic shake off/re-plate in TPX2Δ43-overexpressing cultures (or non-induced controls, N.I.) is indicated in the histograms. The cell line with no VENUS expression (see Supplementary Figure S2) was used, in order to label centrosomes with anti-pericentrin antibodies, in addition to the DAPI and α-tubulin staining. The IF panels show examples of doughnut-shaped nuclei (DAPI) associated with one (left) or two (right) pericentrin spots (red); the insets show enlargements of the centrosomes. (D) Reduction of the doughnut-shaped nuclei phenotype was observed following serum starvation or RO-3306 treatment, in the indicated cell lines (+ and − indicate, respectively, the presence or absence of specific cell culturing conditions/treatments). Schematic representations of the experimental protocols are shown in Supplementary Figure S4. For all histograms, at least 1500 interphases per condition were analysed, from three independent experiments; s.d. are shown; *** p < 0.0001, n.s. (not significant) p ≥ 0.05, chi-square (and Fisher’s exact) test. Scale bars: 10 μm.
Figure 6
Figure 6
TPX2 overexpression interferes with lamin B1 organisation at the end of mitosis. (A) Overexpressing cells show a defective lamin B1 rim in normal and doughnut-shaped nuclei. The merged IF panel on the right is a super-resolved image exemplifying the defect. A total of 1500 cells were considered from three independent experiments for each cell line; s.d. are shown; *** p < 0.0001, chi-square (and Fisher’s exact) test. Blue asterisks refer to the difference from the control cell line, red ones to the difference, within each cell line, of serum starved cells (0.5% FBS) from control conditions (10% FBS). The statistical difference between TPX2FL and TPX2Δ43 is also indicated. (B) Kinetochores (CREST, in red) organisation in doughnut-shaped nuclei is shown. The green signal comes from pericentrin staining, while VENUS fluorescence was lost due to methanol fixation. (C) Examples of 3D rendering of cell nuclei displaying sealed or unsealed lamin B1. (D) Examples of doughnut-shaped nuclei: left panels are volume views of super-resolved images, central ones are 3D rendering views; from the latter, enlargements of specific ROIs (Regions of Interest) are shown in right panels. (E) Volume view of a telophase cell with a doughnut-shaped nuclei forming, showing lamin B1 staining (left panel), merged with the α-tubulin signal (central panel). 3D rendering is shown on the right. Scale bars: 10 μm for widefield images and 5 μm for super-resolved images.
Figure 7
Figure 7
Golgi apparatus and cytoskeleton organisation contribute to doughnut-shaped nuclei generation. (A) Golgi organisation (giantin) in doughnut-shaped nuclei is shown in the upper IF panels. White arrows indicate trapped Golgi vesicles. Exemplifying images of control (DMSO) or Brefeldin A (BFA)-treated TPX2Δ43 overexpressing cultures are shown (red: giantin; blue: DAPI). The table indicates the percentage of doughnut-shaped nuclei in TPX2Δ43 cells after treatment with Brefeldin A (BFA; 1500 cells per condition were counted from three independent experiments); lower rows indicate the distribution of doughnut-shaped nuclei (at least 600 counted doughnuts per condition from 3–4 independent experiments) depending on the size of the hole. s.d. are indicated; p < 0.0001, chi-square (and Fisher’s exact) test for all BFA-treated vs. DMSO control cultures. Examples of “large holes” are in the upper IF panels, while “small” ones are exemplified in lower IF panels; “hole” measurements are shown in the graph below (300 measured doughnuts per condition, from three independent experiments; *** p < 0.0001; Mann–Whitney test). Scale bars: 10 μm. (B) Histograms indicate the percentage of doughnut-shaped nuclei in the indicated cell lines after cyto B treatment. A total of 1500 cells per condition were counted from three independent experiments; s.d. are shown; *** p < 0.0001, chi-square (and Fisher’s exact) test. (C) A model for the formation of doughnut-shaped nuclei and/or unsealed envelopes, from mitoses overexpressing TPX2, is depicted. The colour code is indicated. See text for details.

Similar articles

Cited by

References

    1. Prosser S.L., Pelletier L. Mitotic spindle assembly in animal cells: A fine balancing act. Nat. Rev. Mol. Cell Biol. 2017;18:187–201. doi: 10.1038/nrm.2016.162. - DOI - PubMed
    1. Neumayer G., Belzil C., Gruss O.J., Nguyen M.D. TPX2: Of spindle assembly, DNA damage response, and cancer. Cell Mol. Life Sci. 2014;71:3027–3047. doi: 10.1007/s00018-014-1582-7. - DOI - PMC - PubMed
    1. Wittmann T., Boleti H., Antony C., Karsenti E., Vernos I. Localization of the kinesin-like protein Xklp2 to spindle poles requires a leucine zipper, a microtubule-associated protein, and dynein. J. Cell Biol. 1998;143:673–685. doi: 10.1083/jcb.143.3.673. - DOI - PMC - PubMed
    1. Gruss O.J., Carazo-Salas R.E., Schatz C.A., Guarguaglini G., Kast J., Wilm M., Le Bot N., Vernos I., Karsenti E., Mattaj I.W. Ran induces spindle assembly by reversing the inhibitory effect of importin alpha on TPX2 activity. Cell. 2001;104:83–93. doi: 10.1016/S0092-8674(01)00193-3. - DOI - PubMed
    1. Schatz C.A., Santarella R., Hoenger A., Karsenti E., Mattaj I.W., Gruss O.J., Carazo-Salas R.E. Importin alpha-regulated nucleation of microtubules by TPX2. EMBO J. 2003;22:2060–2070. doi: 10.1093/emboj/cdg195. - DOI - PMC - PubMed

Publication types