

Gene Expression Signature Predictive of Neuroendocrine Transformation in Prostate Adenocarcinoma
- PMID: 32041153
- PMCID: PMC7037893
- DOI: 10.3390/ijms21031078
Gene Expression Signature Predictive of Neuroendocrine Transformation in Prostate Adenocarcinoma
Abstract
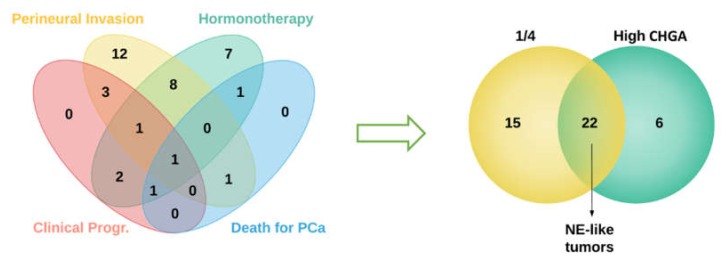
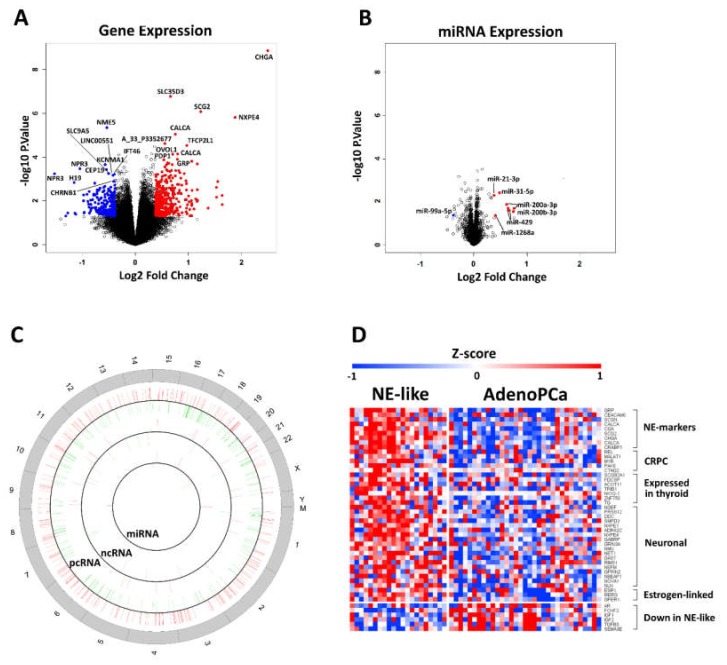
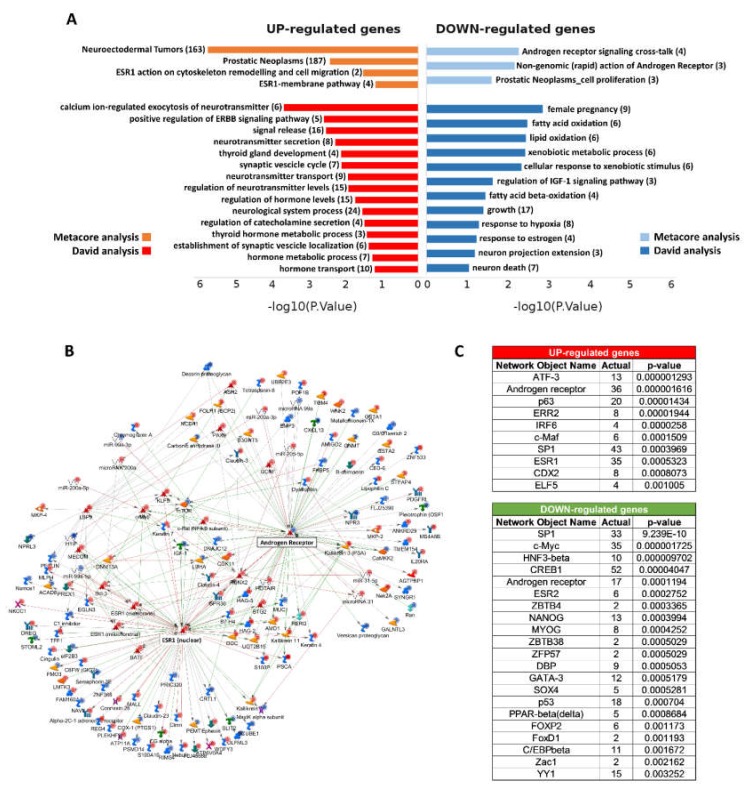
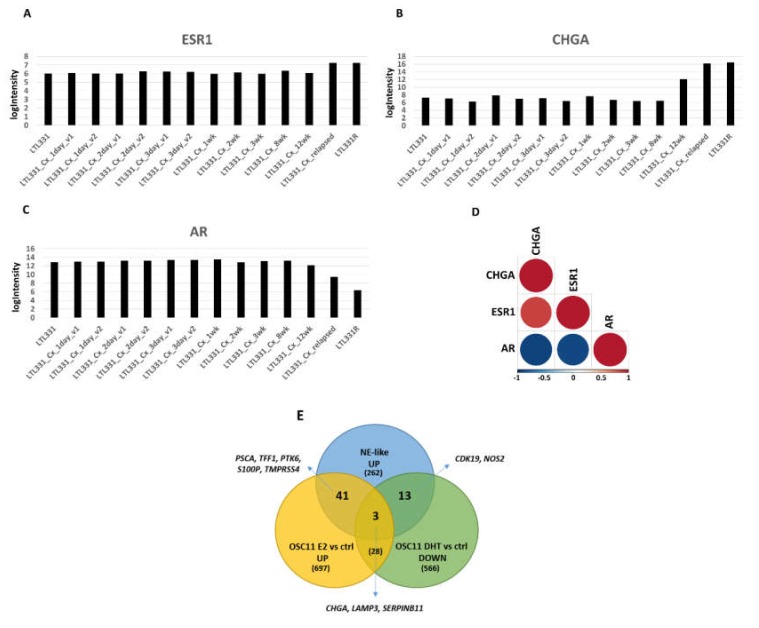
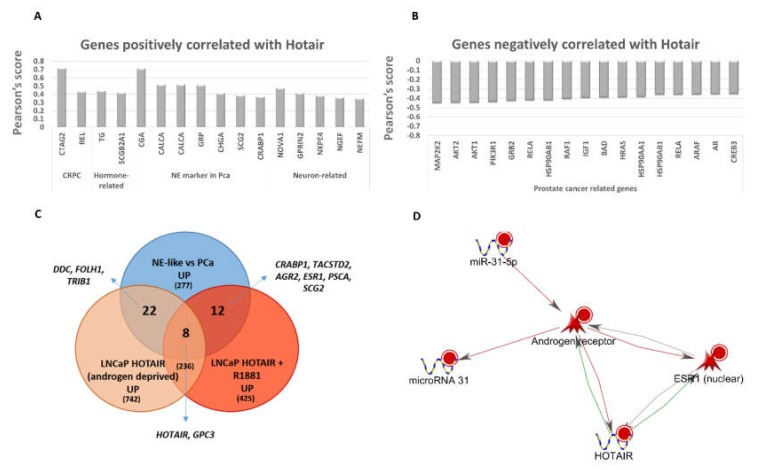
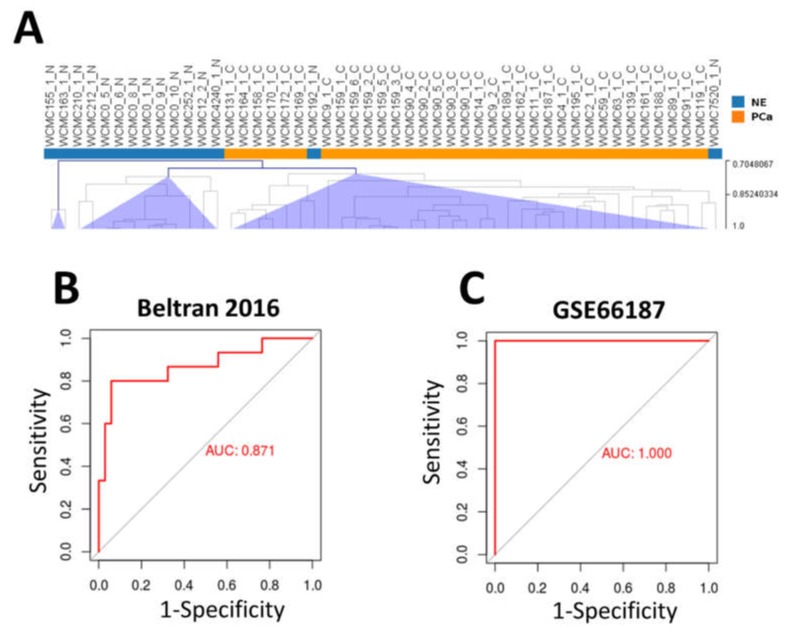
Neuroendocrine prostate cancer (NEPC) can arise de novo, but much more commonly occurs as a consequence of a selective pressure from androgen deprivation therapy or androgen receptor antagonists used for prostate cancer (PCa) treatment. The process is known as neuroendocrine transdifferentiation. There is little molecular characterization of NEPCs and consequently there is no standard treatment for this kind of tumors, characterized by highly metastases rates and poor survival. For this purpose, we profiled 54 PCa samples with more than 10-years follow-up for gene and miRNA expression. We divided samples into two groups (NE-like vs. AdenoPCa), according to their clinical and molecular features. NE-like tumors were characterized by a neuroendocrine fingerprint made of known neuroendocrine markers and novel molecules, including long non-coding RNAs and components of the estrogen receptor signaling. A gene expression signature able to predict NEPC was built and tested on independently published datasets. This study identified molecular features (protein-coding, long non-coding, and microRNAs), at the time of surgery, that may anticipate the NE transformation process of prostate adenocarcinoma. Our results may contribute to improving the diagnosis and treatment of this subgroup of tumors for which traditional therapy regimens do not show beneficial effects.
Keywords: estrogen signaling pathway; long non coding RNAs; neuroendocrine prostate cancer; neuroendocrine transdifferentiation; predictive gene signature; prostate cancer.
Conflict of interest statement
The authors declare no conflict of interest.
Figures
Similar articles
-
The long noncoding RNA H19 regulates tumor plasticity in neuroendocrine prostate cancer.Nat Commun. 2021 Dec 21;12(1):7349. doi: 10.1038/s41467-021-26901-9. Nat Commun. 2021. PMID: 34934057 Free PMC article.
-
Post-transcriptional Gene Regulation by MicroRNA-194 Promotes Neuroendocrine Transdifferentiation in Prostate Cancer.Cell Rep. 2021 Jan 5;34(1):108585. doi: 10.1016/j.celrep.2020.108585. Cell Rep. 2021. PMID: 33406413
-
Molecular model for neuroendocrine prostate cancer progression.BJU Int. 2018 Oct;122(4):560-570. doi: 10.1111/bju.14207. Epub 2018 Apr 24. BJU Int. 2018. PMID: 29569310 Review.
-
The long noncoding RNA landscape of neuroendocrine prostate cancer and its clinical implications.Gigascience. 2018 Jun 1;7(6):giy050. doi: 10.1093/gigascience/giy050. Gigascience. 2018. PMID: 29757368 Free PMC article.
-
Clinical and molecular features of treatment-related neuroendocrine prostate cancer.Int J Urol. 2018 Apr;25(4):345-351. doi: 10.1111/iju.13526. Epub 2018 Feb 3. Int J Urol. 2018. PMID: 29396873 Review.
Cited by
-
SOX2 utilizes FOXA1 as a heteromeric transcriptional partner to drive proliferation in therapy-resistant prostate cancer.bioRxiv [Preprint]. 2025 Jul 19:2025.07.18.664790. doi: 10.1101/2025.07.18.664790. bioRxiv. 2025. PMID: 40791379 Free PMC article. Preprint.
-
The Crosstalk of Long Non-Coding RNA and MicroRNA in Castration-Resistant and Neuroendocrine Prostate Cancer: Their Interaction and Clinical Importance.Int J Mol Sci. 2021 Dec 30;23(1):392. doi: 10.3390/ijms23010392. Int J Mol Sci. 2021. PMID: 35008817 Free PMC article. Review.
-
The Role of EMT-Related lncRNAs in Ovarian Cancer.Int J Mol Sci. 2023 Jun 13;24(12):10079. doi: 10.3390/ijms241210079. Int J Mol Sci. 2023. PMID: 37373222 Free PMC article. Review.
-
Phosphodiesterase Type-5 Inhibitor Tadalafil Modulates Steroid Hormones Signaling in a Prostate Cancer Cell Line.Int J Mol Sci. 2021 Jan 13;22(2):754. doi: 10.3390/ijms22020754. Int J Mol Sci. 2021. PMID: 33451122 Free PMC article.
-
Computational drug discovery pipelines identify NAMPT as a therapeutic target in neuroendocrine prostate cancer.Clin Transl Sci. 2024 Sep;17(9):e70030. doi: 10.1111/cts.70030. Clin Transl Sci. 2024. PMID: 39295559 Free PMC article.
References
MeSH terms
Substances
Grants and funding
LinkOut - more resources
Full Text Sources
Other Literature Sources
Medical
Molecular Biology Databases
Miscellaneous
