. 2020 Feb 6;21(3):1074.
doi: 10.3390/ijms21031074.

An Isolated Complex V Inefficiency and Dysregulated Mitochondrial Function in Immortalized Lymphocytes from ME/CFS Patients

Affiliations

An Isolated Complex V Inefficiency and Dysregulated Mitochondrial Function in Immortalized Lymphocytes from ME/CFS Patients

Daniel Missailidis et al. Int J Mol Sci. .

Abstract

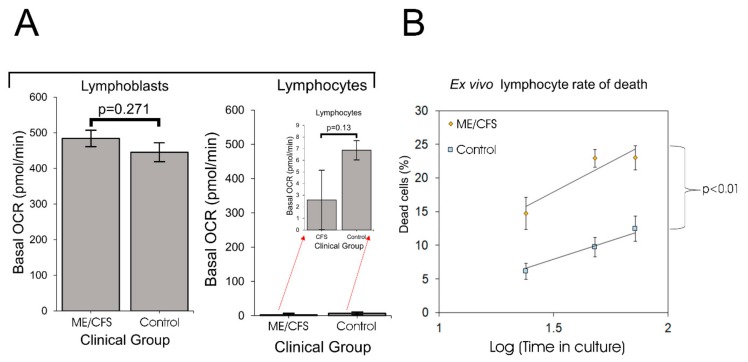
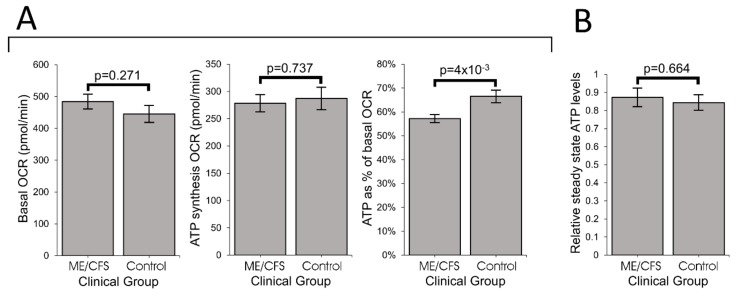
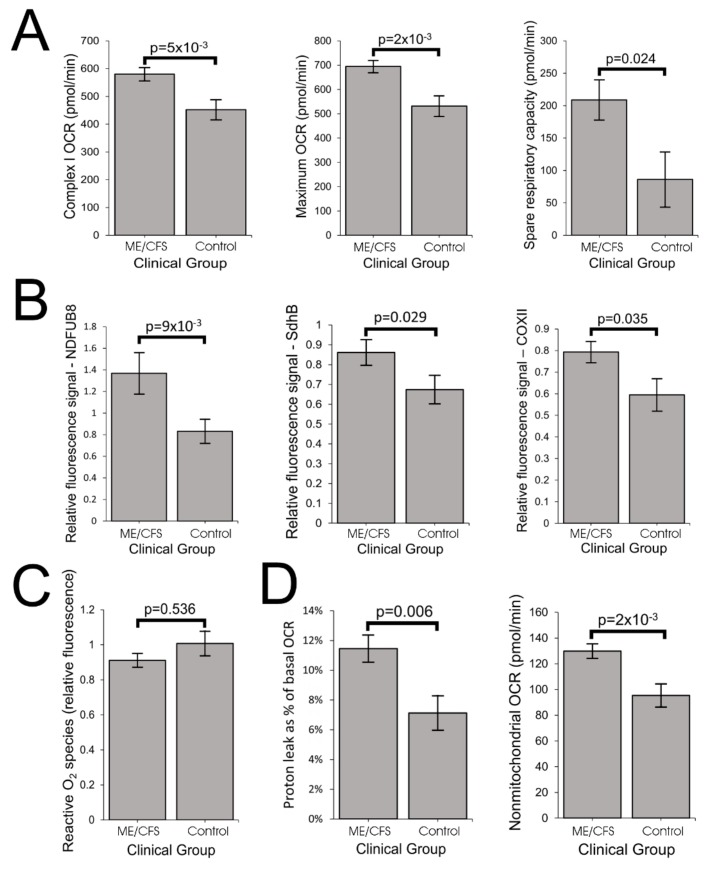
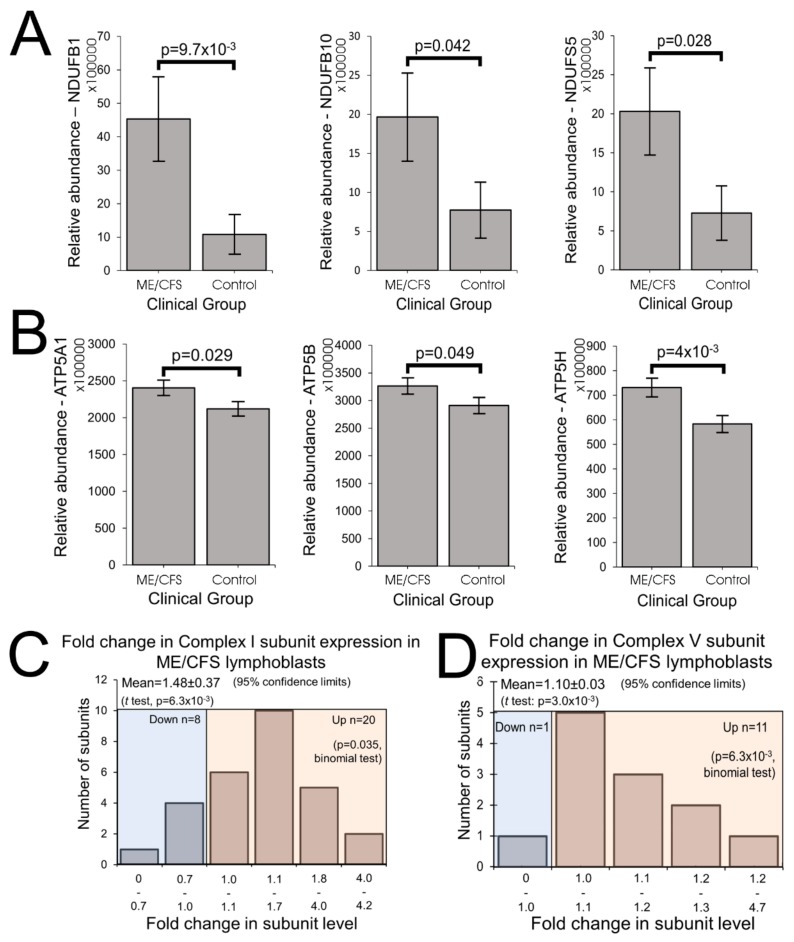
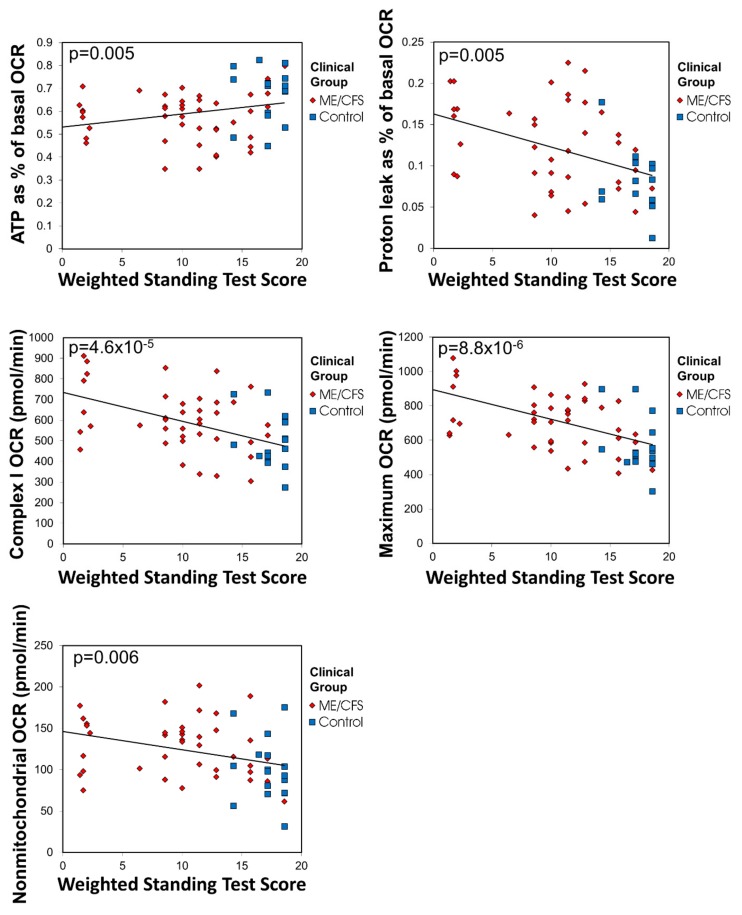
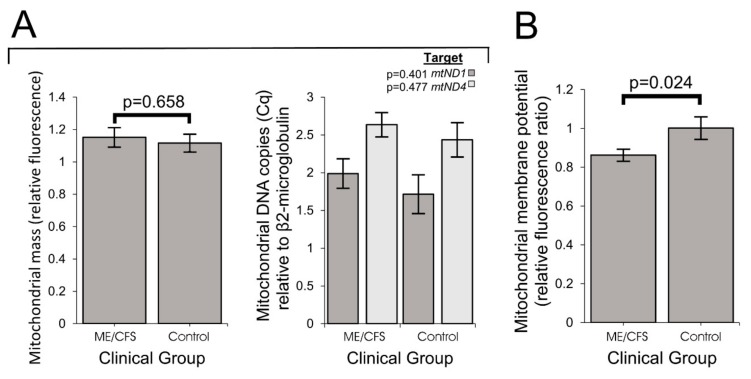
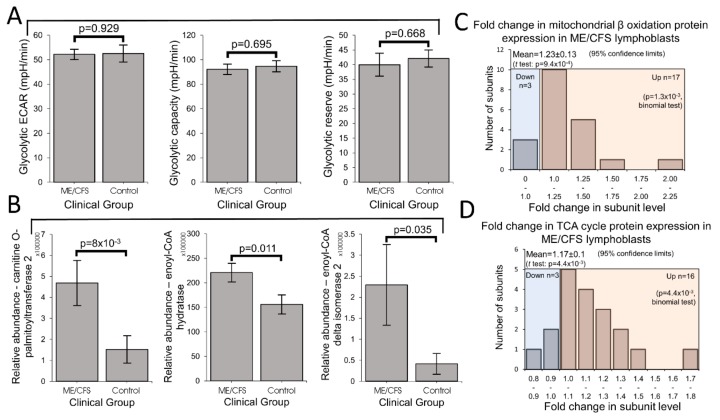
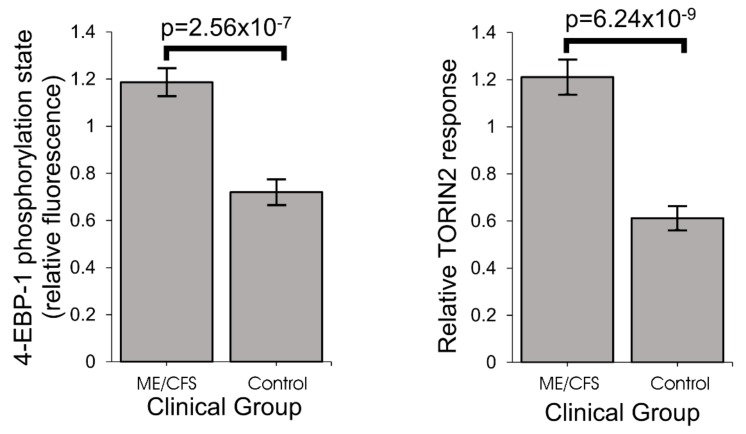
Myalgic encephalomyelitis/chronic fatigue syndrome (ME/CFS) is an enigmatic condition characterized by exacerbation of symptoms after exertion (post-exertional malaise or "PEM"), and by fatigue whose severity and associated requirement for rest are excessive and disproportionate to the fatigue-inducing activity. There is no definitive molecular marker or known underlying pathological mechanism for the condition. Increasing evidence for aberrant energy metabolism suggests a role for mitochondrial dysfunction in ME/CFS. Our objective was therefore to measure mitochondrial function and cellular stress sensing in actively metabolizing patient blood cells. We immortalized lymphoblasts isolated from 51 ME/CFS patients diagnosed according to the Canadian Consensus Criteria and an age- and gender-matched control group. Parameters of mitochondrial function and energy stress sensing were assessed by Seahorse extracellular flux analysis, proteomics, and an array of additional biochemical assays. As a proportion of the basal oxygen consumption rate (OCR), the rate of ATP synthesis by Complex V was significantly reduced in ME/CFS lymphoblasts, while significant elevations were observed in Complex I OCR, maximum OCR, spare respiratory capacity, nonmitochondrial OCR and "proton leak" as a proportion of the basal OCR. This was accompanied by a reduction of mitochondrial membrane potential, chronically hyperactivated TOR Complex I stress signaling and upregulated expression of mitochondrial respiratory complexes, fatty acid transporters, and enzymes of the β-oxidation and TCA cycles. By contrast, mitochondrial mass and genome copy number, as well as glycolytic rates and steady state ATP levels were unchanged. Our results suggest a model in which ME/CFS lymphoblasts have a Complex V defect accompanied by compensatory upregulation of their respiratory capacity that includes the mitochondrial respiratory complexes, membrane transporters and enzymes involved in fatty acid β-oxidation. This homeostatically returns ATP synthesis and steady state levels to "normal" in the resting cells, but may leave them unable to adequately respond to acute increases in energy demand as the relevant homeostatic pathways are already activated.

Keywords: Complex V; TORC1; chronic fatigue syndrome; mitochondria; myalgic encephalomyelitis; seahorse respirometry.


Conflict of interest statement

The authors declare no conflict of interest.

Figures

Figure 1
Figure 1
Ex vivo lymphocytes are metabolically quiescent and myalgic encephalomyelitis/chronic fatigue syndrome (ME/CFS) lymphocytes die more rapidly. Error bars are standard errors of the mean. (A) Basal oxygen consumption rates (OCR) was measured in lymphoblasts and lymphocytes from ME/CFS and control individuals. Lymphoblasts: each ME/CFS (n = 50) and control (n = 22) cell line was assayed over four replicates in at least three independent experiments. Lymphocytes: each ME/CFS (n = 14) and control (n = 9) cell line was assayed over four replicates once due to limited supply. The red arrows point to the same data magnified with a smaller Y axis scale. The low basal OCRs for lymphocytes match those previously reported [8]. (B) ME/CFS lymphocytes die more rapidly than healthy controls. Lymphocytes from ME/CFS patients (n = 35) and healthy controls (n = 14) were seeded at a density of 1 × 10⁶ viable cells/mL in RPMI 1640 with 10% serum and kept in a humidified 5% CO2 incubator at 37 °C during the experiment. Each point represents the mean percentage of dead cells at the corresponding time point for ex vivo lymphocytes from ME/CFS patients and healthy controls. Stepwise multiple regression analysis was performed with dummy variables allowing both slopes and intercepts to differ between groups, with removal of least significant regression variables until only significant coefficients remained. The difference in the slopes (death rates) of the log-linear regressions between the ME/CFS and control group was statistically significant (t test).
Figure 2
Figure 2
ATP synthesis by Complex V is inefficient in ME/CFS lymphoblasts. Error bars are standard errors of the mean. (A) Basal OCR and OCR by ATP synthesis were unchanged while OCR by ATP synthesis as a% of basal OCR was reduced in ME/CFS lymphoblasts (independent t-test). Each ME/CFS (n = 50) and control (n = 22) cell line was assayed over four replicates in at least three independent experiments. (B) Intracellular ATP concentration (relative background-subtracted luciferase luminescence) is unchanged in ME/CFS lymphoblasts (independent t-test). Each ME/CFS (n = 49) and control (n = 22) cell line was assayed in duplicate within each of at least three independent experiments. Data is normalized to an internal control cell line.
Figure 3
Figure 3
ME/CFS lymphoblasts exhibit elevated respiratory capacity and expression of oxidative phosphorylation (OXPHOS) complexes. Error bars are standard errors of the mean. (A) Complex I OCR, maximum OCR and spare respiratory capacity are elevated in ME/CFS lymphoblasts (independent t-test). The OCR was measured in lymphoblasts from ME/CFS and control individuals by the Seahorse XFe24 Extracellular Flux Analyzer. Each ME/CFS (n = 50) and control (n = 22) cell line was assayed over four replicates in each of at least three independent experiments. (B) Relative expression levels of Complex I subunit NDUFB8, Complex II subunit SdhB and Complex IV subunit COXII were elevated in semiquantitative Western blots (independent t-test). Each ME/CFS (n = 48) and control (n = 17) cell line was assayed in at least three independent experiments. (C) Intracellular ROS levels (relative background-subtracted Deep Red fluorescence) are unchanged in ME/CFS lymphoblasts (independent t-test). Each ME/CFS (n = 49) and control (n = 22) cell line was assayed in duplicate within each of at least three independent experiments. (D) Proton leak as % of basal OCR and the nonmitochondrial OCR are elevated in ME/CFS lymphoblasts (independent t-test). Each ME/CFS (n = 50) and control (n = 22) cell line was assayed over four replicates per experiment in at least three independent experiments.
Figure 4
Figure 4
ME/CFS lymphoblasts exhibit elevated expression of Complexes I and V in their whole cell proteomes. (A) Complex I subunits NDUFB1, NDUFB10, and NDUFS5 were significantly upregulated (iBAQ) in whole cell proteomes (independent t-test). Each ME/CFS (n = 22) and control (n = 16) cell line was sampled once. (B) Complex V subunits ATP5A1, ATP5B, and ATP5H were significantly upregulated (iBAQ) in whole cell mass spectrometry proteomics experiments (independent t-test). Each ME/CFS (n = 22) and control (n = 16) cell line was sampled once. (C) Of the 44 known Complex I subunits, 31 were present amongst the 3700 proteins detected in the whole cell proteomes, 28 of these in both control and ME/CFS lymphoblast samples. Their relative abundances were compared and the majority were elevated in ME/CFS cells (fold change > 1) The background colors separate the two tested proportions in this data: blue corresponding to the samples with reduced abundance and pink for samples with elevated abundance. (D) 12 Complex V subunits were detected within the whole cell proteomes of ME/CFS and control lymphoblasts. Their relative abundances were compared to the controls and the majority were elevated in ME/CFS cells (fold change > 1). The background colors indicate the samples with reduced abundance (blue) and samples with elevated abundance (pink).
Figure 5
Figure 5
The respiratory shift in ME/CFS lymphoblasts is correlated with disease severity. ATP synthesis as a percentage of basal respiration and the elevated proton leak, maximum, nonmitochondrial and Complex I OCRs correlate with Weighted Standing Test score, a measure of disease severity in which lower values indicate more severe clinical presentation (Pearson correlation with indicated significance) (ME/CFS n = 45, control n = 17). Patients whose illness was so severe as to preclude them taking the test were not included. Lines fitted by linear least squares. Outliers falling outside 95% confidence limits were excluded.
Figure 6
Figure 6
Mitochondrial genome copy number and mass per cell are unchanged in ME/CFS lymphoblasts, but mitochondrial membrane potential is lowered. Error bars represent standard errors of the mean. (A) Mitochondrial mass (background-subtracted Mitotracker Green fluorescence normalized to an internal control cell line) and genome copy number (qPCR of two mitochondrial genes, mtND1 and mtND4, relative to nuclear β2-microglobulin gene) are unchanged in ME/CFS lymphoblasts (independent t-test). Each ME/CFS (n = 50) and control cell line (n = 22) was assayed in duplicate within each of at least three independent experiments. (B) Mitochondrial membrane potential is significantly reduced in ME/CFS lymphoblasts (independent t-test). The relative mitochondrial membrane potential (Δψm) was measured in lymphoblasts from ME/CFS and control individuals (ratio of MitoTracker® Red CMXRos (Δψm-dependent) to MitoTracker® Green (mitochondrial mass-dependent) fluorescence, normalized to an internal control cell line). Each ME/CFS (n = 50) and control (n = 22) cell line was assayed in duplicate within each of at least three independent experiments.
Figure 7
Figure 7
Glycolysis rates are unaffected in ME/CFS lymphoblasts, but levels of enzymes involved in fatty acid β-oxidation and the TCA cycle are elevated Error bars represent standard errors of the mean. (A) Glycolytic rate, capacity and reserve are unchanged in ME/CFS lymphoblasts (independent t-test). The ECAR was measured in lymphoblasts from ME/CFS and control individuals by the Seahorse XFe24 Extracellular Flux Analyzer. Each ME/CFS (n = 23) and control (n = 16) cell line was assayed over four replicates in at least three independent experiments. (B) Fatty acid carrier carnitine O-palmitoyltransferase 2 and β-oxidation enzyme enoyl-CoA delta isomerase 2 were significantly upregulated (iBAQ) in whole cell mass spectrometry proteomics experiments (independent t-test). Each ME/CFS (n = 22) and control (n = 16) cell line was sampled once. (C) 20 proteins involved in mitochondrial β-oxidation were detected within the whole cell proteomes of ME/CFS and control lymphoblasts. Their relative abundances were compared to the controls and the majority were elevated in ME/CFS cells (fold change > 1). The background colors separate the two tested proportions in this data: blue corresponding to the samples with reduced abundance and pink for samples with elevated abundance. (D) 19 proteins involved in the TCA cycle were detected within the whole cell proteomes of ME/CFS and control lymphoblasts. Their relative abundances were compared to the controls and the majority were elevated in ME/CFS cells (fold change > 1). The background colors indicate the samples with reduced abundance (blue) and samples with elevated abundance (pink).
Figure 8
Figure 8
Stress sensing pathways in ME/CFS are perturbed—TORC1 (Target of Rapamycin Complex I) is chronically hyperactivated. Error bars represent standard errors of the mean. TORC1 activity and response to TORIN2. inhibition is elevated in ME/CFS lymphoblasts (independent t-test). Each ME/CFS (n = 45) and control (n = 22) cell line was assayed over at least three independent experiments. Data is expressed in relative terms as each experiment is normalized to an internal control cell line.

Similar articles

Cited by

References

    1. Carruthers B.M., van de Sande M.I., De Meirleir K.L., Klimas N.G., Broderick G., Mitchell T., Staines D., Powles A.C., Speight N., Vallings R., et al. Myalgic encephalomyelitis: International Consensus Criteria. J. Intern. Med. 2011;270:327–338. doi: 10.1111/j.1365-2796.2011.02428.x. - DOI - PMC - PubMed
    1. Afari N., Buchwald D. Chronic fatigue syndrome: A review. Am. J. Psychiatry. 2003;160:221–236. doi: 10.1176/appi.ajp.160.2.221. - DOI - PubMed
    1. Morris G., Maes M. Mitochondrial dysfunctions in myalgic encephalomyelitis/chronic fatigue syndrome explained by activated immuno-inflammatory, oxidative and nitrosative stress pathways. Metab. Brain Dis. 2014;29:19–36. doi: 10.1007/s11011-013-9435-x. - DOI - PubMed
    1. Smits B., van den Heuvel L., Knoop H., Kusters B., Janssen A., Borm G., Bleijenberg G., Rodenburg R., van Engelen B. Mitochondrial enzymes discriminate between mitochondrial disorders and chronic fatigue syndrome. Mitochondrion. 2011;11:735–738. doi: 10.1016/j.mito.2011.05.005. - DOI - PubMed
    1. O’Neill H.M., Maarbjerg S.J., Crane J.D., Jeppesen J., Jorgensen S.B., Schertzer J.D., Shyroka O., Kiens B., van Denderen B.J., Tarnopolsky M.A., et al. AMP-activated protein kinase (AMPK) beta1beta2 muscle null mice reveal an essential role for AMPK in maintaining mitochondrial content and glucose uptake during exercise. Proc. Natl. Acad. Sci. USA. 2011;108:16092–16097. doi: 10.1073/pnas.1105062108. - DOI - PMC - PubMed

MeSH terms

Substances