

Selection for Growth and Precocity Alters Muscle Metabolism in Nellore Cattle
- PMID: 32041181
- PMCID: PMC7073857
- DOI: 10.3390/metabo10020058
Selection for Growth and Precocity Alters Muscle Metabolism in Nellore Cattle
Abstract
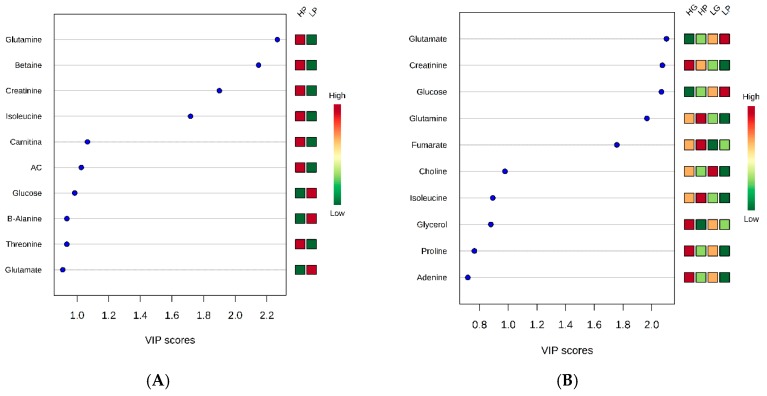
To clarify the relationship between beef genetic selection for growth and precocity with muscle metabolism and metabolites, we performed metabolomic analysis using Longissimus lumborum (LL) muscle from Nellore cattle with divergent selection for these traits (high growth, HG; low growth, LG; high precocity, HP; low precocity, LP). Genetic potential for growth affected muscle protein and energetic metabolism. HG animals had a high concentration of arginine, carnosine, and leucine compared to LG animals. HP animals presented a high concentration of glutamine, betaine, creatinine, isoleucine, carnitine, acetyl carnitine, and lower levels of glucose compared to LP animals, affecting protein and fatty acid metabolism. Intensity of selection (high or low) was correlated with changes in protein metabolism, and the type of selection (growth or precocity) affected fat metabolism. In conclusion, both HG and HP appear to be correlated with a high concentration of protein metabolites and changes in protein metabolic pathways, while selection for precocity is more correlated with changes in fat metabolism compared to animals selected for growth.
Keywords: NMR spectroscopy; Nellore; genetic selection; growth; metabolomics; muscle metabolites; precocity.
Conflict of interest statement
The authors declare no conflicts of interest.
Figures


Similar articles
-
Performance, carcass traits and serum metabolomic profile of Nellore males with different genetic potential for post-weaning growth.Animal. 2020 Apr;14(4):873-880. doi: 10.1017/S1751731119002520. Epub 2019 Oct 25. Animal. 2020. PMID: 31650939
-
Selection signatures in candidate genes and QTL for reproductive traits in Nellore heifers.Anim Reprod Sci. 2019 Aug;207:1-8. doi: 10.1016/j.anireprosci.2019.06.004. Epub 2019 Jun 5. Anim Reprod Sci. 2019. PMID: 31266598
-
Genetic and phenotypic parameters for sexual precocity and parasite resistance traits in Nellore cattle.J Appl Genet. 2023 Dec;64(4):797-807. doi: 10.1007/s13353-023-00781-9. Epub 2023 Sep 8. J Appl Genet. 2023. PMID: 37682511
-
Sustainable Intensification of Beef Production in the Tropics: The Role of Genetically Improving Sexual Precocity of Heifers.Animals (Basel). 2022 Jan 12;12(2):174. doi: 10.3390/ani12020174. Animals (Basel). 2022. PMID: 35049797 Free PMC article. Review.
-
The importance of precocity in evolution.Sci Prog. 2009;92(Pt 3-4):401-13. doi: 10.1177/003685040909200313. Sci Prog. 2009. PMID: 19960878 Free PMC article. Review. No abstract available.
Cited by
-
Genome-Wide Association Analysis Reveals Novel Loci Related with Visual Score Traits in Nellore Cattle Raised in Pasture-Based Systems.Animals (Basel). 2022 Dec 13;12(24):3526. doi: 10.3390/ani12243526. Animals (Basel). 2022. PMID: 36552446 Free PMC article.
-
Performance, Meat Quality and Meat Metabolomics Outcomes: Efficacy of 3-Nitrooxypropanol in Feedlot Beef Cattle Diets.Animals (Basel). 2024 Sep 4;14(17):2576. doi: 10.3390/ani14172576. Animals (Basel). 2024. PMID: 39272361 Free PMC article.
-
Identification of biomarkers associated with the feed efficiency by metabolomics profiling: results from the broiler lines divergent for high or low abdominal fat content.J Anim Sci Biotechnol. 2022 Nov 10;13(1):122. doi: 10.1186/s40104-022-00775-3. J Anim Sci Biotechnol. 2022. PMID: 36352447 Free PMC article.
-
Impact of Cattle Feeding Strategy on the Beef Metabolome.Metabolites. 2022 Jul 13;12(7):640. doi: 10.3390/metabo12070640. Metabolites. 2022. PMID: 35888764 Free PMC article.
-
Applications of Omics Technology for Livestock Selection and Improvement.Front Genet. 2022 Jun 2;13:774113. doi: 10.3389/fgene.2022.774113. eCollection 2022. Front Genet. 2022. PMID: 35719396 Free PMC article. Review.
References
-
- Berg R.T., Butterfield R.M. New Concepts of Cattle Growth. 1st ed. Macarthur Press; Parramatta, Australia: 1976. p. 240.
-
- Abreu Silva B.C., Eler J.P., Santana M.L., Mattos E.C., Menezes I.R., Ferraz J.B.S. Genetic association between mature weight and early growth and heifer pregnancy traits in Nellore cattle. Livest. Sci. 2018;211:61–65. doi: 10.1016/j.livsci.2018.03.003. - DOI
-
- Eler J.P., Ferraz J.B.S., Balieiro J.C.C., Mattos E.C., Mourão G.B. Genetic correlation between heifer pregnancy and scrotal circumference measured at 15 and 18 months of age in Nellore cattle. Genet. Mol. Res. 2006;5:569–580. - PubMed
-
- Campion B., Keane M.G., Kenny D.A., Berry D.P. Evaluation of estimated genetic merit for carcass weight in beef cattle: Blood metabolites, carcass measurements, carcass composition and selected non-carcass components. Livest. Sci. 2009;126:100–111. doi: 10.1016/j.livsci.2009.06.003. - DOI
Grants and funding
LinkOut - more resources
Full Text Sources
Research Materials
Miscellaneous
