. 2020 Feb 6;8(1):70.
doi: 10.3390/vaccines8010070.

Deletion of Vaccinia Virus A40R Gene Improves the Immunogenicity of the HIV-1 Vaccine Candidate MVA-B

Affiliations

Deletion of Vaccinia Virus A40R Gene Improves the Immunogenicity of the HIV-1 Vaccine Candidate MVA-B

Patricia Pérez et al. Vaccines (Basel). .

Abstract

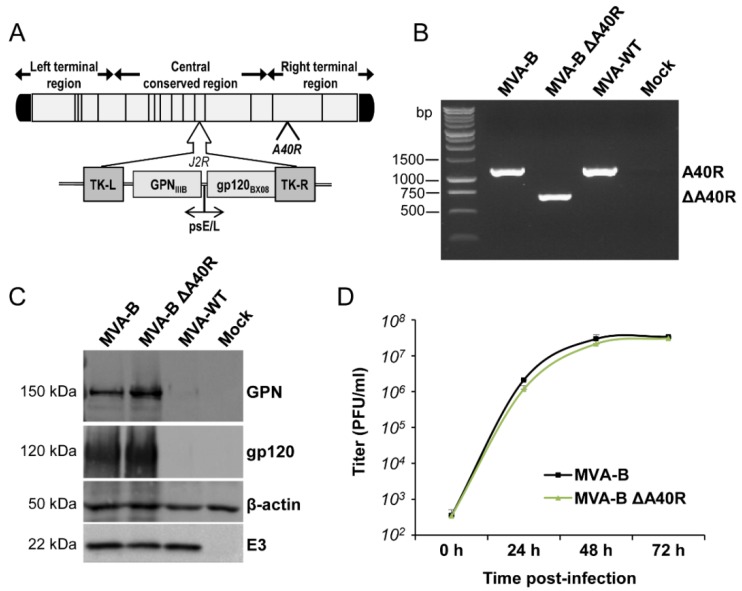
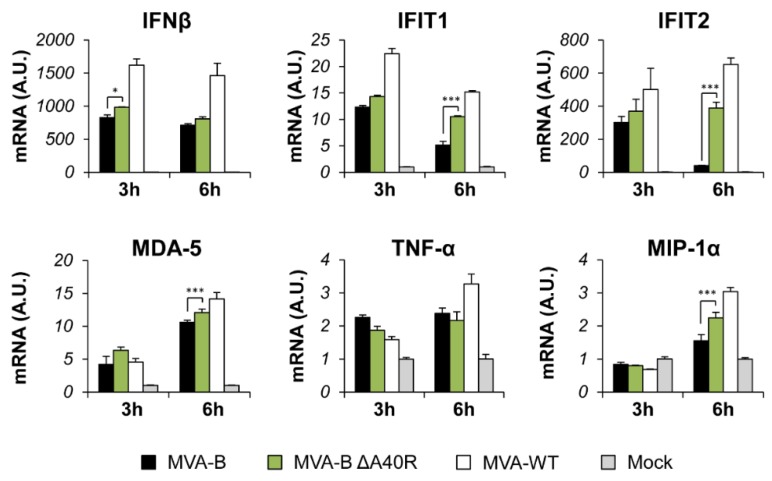
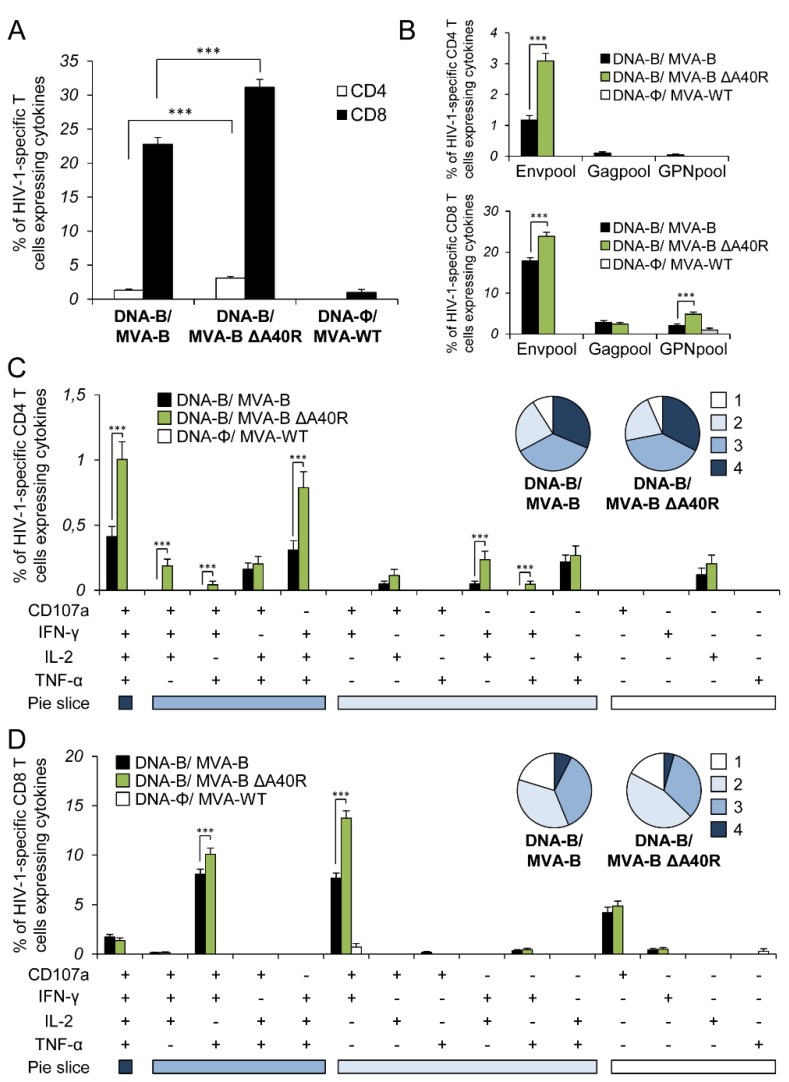
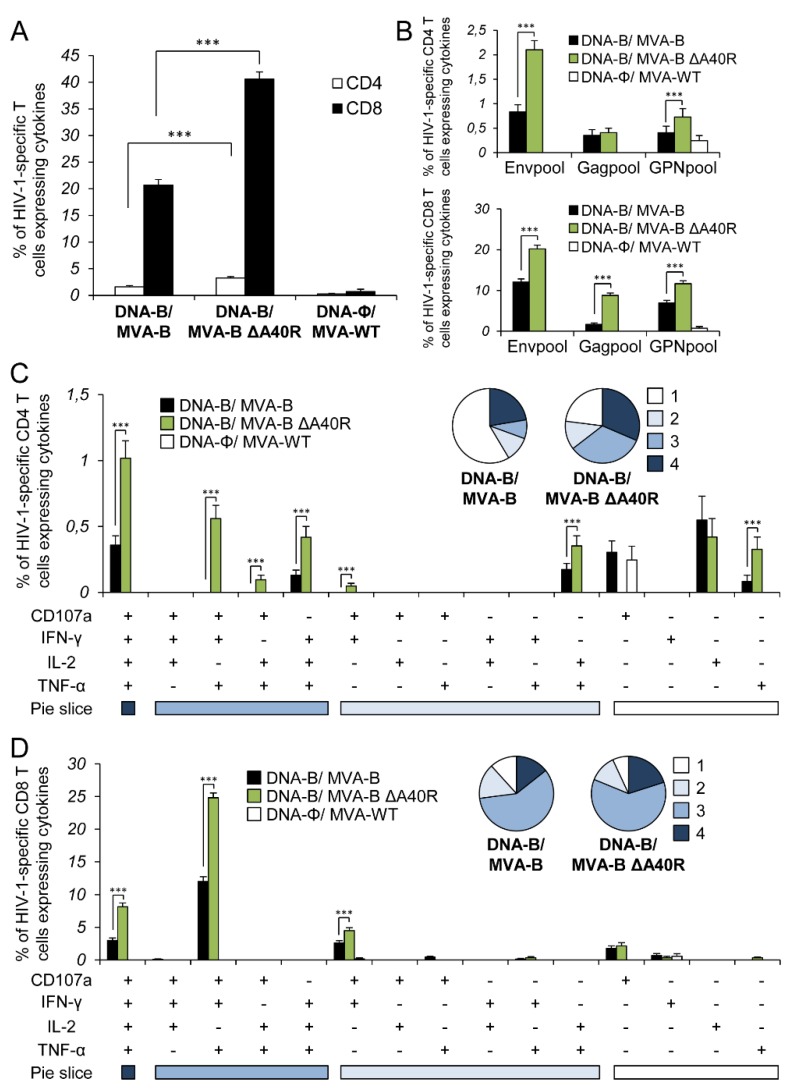
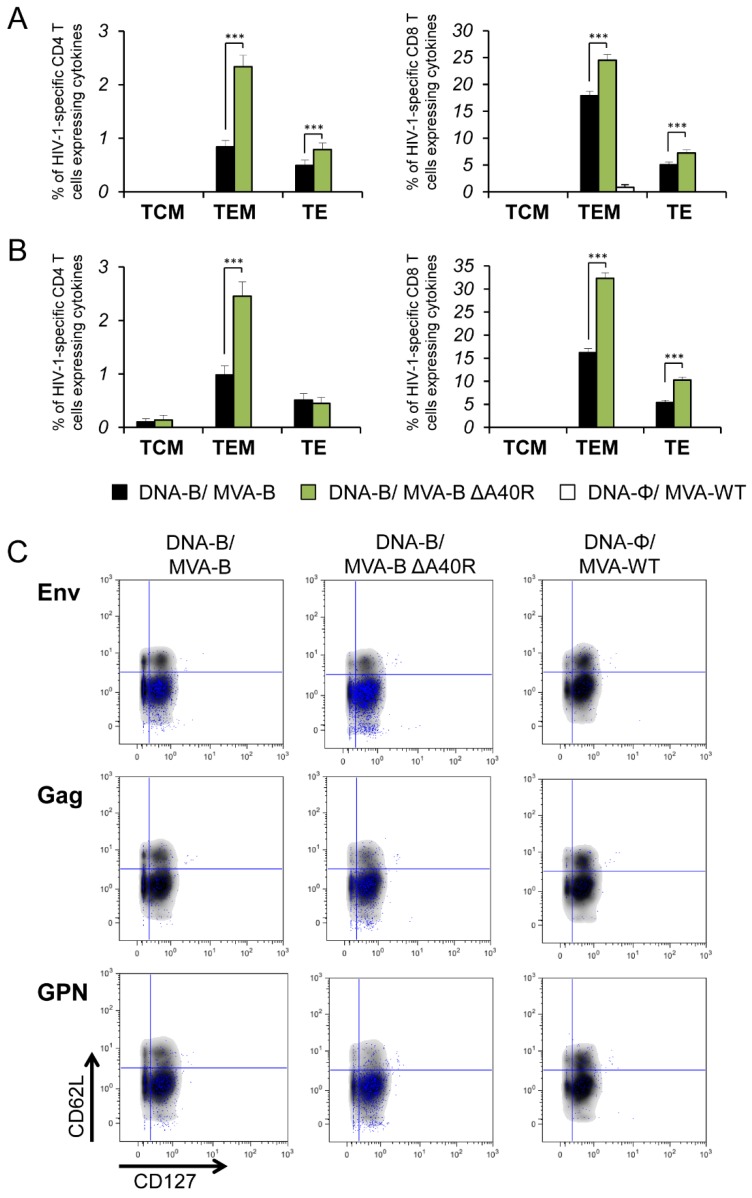
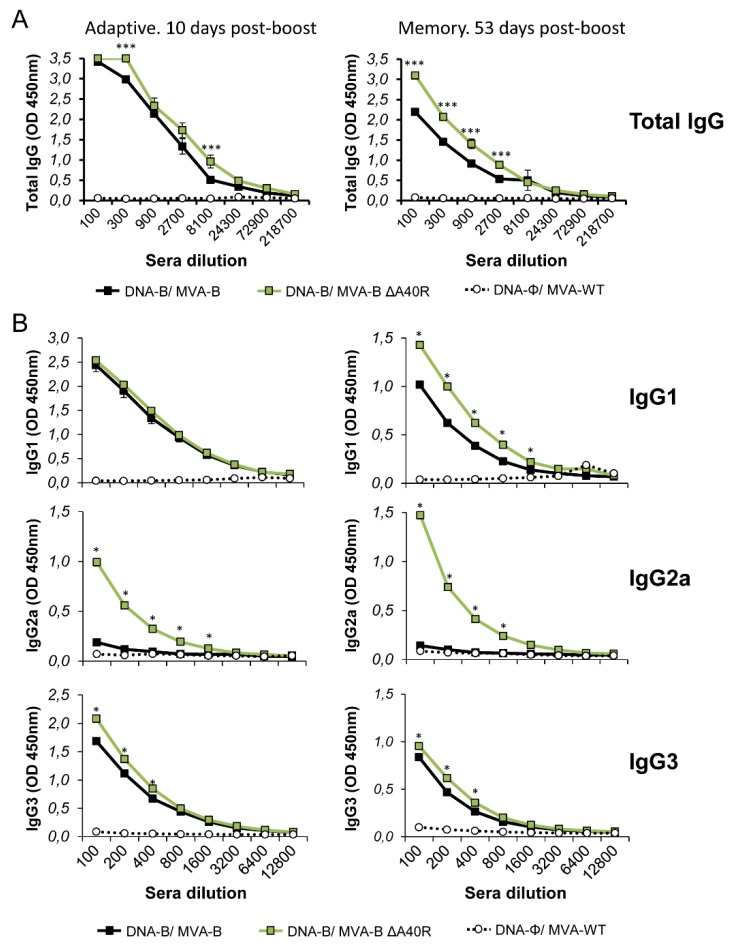
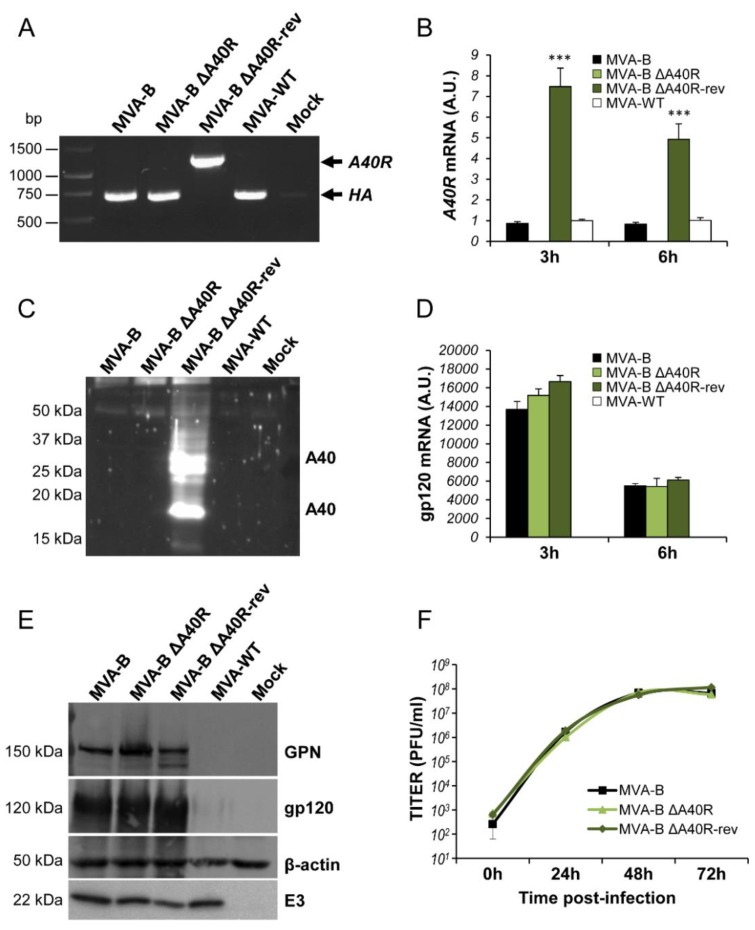
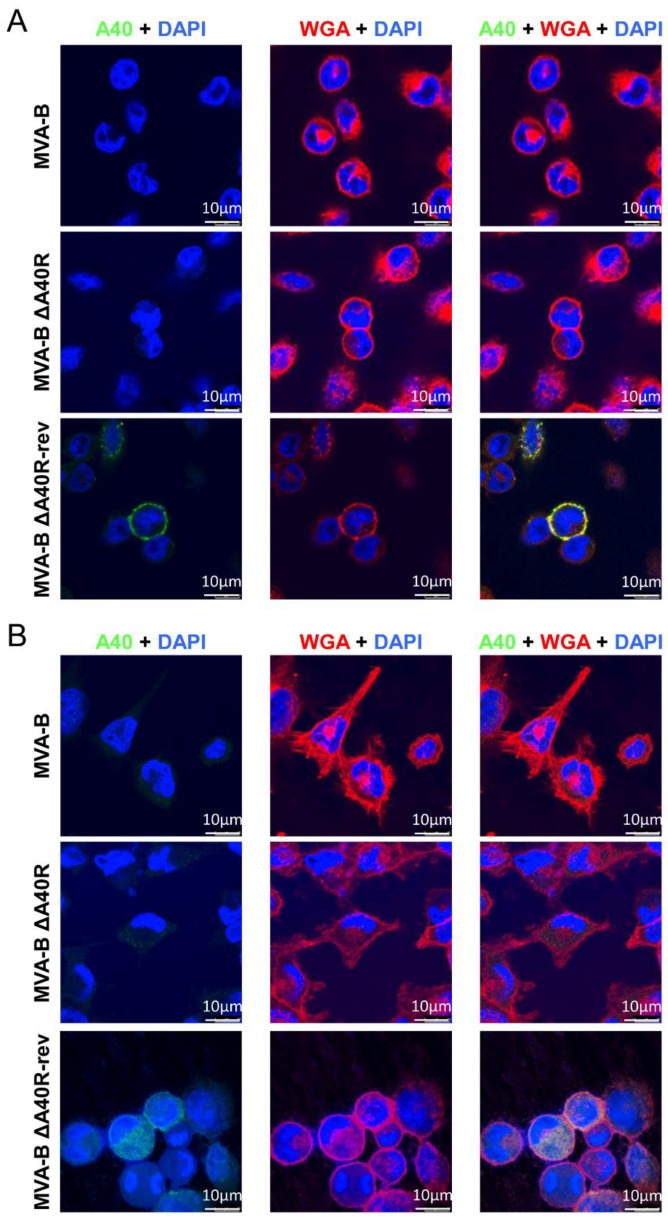
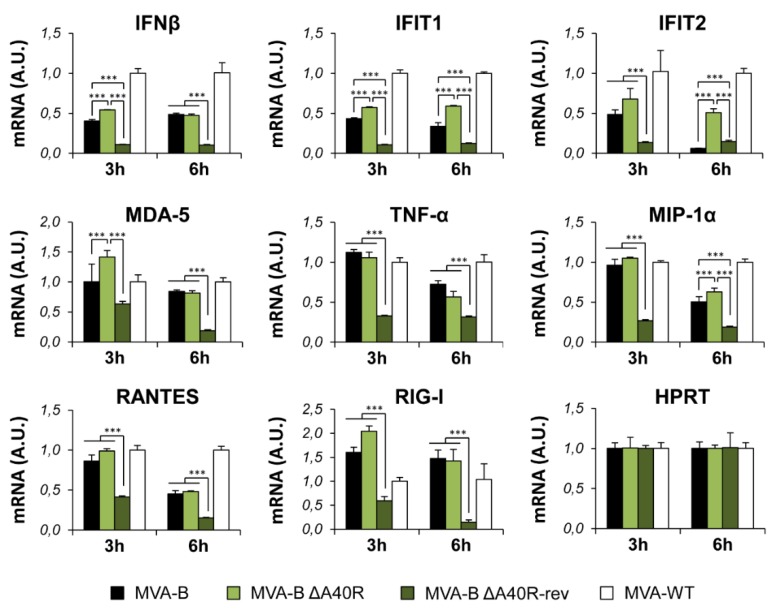
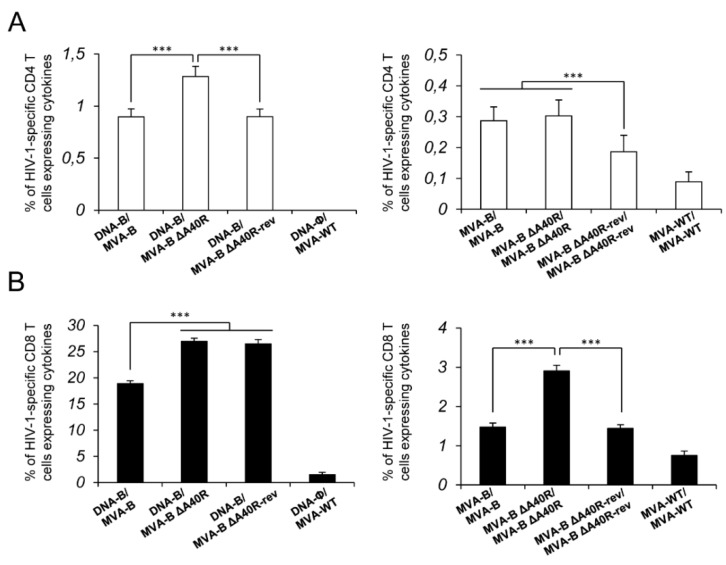
Development of a safe and efficacious vaccine against the HIV/AIDS pandemic remains a major scientific goal. We previously described an HIV/AIDS vaccine based on the modified vaccinia virus Ankara (MVA) expressing HIV-1 gp120 and Gag-Pol-Nef (GPN) of clade B (termed MVA-B), which showed moderate immunogenicity in phase I prophylactic and therapeutic clinical trials. Here, to improve the immunogenicity of MVA-B, we generated a novel recombinant virus, MVA-B ΔA40R, by deleting in the MVA-B genome the vaccinia virus (VACV) A40R gene, which encodes a protein with unknown immune function. The innate immune responses triggered by MVA-B ΔA40R in infected human macrophages, in comparison to parental MVA-B, revealed an increase in the mRNA expression levels of interferon (IFN)-β, IFN-induced genes, and chemokines. Compared to priming with DNA-B (a mixture of DNA-gp120 plus DNA-GPN) and boosting with MVA-B, mice immunized with a DNA-B/MVA-B ΔA40R regimen induced higher magnitude of adaptive and memory HIV-1-specific CD4+ and CD8+ T-cell immune responses that were highly polyfunctional, mainly directed against Env. and of an effector memory phenotype, together with enhanced levels of antibodies against HIV-1 gp120. Reintroduction of the A40R gene into the MVA-B ΔA40R genome (virus termed MVA-B ΔA40R-rev) promoted in infected cells high mRNA and protein A40 levels, with A40 protein localized in the cell membrane. MVA-B ΔA40R-rev significantly reduced mRNA levels of IFN-β and of several other innate immune-related genes in infected human macrophages. In immunized mice, MVA-B ΔA40R-rev reduced the magnitude of the HIV-1-specific CD4+ and CD8+ T cell responses compared to MVA-B ΔA40R. These results revealed an immunosuppressive role of the A40 protein, findings relevant for the optimization of poxvirus vectors as vaccines.

Keywords: A40R gene; HIV vaccine; MVA; immune responses; mice; poxvirus.


Conflict of interest statement

The authors declare no conflict of interest.

Figures

Figure 1
Figure 1
Generation and in vitro characterization of MVA-B ΔA40R. (A) Scheme of the MVA-B ΔA40R genome map (adapted from References [37,54]). The central conserved region and the left and right terminal regions are shown. Below the map, the deleted or fragmented genes are depicted as black boxes. The deleted A40R gene is indicated. The HIV-1 GPN (from isolate IIIB) and gp120 (from isolate Bx08) clade B sequences driven by the VACV sE/L promoter (psE/L) inserted within the TK viral locus (J2R) are indicated. TK-L = TK left flanking region, TK-R = TK right flanking region. (B) PCR analysis of the A40R locus. Viral DNA was extracted from DF-1 cells mock infected or infected at 5 PFU/cell with MVA-WT, MVA-B, or MVA-B ΔA40R. Primers spanning A40R flanking regions were used for PCR analysis of the A40R locus. DNA products corresponding to the A40R gene and the A40R deletion are indicated on the right. Molecular size markers (1 kb ladder) with the corresponding sizes (base pairs) are indicated on the left. (C) Expression of HIV-1BX08 gp120 and HIV-1IIIBGPN proteins. DF-1 cells were mock infected or infected at 5 PFU/cell with MVA-WT, MVA-B, or MVA-B ΔA40R. At 24 h.p.i., cells were lysed in Laemmli buffer, fractionated by 8% SDS-PAGE, and analyzed by Western blotting with rabbit polyclonal anti-gp120 antibody or polyclonal anti-gag p24 serum. Rabbit anti-β-actin and rabbit anti-VACV early E3 protein antibodies were used as protein and VACV loading controls, respectively. The proteins detected are indicated on the right and their protein molecular weights (in kDa) are indicated on the left. (D) Viral growth kinetics. DF-1 cells were infected at 0.01 PFU/cell with MVA-B or MVA-B ΔA40R. At different times (0, 24, 48, and 72 h.p.i.) cells were collected and virus titers of cell lysates were quantified via plaque immunostaining assay with anti-VACV antibodies. The mean and standard deviation of two independent experiments is shown.
Figure 2
Figure 2
MVA-B ΔA40R upregulated the levels of type I IFN, proinflammatory cytokines, and chemokine expression compared to parental MVA-B. Human THP-1 macrophages were mock infected or infected with MVA-WT, MVA-B, or MVA-B ΔA40R at 5 PFU/cell. At 3 and 6 h.p.i., RNA was extracted, and IFN-β, IFIT1, IFIT2, MDA-5, TNF-α, MIP-1α, and HPRT mRNA levels were analyzed by RT-qPCR. Results are expressed as the ratio of the gene of interest to HPRT mRNA levels. A.U., arbitrary units. p values indicate significant response differences between MVA-B and MVA-B ΔA40R at the same hour (*, p < 0.05; ***, p < 0.001). Data shown are means ± standard deviations of triplicate samples from one experiment and are representative of two independent experiments.
Figure 3
Figure 3
Immunization with MVA-B ΔA40R enhanced the magnitude of HIV-1-specific CD4+ and CD8+ T-cell adaptive immune responses. Splenocytes were collected from mice (n = 4 per group) immunized with DNA-ϕ/MVA-WT, DNA-B/MVA-B or DNA-B/MVA-B ΔA40R 10 days after the last immunization. Next, HIV-1-specific CD4+ and CD8+ T-cell adaptive immune responses triggered by the different immunization groups were measured by ICS assay following the stimulation of splenocytes with different HIV-1 peptide pools (Env, Gag, and GPN). Values from unstimulated controls were subtracted in all cases. p values indicate significant response differences between the DNA-B/MVA-B ΔA40R and DNA-B/MVA-B immunization groups (***, p < 0.001). Data are from one experiment representative of three independent experiments. (A) Overall percentages of HIV-1-specific CD4+ and CD8+ T cells. The values represent the sum of the percentages of T cells expressing CD107a and/or IFN-γ and/or TNF-α and/or IL-2 against Env, Gag, and GPN peptide pools. (B) Percentages of Env, Gag, and GPN HIV-1-specific CD4+ and CD8+ T cells. Frequencies represent the sum of the percentages of T cells expressing CD107a and/or IFN-γ and/or TNF-α and/or IL-2 against Env, Gag, or GPN peptide pools. (C,D) Polyfunctional profiles of HIV-1-specific CD4+ (C) and CD8+ (D) T cells. All of the possible combinations of responses are shown on the x axis, while the percentages of T cells expressing CD107a and/or IFN-γ and/or TNF-α and/or IL-2 against Env, Gag, and GPN peptide pools are shown on the y axis. Responses are grouped and color-coded on the basis of the number of functions (4, 3, 2, or 1). The pie charts summarize the data. Each slice corresponds to the proportion of the total HIV-1-specific CD4+ and CD8+ T cells exhibiting 1, 2, 3, or 4 functions (CD107a and/or IFN-γ and/or TNF-α and/or IL-2) within the total HIV-1-specific CD4+ and CD8+ T cells.
Figure 4
Figure 4
Immunization with MVA-B ΔA40R enhanced the magnitude of HIV-1-specific CD4+and CD8+T-cell memory immune responses. Splenocytes were collected from mice (n = 4 per group) immunized with DNA-ϕ/MVA-WT, DNA-B/MVA-B or DNA-B/MVA-B ΔA40R 53 days after the last immunization. Next, HIV-1-specific CD4+ and CD8+ T-cell memory immune responses triggered by the different immunization groups were measured by ICS assay as described in the legend to Figure 3. Values from unstimulated controls were subtracted in all cases. p values indicate significant response differences between the DNA-B/MVA-B ΔA40R and DNA-B/MVA-B immunization groups (***, p < 0.001). Data are from one experiment representative of two independent experiments. (A) Overall percentages of HIV-1-specific CD4+ and CD8+ T cells. The values represent the sum of the percentages of T cells expressing CD107a and/or IFN-γ and/or TNF-α and/or IL-2 against Env, Gag, and GPN peptide pools. (B) Percentages of Env, Gag, and GPN HIV-1-specific CD4+ and CD8+ T cells. Frequencies represent the sum of the percentages of T cells expressing CD107a and/or IFN-γ and/or TNF-α and/or IL-2 against Env, Gag, or GPN peptide pools. (C,D) Polyfunctional profiles of HIV-1-specific CD4+ (C) and CD8+ (D) T cells. All of the possible combinations of responses are shown on the x axis, while the percentages of T cells expressing CD107a and/or IFN-γ and/or TNF-α and/or IL-2 against Env, Gag, and GPN peptide pools are shown on the y axis. Responses are grouped and color-coded on the basis of the number of functions (4, 3, 2, or 1). The pie charts summarize the data. Each slice corresponds to the proportion of the total HIV-1-specific CD4+ and CD8+ T cells exhibiting 1, 2, 3, or 4 functions (CD107a and/or IFN-γ and/or TNF-α and/or IL-2) within the total HIV-1-specific CD4+ and CD8+ T cells.
Figure 5
Figure 5
Phenotypic profile of adaptive and memory HIV-1-specific CD4+ and CD8+ T cells. Percentages of TCM, TEM, and TE HIV-1-specific CD4+ and CD8+ T cells expressing CD107a and/or IFN-γ and/or TNF-α and/or IL-2 against Env, Gag, and GPN peptide pools in the adaptive (A) and memory (B) phases. Values from unstimulated controls were subtracted in all cases. p values indicate significant response differences between the DNA-B/MVA-B ΔA40R and DNA-B/MVA-B immunization groups (***, p < 0.001). (C) Representative flow cytometry phenotypic profile plots of memory HIV-1-specific CD8+ T-cell responses against Env, Gag, and GPN peptide pools. CD8+ T cells expressing CD127 and/or CD62L are shown as density plots in grey and blue dots representing Env-, Gag-, and/or GPN-specific CD8+ T cells expressing CD107a and/or IFN-γ and/or TNF-α and/or IL-2.
Figure 6
Figure 6
Humoral immune responses elicited by MVA-B and MVA-B ΔA40R against HIV-1 gp120 protein. Levels of gp120-specific total IgG (A), and isotype IgG1, IgG2a, and IgG3 (B) binding antibodies were measured by ELISA in pooled sera from mice immunized with DNA-B/MVA-B, DNA-B/MVA-B ΔA40R B or DNA-ϕ/MVA-WT (n = 4, at each time point) 10 days (left panels) or 53 days (right panels) after the last immunization. Mean absorbance values (measured at 450 nm) and standard deviations of duplicate pooled serum dilutions are presented. p values indicate significant differences in antibody levels between the DNA-B/MVA-B and DNA-B/MVA-B ΔA40R immunization groups (*, p < 0.05; ***, p < 0.001) at each dilution. Data are from one experiment representative of at least two independent experiments.
Figure 7
Figure 7
Generation and in vitro characterization of MVA-B ΔA40R-rev virus. (A) PCR analysis of the HA locus. Viral DNA was extracted from DF-1 cells mock infected or infected at 5 PFU/cell with MVA-WT, MVA-B, MVA-B ΔA40R, or MVA-B ΔA40R-rev. Primers spanning the HA flanking regions were used for PCR analysis of the HA locus. DNA products corresponding to the WT HA gene (HA) or to the A40R gene inserted in the HA locus (A40R) are indicated on the right. Molecular size markers (1 kb ladder) with the corresponding sizes (base pairs) are indicated on the left. (B) mRNA levels of MVA A40R gene. Human THP-1 macrophages were mock infected or infected with MVA-WT, MVA-B, MVA-B ΔA40R, or MVA-B ΔA40R-rev at 5 PFU/cell. At 3 and 6 h.p.i., RNA was extracted, and MVA A40R and VACV E3L mRNA levels were analyzed by RT-qPCR. Results are expressed as the ratio of the MVA A40R gene to VACV E3L mRNA levels. A.U.: arbitrary units. p values indicate significant response differences between the different viruses at the same hour (***, p < 0.001). Data are means ± standard deviations of duplicate samples from one experiment and are representative of two independent experiments. (C) Expression of MVA A40 protein. DF-1 cells were mock infected or infected at 5 PFU/cell with MVA-WT, MVA-B, MVA-B ΔA40R, or MVA-B ΔA40R-rev. At 24 h.p.i. cells were lysed in Laemmli buffer, fractionated by 8% SDS-PAGE, and analyzed by Western blotting with rabbit polyclonal anti-A40 antibody. On the right is indicated the position of the MVA A40 protein. The sizes (in kDa) of standards (Precision Plus protein standards; Bio-Rad Laboratories) are indicated on the left. (D) mRNA levels of HIV-1BX08 gp120 gene. Human THP-1 macrophages were mock infected or infected with MVA-WT, MVA-B, MVA-B ΔA40R, or MVA-B ΔA40R-rev at 5 PFU/cell. At 3 and 6 h.p.i., RNA was extracted, and HIV-1BX08 gp120 and endogenous HPRT mRNA levels were analyzed by RT-qPCR. Results are expressed as the ratio of the HIV-1BX08 gp120 gene to HPRT mRNA levels. A.U.: arbitrary units. Data are means ± standard deviations of duplicate samples from one experiment and are representative of two independent experiments. (E) Expression of HIV-1BX08 gp120 and HIV-1IIIBGPN proteins. DF-1 cells were mock infected or infected at 5 PFU/cell with MVA-WT, MVA-B, MVA-B ΔA40R, or MVA-B ΔA40R-rev. At 24 h.p.i., cells were lysed in Laemmli buffer, fractionated by 8% SDS-PAGE, and analyzed by Western blotting with rabbit polyclonal anti-gp120 antibody or rabbit anti-gag p24 serum. Rabbit anti-β-actin and rabbit anti-VACV early E3 protein antibodies were used as protein and VACV loading controls, respectively. The proteins detected are indicated on the right and their protein molecular weights (in kDa) are indicated on the left. (F) Viral growth kinetics. DF-1 cells were infected at 0.01 PFU/cell with MVA-B, MVA-B ΔA40R, or MVA-B ΔA40R-rev. At different times (0, 24, 48, and 72 h.p.i.) cells were collected and virus titers of cell lysates were quantified by plaque immunostaining assay with anti-VACV antibodies. The mean and standard deviations of two independent experiments is shown.
Figure 8
Figure 8
MVA A40 protein localized at the cell membrane. HeLa cells were infected at 0.5 PFU/cell with MVA-B, MVA-B ΔA40R, and MVA-B ΔA40R-rev, and at 18 h.p.i. non-permeabilized (A) or permeabilized (B) fixed cells were stained with a rabbit anti-A40 polyclonal antibody further detected with an anti-rabbit secondary antibody conjugated with the fluorochrome Alexa Fluor 488 (green) and with a wheat germ agglutinin (WGA) probe conjugated to the fluorescent dye Alexa Fluor 594 (red). Cell nuclei were stained using 4′,6-diamidino-2-phenylindole (DAPI) (blue). Scale bar: 10 μm.
Figure 9
Figure 9
MVA-B ΔA40R-rev downregulated the mRNA levels of type I IFN, proinflammatory cytokines, and chemokines. Human THP-1 macrophages were mock infected or infected with MVA-WT, MVA-B, MVA-B ΔA40R, or MVA-B ΔA40R-rev at 5 PFU/cell. At 3 and 6 h.p.i., RNA was extracted, and IFN-β, IFIT1, IFIT2, MDA-5, TNF-α, MIP-1α, RANTES, RIG-I, HPRT, and VACV E3L mRNA levels were analyzed by RT-qPCR. Results are expressed as the ratio of the gene of interest to VACV E3L mRNA levels. A.U.: arbitrary units. p values indicate significant response differences between MVA-B, MVA-B ΔA40R, and MVA-B ΔA40R-rev at the same hour (**, p < 0.005; ***, p < 0.001). Data are means ± standard deviations of triplicate samples from one experiment and are representative of two independent experiments.
Figure 10
Figure 10
Immunization with MVA-B ΔA40R-rev impairs the magnitude of HIV-1-specific T-cell immune responses. Splenocytes were collected from mice (n = 4 per group) immunized with heterologous DNA/MVA (left panels) or homologous MVA/MVA (right panels) prime/boost immunization protocols, 10 days after the last immunization. Next, HIV-1-specific CD4+ and CD8+ T-cell adaptive immune responses triggered by the different immunization groups were measured by ICS assay as described in the legend to Figure 3. Values from unstimulated controls were subtracted in all cases. p values indicate significant response differences between immunization groups (***, p < 0.001). (A) Overall percentages of HIV-1-specific CD4+ T cells in the DNA/MVA (left panel) or MVA/MVA (right panel) immunization regimens. The values represent the sum of the percentages of CD4+ T cells expressing CD107a and/or IFN-γ and/or TNF-α and/or IL-2 against Env, Gag, and GPN peptide pools. (B) Overall percentages of HIV-1-specific CD8+ T cells in the DNA/MVA (left panel) or MVA/MVA (right panel) immunization regimens. The values represent the sum of the percentages of CD8+ T cells expressing CD107a and/or IFN-γ and/or TNF-α and/or IL-2 against Env, Gag, and GPN peptide pools.

Similar articles

Cited by

References

    1. Gao Y., McKay P.F., Mann J.F.S. Advances in HIV-1 vaccine development. Viruses. 2018;10:167. doi: 10.3390/v10040167. - DOI - PMC - PubMed
    1. Mcmichael A.J., Koff W.C. Vaccines that stimulate T cell immunity to HIV-1: The next step. Nat. Immunol. 2014;15:319–322. doi: 10.1038/ni.2844. - DOI - PMC - PubMed
    1. Barouch D.H., Santra S., Schmitz J.E., Kuroda M.J., Fu T.M., Wagner W., Bilska M., Craiu A., Zheng X.X., Krivulka G.R., et al. Control of viremia prevention of clinical AIDS in rhesus monkeys by cytokine-augmented DNA vaccination. Science. 2000;290:486–492. doi: 10.1126/science.290.5491.486. - DOI - PubMed
    1. Mooij P., Balla-Jhagjhoorsingh S.S., Koopman G., Beenhakker N., van Haaften P., Baak I., Nieuwenhuis I.G., Kondova I., Wagner R., Wolf H., et al. Differential CD4+ versus CD8+ T-cell responses elicited by different poxvirus-based human immunodeficiency virus Type 1 vaccine candidates provide comparable efficacies in Primates. J. Virol. 2008;82:2975–2988. doi: 10.1128/JVI.02216-07. - DOI - PMC - PubMed
    1. Amara R.R., Ibegbu C., Villinger F., Montefiori D.C., Sharma S., Nigam P., Xu Y., McClure H.M., Robinson H.L. Studies using a viral challenge and CD8 T cell depletions on the roles of cellular and humoral immunity in the control of an SHIV-89.6P challenge in DNA/MVA-vaccinated macaques. Virology. 2005;343:246–255. doi: 10.1016/j.virol.2005.08.027. - DOI - PubMed