

Genomewide Mapping of Selection Signatures and Genes for Extreme Feather Pecking in Two Divergently Selected Laying Hen Lines
- PMID: 32041297
- PMCID: PMC7070400
- DOI: 10.3390/ani10020262
Genomewide Mapping of Selection Signatures and Genes for Extreme Feather Pecking in Two Divergently Selected Laying Hen Lines
Abstract
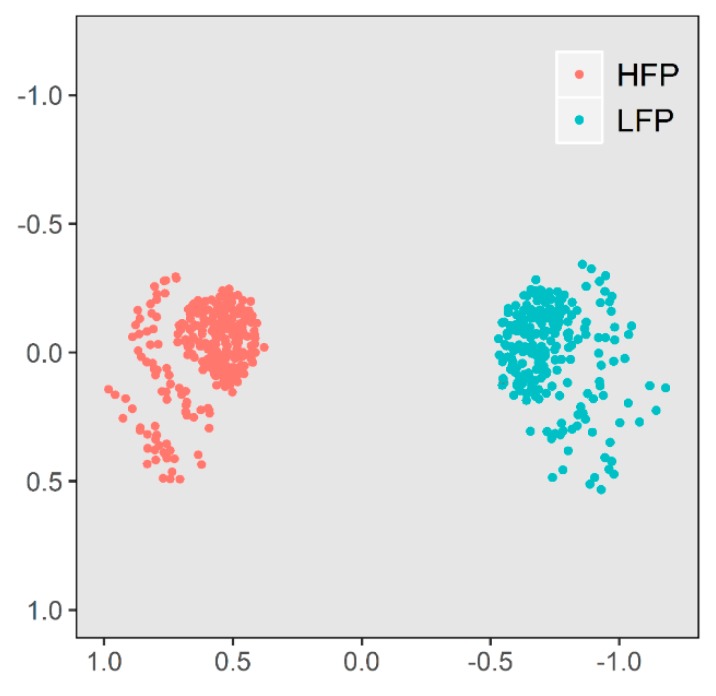
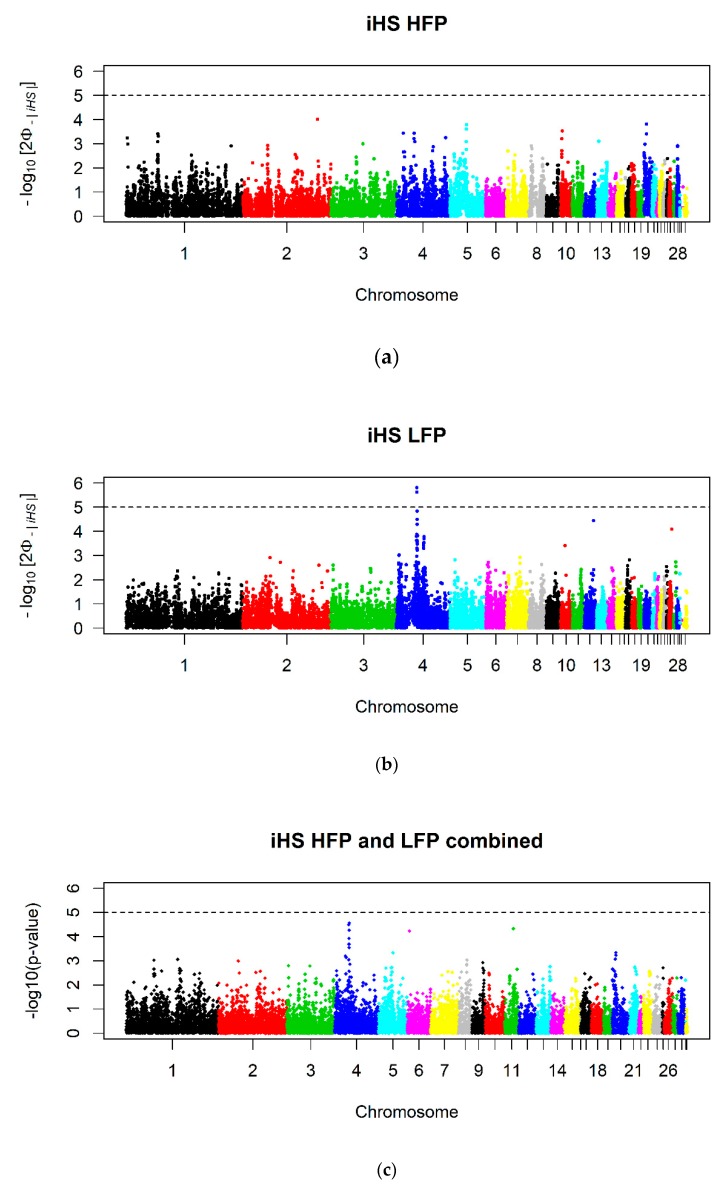
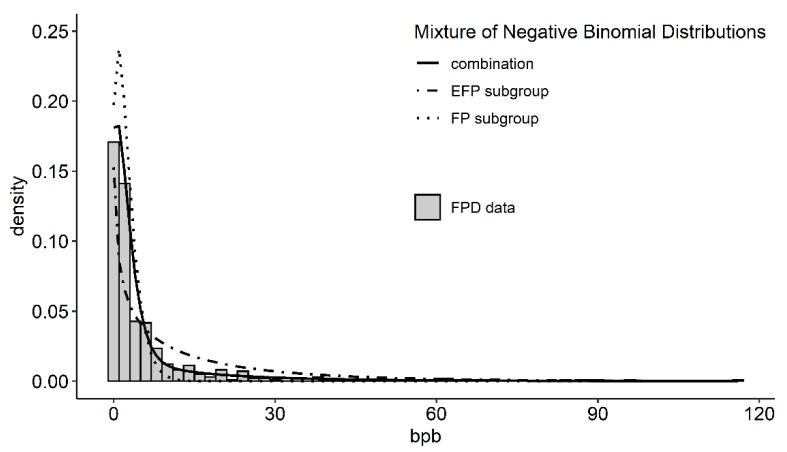
Feather pecking (FP) is a longstanding serious problem in commercial flocks of laying hens. It is a highly polygenic trait and the genetic background is still not completely understood. In order to find genomic regions influencing FP, selection signatures between laying hen lines divergently selected for high and low feather pecking were mapped using the intra-population iHS and the inter-population FST approach. In addition, the existence of an extreme subgroup of FP hens (EFP) across both selected lines has been demonstrated by fitting a mixture of negative binomial distributions to the data and calculating the posterior probability of belonging to the extreme subgroup (pEFP) for each hen. A genomewide association study (GWAS) was performed for the traits pEFP and FP delivered (FPD) with a subsequent post GWAS analysis. Mapping of selection signatures revealed no clear regions under selection. GWAS revealed a region on Chromosome 1, where the existence of a QTL influencing FP is likely. The candidate genes found in this region are a part of the GABAergic system, which has already been linked to FP in previous studies. Despite the polygenic nature of FP, selection on these candidate genes may reduce FP.
Keywords: QTL; divergent selection; extreme feather pecking; laying hens; selection signatures.
Conflict of interest statement
The authors declare no conflict of interest. The funders had no role in the design of the study; in the collection, analyses, or interpretation of data; in the writing of the manuscript, or in the decision to publish the results.
Figures


Similar articles
-
Meta-analyses of genome wide association studies in lines of laying hens divergently selected for feather pecking using imputed sequence level genotypes.BMC Genet. 2020 Oct 1;21(1):114. doi: 10.1186/s12863-020-00920-9. BMC Genet. 2020. PMID: 33004014 Free PMC article.
-
A Novel Model to Explain Extreme Feather Pecking Behavior in Laying Hens.Behav Genet. 2020 Jan;50(1):41-50. doi: 10.1007/s10519-019-09971-w. Epub 2019 Sep 20. Behav Genet. 2020. PMID: 31541310
-
A genome-wide association study in a large F2-cross of laying hens reveals novel genomic regions associated with feather pecking and aggressive pecking behavior.Genet Sel Evol. 2017 Feb 3;49(1):18. doi: 10.1186/s12711-017-0287-4. Genet Sel Evol. 2017. PMID: 28158968 Free PMC article.
-
Review of Sensor Technologies in Animal Breeding: Phenotyping Behaviors of Laying Hens to Select Against Feather Pecking.Animals (Basel). 2019 Mar 22;9(3):108. doi: 10.3390/ani9030108. Animals (Basel). 2019. PMID: 30909407 Free PMC article. Review.
-
Where in the serotonergic system does it go wrong? Unravelling the route by which the serotonergic system affects feather pecking in chickens.Neurosci Biobehav Rev. 2018 Dec;95:170-188. doi: 10.1016/j.neubiorev.2018.07.007. Epub 2018 Jul 25. Neurosci Biobehav Rev. 2018. PMID: 30055196 Review.
Cited by
-
Comparison of linear mixed models for genetic feather score analysis in laying hens kept in recurrent testing facilities.Poult Sci. 2025 Feb;104(2):104833. doi: 10.1016/j.psj.2025.104833. Epub 2025 Jan 20. Poult Sci. 2025. PMID: 39879719 Free PMC article.
-
Meta-analyses of genome wide association studies in lines of laying hens divergently selected for feather pecking using imputed sequence level genotypes.BMC Genet. 2020 Oct 1;21(1):114. doi: 10.1186/s12863-020-00920-9. BMC Genet. 2020. PMID: 33004014 Free PMC article.
-
Analysis of the brain transcriptome in lines of laying hens divergently selected for feather pecking.BMC Genomics. 2020 Aug 27;21(1):595. doi: 10.1186/s12864-020-07002-1. BMC Genomics. 2020. PMID: 32854615 Free PMC article.
-
Gut Microbial Composition and Predicted Functions Are Not Associated with Feather Pecking and Antagonistic Behavior in Laying Hens.Life (Basel). 2021 Mar 12;11(3):235. doi: 10.3390/life11030235. Life (Basel). 2021. PMID: 33809351 Free PMC article.
-
eQTL analysis of laying hens divergently selected for feather pecking identifies KLF14 as a potential key regulator for this behavioral disorder.Front Genet. 2022 Aug 17;13:969752. doi: 10.3389/fgene.2022.969752. eCollection 2022. Front Genet. 2022. PMID: 36061196 Free PMC article.
References
-
- Rodenburg T.B., van Krimpen M.M., de Jong I.C., de Haas E.N., KOPS M.S., Riedstra B.J., Nordquist R.E., Wagenaar J.P., Bestman M., Nicol C.J. The prevention and control of feather pecking in laying hens: Identifying the underlying principles. Worlds Poult. Sci. J. 2013;69:361–374. doi: 10.1017/S0043933913000354. - DOI
-
- Wysocki M., Bessei W., Kjaer J.B., Bennewitz J. Genetic and physiological factors influencing feather pecking in chickens. Worlds Poult. Sci. J. 2010;66:659–672. doi: 10.1017/S0043933910000644. - DOI
-
- Buitenhuis A.J., Kjaer J.B. Long term selection for reduced or increased pecking behaviour in laying hens. Worlds Poult. Sci. J. 2008;64:477–487. doi: 10.1017/S0043933908000159. - DOI
-
- Buitenhuis A.J., Rodenburg T.B., van Hierden Y.M., Siwek M., Cornelissen S.J.B., Nieuwland M.G.B., Crooijmans R.P.M.A., Groenen M.A.M., Koene P., Korte S.M., et al. Mapping Quantitative Trait Loci Affecting Feather Pecking Behavior and Stress Response in Laying Hens. Poult. Sci. 2003;82:1215–1222. doi: 10.1093/ps/82.8.1215. - DOI - PubMed
Grants and funding
LinkOut - more resources
Full Text Sources
Miscellaneous
